
|
|
|
The development of atherosclerosis is driven by inflammation which leads to structural adaptations resulting in the formation of a plaque. It was recently shown that regions of oxidative stress can be quantified in sections of atherosclerotic plaques using electronic paramagnetic resonance imaging (EPRI), via the detection of reactive oxygen species trapped to form stable nitroxide free radicals.1 EPRI is blind to structural features, so in order to improve the understanding of the interplay between inflammation and structure, it is necessary to correlate the EPRI signal with methods that describe the plaque morphology and composition. The aim of this study is to show how the combination of EPRI and advanced optical microscopy can shed light on this relationship. Thus, in addition to EPRI, we will employ nonlinear optical microscopy (NLOM) to investigate the correlation between structure and inflammatory state in the very same plaque. Reactive oxygen species and other free radicals, hallmarks of inflammation, can be detected through their electron paramagnetic resonance (EPR) in combination with EPR spin traps.2 Although other techniques to study free radicals are mainly based on indirect effects, such as assessment of oxidative tissue damage or spectrophotometric observations of cytochrome C reduction, EPR provides direct measurements of the free radicals present in the sample.1 Due to the high reactivity of the radicals in biological samples, spin trapping is normally used. Although X-band EPR spectroscopy is a routine spectroscopic method, EPRI is a technique under development and is less commonly utilized. EPRI is based on the addition of magnetic field gradients to provide a spatial resolution, similar in concept to MRI.3 NLOM is capable of imaging many biological structures relevant to atherosclerotic plaques without the need for staining.4 Second-harmonic generation (SHG) shows the distribution of collagen fibers, which is a key component in the vulnerability of a plaque. Two-photon excited fluorescence (TPEF) provides a strong signal from the elastic lamina. Coherent anti-stokes Raman scattering (CARS) has been used to image lipids which are important components in the development of the plaque. Combined CARS and SHG recently demonstrated the ability to identify cholesterol crystals (CCs) and a method for separating CCs from other lipids.5 CCs have, in recent publications, been identified as a significant proinflammatory component.6 We here demonstrate that the combination of inflammatory information from EPRI and structural data from NLOM provide valuable insight into plaque physiology. A patient scheduled for carotid endarterectomy was informed about the purpose of the study (approved by the local ethical committee) and provided written consent to participate. The plaque was collected from a patient with minor stroke on the ipsilateral side. Duplex ultrasound preoperatively before carotid endarterectomy showed that the plaque composition was atheromatous with calcification as well as signs of cap rupture. The carotid atherosclerotic plaque was placed in a plastic bottle and snap frozen in liquid nitrogen immediately after surgery and transported in liquid nitrogen for EPR imaging. Two sections were used for NLOM. The developed EPRI protocol was based on spin trapping with the cyclic hydroxylamine spin probe 1-hydroxy-3-methoxycarbonyl-2,2,5,5-tetramethylpyrrolidine (CMH) and X-band EPR imaging (typically, 30 mL of 30 mM CMH solution was deployed). EPR and EPRI were performed using an X-band (9.6 GHz) Bruker E540 EPR and EPR imaging spectrometer equipped with an E540GC2X two-axis X-band gradient coil. Samples were placed in a WG-806-A-Q-P suprasil tissue cell in the ER4108TMHS resonator and typical parameters for recording the images were: microwave power—10 mW; modulation amplitude—0.15 mT; modulation frequency—100 kHz; sweep width—15 mT; sweep time—10 s; and number of averaged scans for each angle—5. The specific EPR parameters for imaging were field of view—; gradient—; pixel size—; spectrum width 5 mT; and 21 gradient angles. Using these parameters, the raw data for each image took approximately 25 min to record. Our own MATLAB-based software for back projection based on deconvolution and image reconstruction based on the iradon routine along with Shep-Loggan filtering was developed. For more details, refer to Gustafsson et al.1 NLOM images were collected on a commercial Leica SP8 confocal microscope with a , 0.95 NA water immersion objective. A femtosecond laser tuned to 890 nm was used for excitation. Both signals were collected by nondescanned detectors in the forward direction, using and bandpass filters for SHG and TPEF, respectively. The EPRI signals of two sections are shown in Figs. 1(a) and 2(a), overlayed on a photograph of the sample. We recently showed that high EPRI signal intensity in some areas correlate with high concentrations of foamy macrophages in the histological images and thus indicate increased activity and cellularity.1 However, not all macrophage accumulations showed high EPRI signal intensity, which warrants a more detailed study of the relationship between the EPRI signal and the plaque structure using NLOM. Fig. 1(a) Electronic paramagnetic resonance imaging (EPRI) intensity overlaid on sample. (b) Second-harmonic generation (SHG) (green) and two-photon excited fluorescence (TPEF) (red) of area corresponding to area b in (a). (c) Nonlinear optical microscopy (NLOM) image of area c in (a). (d) NLOM image of region of interest (ROI) in (b). (e) NLOM image of ROI in (c). Scalebars (a)–(e): 5 mm, , , , and . 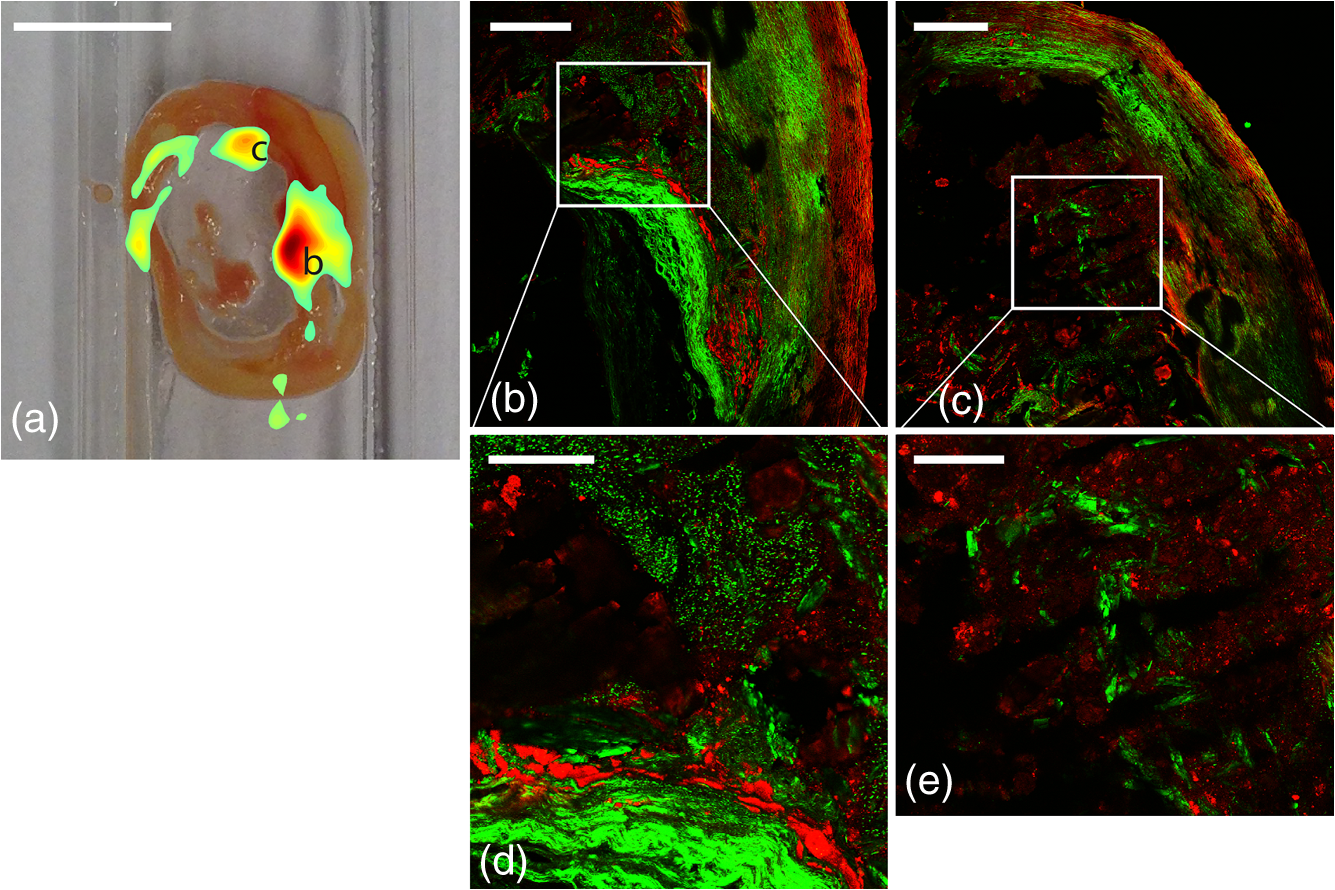 Fig. 2(a) EPRI intensity overlayed on sample. (b) SHG (green) and TPEF (red) of same sample. (c and d) NLOM images of ROIs in (b). Scale bars (a) 5 mm, (b) 2 mm, (c) , and (d) . 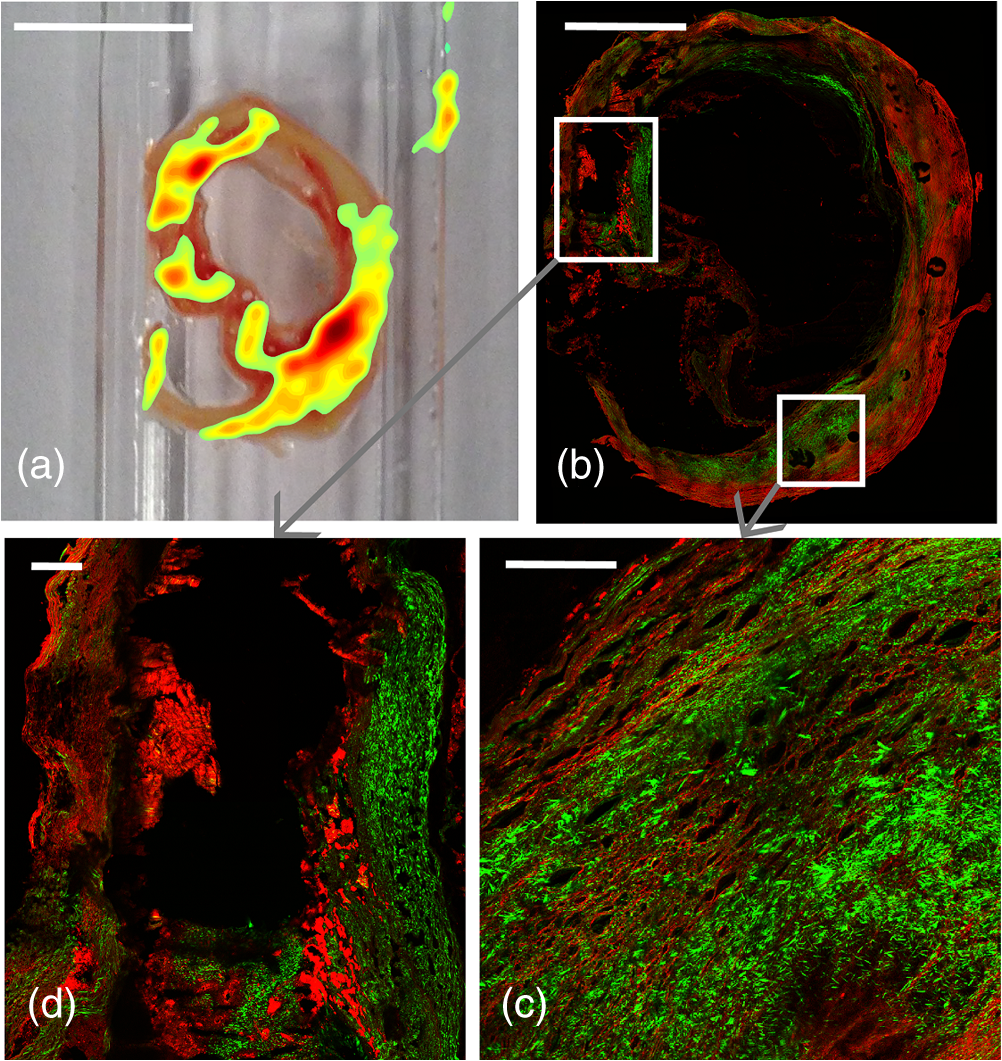 Figures 1(b) and 1(c) show the NLOM images of the region around the brightest spots [b and c in Fig. 1(a)] in the EPRI image. These spots occur where the plaque has a thin collagen cap [green, lower part Fig. 1(d)] and is dense with CCs [green, upper part Figs. 1(d) and 1(e)]. The SHG from collagen and CCs was separated based on morphology. Also, the EPRI hotspot in the lower right of Fig. 2(a) colocalizes with a plaque dense in CCs [Fig. 2(c)]. The hotspot in the upper left of Fig. 2(a) is a calcified region (verified by histology), but here there are also areas which are dense with CCs [green, lower part of Fig. 2(d)]. In this limited sample, there appears to be a general correlation between a strong EPRI signal, indicating inflammation, and a dense concentration of CCs as seen in the SHG images. This is extremely interesting in light of recent results on the proinflammatory effect of CCs.6 The NLOM images further reveal several structural features not readily seen in conventional histology, highlighting the value of NLOM as a supplementary method. Collagen fibrils give a strong SHG signal and can be separated from CCs by their wavy or fibrous structure. Figure 3(a) shows the collagen fibrils in the conventional cap-like structure with high contrast delineation from the lipid core, characterized by the fluorescent lipid droplets. Such high contrast images of the collagen cap are valuable in providing quantitative structural information which is useful in assessing the biomechanical stability of a plaque. Fig. 3SHG (green) and TPEF (red). (a) Collagen cap (green) and lipid droplets (red). (b) Large and small cholesterol crystals (CCs) (green). (c) Calcification. (d) Elastic laminas. (e) Needle-shaped CCs. (f) Plate-shaped CCs. All scalebars are .  Interestingly, collagen was also observed in the calcified regions [Fig. 1(c)]. One can clearly see that the calcified material is reinforced by collagen fibers similar to bone even though the organization is different. The brittle tissue breaks up during sectioning, causing the black voids seen in the image. Calcifications were easily identified from NLOM images alone based on their structural morphology, consisting of a diffuse, relatively homogeneous fluorescence background and the highly oriented collagen fibrils. Lipids (both fatty acids and cholesterol) are typically washed out in the processing for conventional histology from paraffin embedded sections leaving only empty spaces and making quantitative evaluation more difficult. Tryglycerids and esterfied cholesterol can be imaged in frozen sections stained with, e.g., Oil Red O. It is, however, advantageous to have a label free technique like TPEF which can generate high contrast images of lipid accumulations. This requires fewer processing steps and is, therefore, less prone to artifacts and uneven staining. There are, however, other fluorescent components in the plaque so that the interpretation of lipid localization requires the use of morphological cues. CARS on the other hand provides better chemical specificity and can also provide information on the type of lipid present.7,8 CCs exhibit a strong SHG signal [Figs. 3(b), 3(e), and 3(f)] and can be distinguished from collagen by its morphology. Both needle- [Fig. 3(e)] and plate-shaped [Fig. 3(f)] CCs were observed and could be distinguished from the fibrous morphology of the collagen. The three-dimensional morphology was confirmed by collecting z-stacks. A range of differently sized CCs were observed (from 3 to ). In Fig. 3(b), large CCs are seen in the lower left and smaller ones in the upper right. Most CCs are associated with lipid-rich regions [Fig. 3(b)], which are washed out during histological preparation of paraffin embedded samples. In such preparations, CCs are detected through needle-shaped spaces. It seems unlikely that the absence of the smallest CCs will still be visible. Hence, the presence of CCs is probably greatly underestimated in histological evaluation of paraffin embedded samples. In the SHG images, however, the CCs stand out with strong contrast. In conclusion, by comparing EPRI showing inflammation directly with structures seen in NLOM, it appears that regions of high oxidative stress are correlated with a high density of CCs. We also show that NLOM highlights many structural features not readily observed in conventional histology. AcknowledgmentsThe Swedish Research Council, Grant No. diarienr 2009-5430 (H.G.). M.L. thanks Linköping University for a guest professor tenure. We thank Maria Jonson at Linköping University for the preparation of cryosections. ReferencesH. K. Gustafsson et al.,
“Visualization of oxidative stress in ex vivo biopsies using electron paramagnetic resonance imaging,”
Magn. Reson. Med.,
(2014). http://dx.doi.org/10.1002/mrm.25267 MRMEEN 0740-3194 Google Scholar
S. Dikalov, K. K. Griendling and D. G. Harrison,
“Measurement of reactive oxygen species in cardiovascular studies,”
Hypertension, 49 717
–27
(2007). http://dx.doi.org/10.1161/01.HYP.0000258594.87211.6b HPRTDN 0194-911X Google Scholar
L. J. Berliner, In Vivo EPR (ESR): Theory and Applications, Kluwer Academic/Plenum Publishers, New York
(2003). Google Scholar
M. B. Lilledahl et al.,
“Characterization of vulnerable plaques by multiphoton microscopy,”
J. Biomed. Opt., 12 044005
(2007). http://dx.doi.org/10.1117/1.2772652 JBOPFO 1083-3668 Google Scholar
J. L. Suhalim et al.,
“Characterization of cholesterol crystals in atherosclerotic plaques using stimulated Raman scattering and second-harmonic generation microscopy,”
Biophys. J., 102 1988
–1995
(2012). http://dx.doi.org/10.1016/j.bpj.2012.03.016 BIOJAU 0006-3495 Google Scholar
S. Nymo et al.,
“Cholesterol crystal-induced endothelial cell activation is complement-dependent and mediated by TNF,”
Immunobiology, 219 786
–792
(2014). http://dx.doi.org/10.1016/j.imbio.2014.06.006 28CKAQ 0171-2985 Google Scholar
S.-H. Kim et al.,
“Multiplex coherent anti-stokes Raman spectroscopy images intact atheromatous lesions and concomitantly identifies distinct chemical profiles of atherosclerotic lipids,”
Circ. Res., 106 1332
–1341
(2010). http://dx.doi.org/10.1161/CIRCRESAHA.109.208678 CIRUAL 0009-7330 Google Scholar
R. S. Lim et al.,
“Identification of cholesterol crystals in plaques of atherosclerotic mice using hyperspectral CARS imaging,”
J. Lipid Res., 52 2177
–86
(2011). http://dx.doi.org/10.1194/jlr.M018077 JLPRAW 0022-2275 Google Scholar
|


