|
|
|
Images of turbid media, such as tissue, can have a reduction of image contrast from scattering (which causes blurring) and from absorption of light (which reduces the number of photons) by structures such as biomolecules (water, collagen and elastin, lipids, hemoglobin, and deoxyhemoglobin).1,2 Scattering of light causes images to blur, while absorption of light by biomolecules will remove photons and cause fewer photons to reach the detector. At different regions along the electromagnetic spectrum, a reduction in the absorption of light by water, deoxyhemoglobin, and oxyhemoglobin, as well as in photon scattering can occur.3 Near-infrared (NIR) light at wavelengths in the first NIR optical window (from 650 to 950 nm), known as the therapeutic window, is absorbed minimally by water molecules, and by oxygenated and deoxygenated hemoglobin. Thus, it can be used to reach greater penetration depths through tissue than in the visible range, resulting in higher-quality images.4–7 This window is used mainly for phototherapy and can be imaged by silicon based detectors (for wavelengths ). With the arrival of new photo imagers, such as indium gallium arsenide (InGaAs) (for wavelengths up to 1700 nm) and indium antimonide (for wavelengths longer than 1700 nm), novel imaging opportunities can be realized at longer NIR wavelengths. Smith et al. used advanced IR-CCD detectors and enhanced fluorescence from nanotubes, with longer NIR wavelengths from a second NIR window (1000 to 1350 nm), to image small animals in vivo.8 Most recently, Sordillo et al used the IR-CCD InGaAs detector with a halogen lamp light source and showed that there are additional NIR windows suitable for imaging more deeply into tissue.9,10 In this study, optical attenuation measurements from thin tissue slices of normal and malignant breast and prostate tissue, pig brain, and chicken tissue were obtained using the first, second, and third optical windows, in the spectral range from 650 to 2500 nm, and a fourth optical window centered at 2200 nm was also noted.9 Total attenuation lengths () of light through these tissue samples were calculated. It was found that longer attenuation lengths occur with the second and third NIR optical windows than with the conventional first window. Table 1 shows the total attenuation lengths () from chicken tissue at wavelengths of 750, 1200, 1700, and 2200 nm (corresponding to the four NIR optical windows), using a halogen lamp light source and an IR-CCD InGaAs detector.9 Table 1Optical properties lt (μm) from chicken tissue in the four (I, II, III, IV) optical windows.
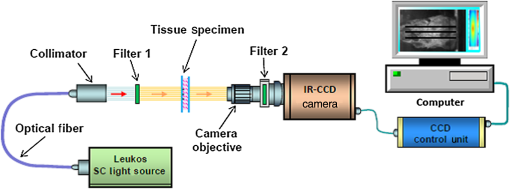
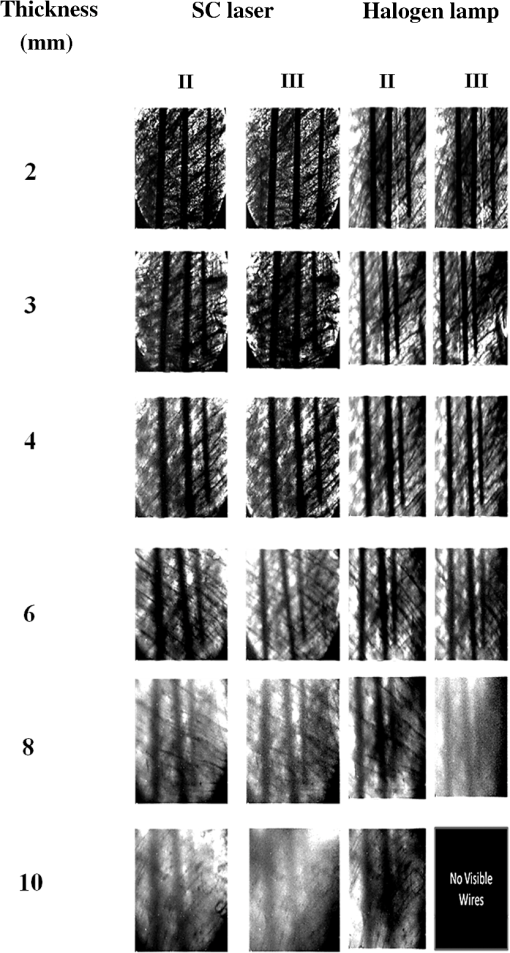
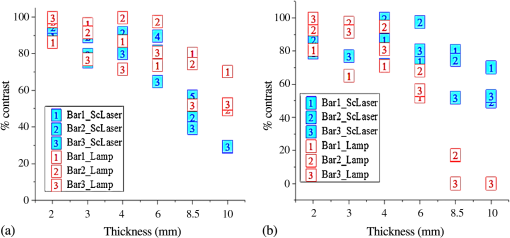
Scattered light in tissue is wavelength dependent due to Rayleigh scattering (which varies as the inverse fourth power of the wavelength dependence) and Mie scattering ( with dependence at longer wavelengths). Due to less scattering and minimal water absorption at longer NIR wavelengths, we concluded that the second and third NIR optical windows could be used to produce high-contrast images and to reach more deeply through layers of tissue. In this study, the supercontinuum (SC) light source with wavelengths in the second and third NIR optical windows (from 1100 to 1350 nm and from 1600 to 1870 nm, respectively) was used with an NIR InGaAs CCD detector to reveal high-quality images with abnormalities (three black wires) hidden beneath thick layers of tissue. Optical images of tissue overlying black wires were also obtained using an InGaAs camera detector and light from a halogen lamp. The Leukos model STM-2000-IR SC laser light source, with optimized NIR emission and a total spectral range of 600 to 2500 nm, delivers of power at the second and third NIR windows and provides a greater number of outgoing photons compared to a conventional lamp light source. Transmission images were obtained using the optical setup shown in Fig. 1. This type of imaging technique (transmission imaging) has been applied to transillumination medical analysis and biological structural diagnosis. Transmission imaging utilizes one path to give information on the depth of penetration and is considered better at assessing depth than reflection imaging. Reflection imaging can also be used to show and locate abnormalities in the tissue. An IR-CCD InGaAs camera (Goodrich Sensors Inc. high-response camera SU320-1.7RT-D, Princeton, New Jersey) with spectral response from 900 to 1700 nm, and 1200 nm bandpass and 1500 nm longpass filters (representing the second and third windows) (Fig. 1) were also used. The detector has a fixed exposure time of 16.3 ms. Filter 2 was placed before the detector in a light blocking chamber to reduce noise and to isolate the desired wavelengths entering the detector. Fig. 1Optical setup for optical imaging of tissue using selective filters 1 and 2 (1200 nm narrow-band and 1500 nm longpass) and wavelengths from the second and third windows from the Leukos supercontinuum (SC) light source.  Chicken tissue was sliced in increments of from to in thickness and placed (away from the detector) behind the three wires of thicknesses 1.56, 1.21, and 0.65 mm. Figure 2 shows the images of chicken tissue and the three wires using the Leukos SC laser and the conventional lamp source and wavelengths in the second (II) and third (III). The images were fitted with an ImageJ processing and analysis program. At a tissue thickness of , images acquired from the Leukos SC laser source with wavelengths in the second and third NIR optical windows show chicken tissue and the three wires. The ImageJ processing program was used to acquire a plot profile of the intensities (signal and background) over some distance along the image. From these results, the degree of contrast was calculated as the intensity of the signal minus the intensity of the background divided by the intensity of the signal plus the intensity of the background times 100. These results are shown in Figs. 3(a) and 3(b). Fig. 2Images of chicken tissue at various thicknesses (from to 10 mm) and three wires from the SC laser and halogen lamp light sources, using wavelengths from the second (II) and third (III) optical windows.  Fig. 3Percent contrast results from images of chicken tissue and the three wires (marked as bars 1, 2, 3) using wavelengths from (a) the second and (b) third optical windows.  Optical attenuation measurements from a 200-micron chicken tissue were also obtained in the spectral range from 400 to 2500 nm. Figure 4 shows the total attenuation length (), which was acquired from the total attenuation coefficient () [defined by the absorption () plus the scattering () coefficients] and calculated using Eq. (1): where OD corresponds to the optical density results from the tissue, is the thickness of the tissue sample, and is derived from the Lambert-Beer’s equation.Fig. 4Spectra of the total attenuation length () from chicken tissue in the I, II, III, and IV optical windows.  Unlike the halogen lamp source, the images of abnormalities acquired using the Leukos SC laser light source are visible at penetration depths of through tissue. As the thickness of the tissue increases, higher percent contrast results are also seen when using the SC laser in the third NIR window compared to the lamp source. The Leukos SC laser with wavelengths in the second and third NIR optical windows can be used to reach greater depths () through tissue and is an ideal light source for imaging through thick tissue. Overall, our ability to visualize structures is limited by the noise level. Signal-to-noise ratio (SNR) is an essential technique that can be used to statistically measure how much noise is present.11 Increasing the exposure time will result in signals that are less corrupted by noise (higher SNR) and will improve image quality. AcknowledgmentsThis research is supported by the Institute for Ultrafast Spectroscopy and Lasers (IUSL) and ARO. ReferencesL. Wang et al.,
“Ballistic 2D imaging through scattering walls using an ultrafast optical Kerr gate,”
Science, 253 767
–771
(1991). http://dx.doi.org/10.1126/science.1653455 SCIEAS 0036-8075 Google Scholar
L. Yang and S. J. Miklavcic,
“Theory of light propagation incorporating scattering and absorption in turbid media,”
Opt. Lett., 30 792
–794
(2005). http://dx.doi.org/10.1364/OL.30.000792 OPLEDP 0146-9592 Google Scholar
J. A. Curcio and C. C. Petty,
“The near infrared spectrum of liquid water,”
J. Opt. Soc. Am., 41 302
–304
(1951). http://dx.doi.org/10.1364/JOSA.41.000302 JOSAAH 0030-3941 Google Scholar
J. V. Frangioni,
“In vivo imaging near-infrared fluorescence imaging,”
Curr. Opin. Chem. Biol., 7 626
–634
(2003). http://dx.doi.org/10.1016/j.cbpa.2003.08.007 COCBF4 1367-5931 Google Scholar
R. R. Anderson and J. A. Parrish,
“The optics of human skin,”
J. Invest. Dermatol., 77 13
–19
(1981). http://dx.doi.org/10.1111/jid.1981.77.issue-1 JIDEAE 0022-202X Google Scholar
B. Ballou, L. A. Ernst and A. S. Waggoner,
“Fluorescence imaging of tumors in vivo,”
Curr. Med. Chem., 12 795
–805
(2005). http://dx.doi.org/10.2174/0929867053507324 CMCHE7 0929-8673 Google Scholar
J. Rao, A. Dragulescu-Andrasi and H. Yao,
“Fluorescence imaging in vivo: recent advances,”
Curr. Opin. Biotechnol., 18 17
–25
(2007). http://dx.doi.org/10.1016/j.copbio.2007.01.003 CUOBE3 0958-1669 Google Scholar
A. M. Smith, M. C. Mancini and S. Nie,
“Bioimaging: second window for in vivo imaging,”
Nat. Nanotechnol., 4 710
–711
(2009). http://dx.doi.org/10.1038/nnano.2009.326 1748-3387 Google Scholar
L. A. Sordillo et al.,
“Deep optical imaging of tissue using the second and third near-infrared spectral windows,”
J. Biomed. Opt., 19
(5), 056004
(2014). http://dx.doi.org/10.1117/1.JBO.19.5.056004 JBOPFO 1083-3668 Google Scholar
L. A. Sordillo et al.,
“Deep tissue imaging of microfracture and non-displaced fracture of bone using the second and third near-infrared therapeutic windows,”
89263V
(2014). http://dx.doi.org/10.1117/12.2046706 Google Scholar
L. V. Wang and H. Wu, Biomedical Optics: Principles and Imaging, Wiley, New Jersey
(2007). Google Scholar
|
||||||||||||

