|
|
1.IntroductionIn digestive endoscopy, it is well known that the emergence of microvessels in the superficial layer of the mucosa is an important aspect of cancerous disease. Clinical studies have shown that the increased density and irregular morphological features of microvessels are associated with tumor progression and that the observation of microvessels is crucial for cancer diagnosis. Thus, spectral endoscopy techniques such as narrow-band imaging (NBI)1 and blue laser imaging (BLI),2 which provide better visibility of microvessels, have been developed and are expected to play a significant role in gastrointestinal cancer diagnosis.3–9 Short-wavelength light sources are utilized in spectral endoscopy techniques. There are two important optical properties that allow us to obtain high-contrast images of superficial microvessels. First, the absorption coefficient () of blood is large at short wavelengths [Fig. 1(a)]. For example, the absorption coefficient of blood at 420 nm is more than six times greater than that at 540 nm. This large absorption of light leads to high vascular contrast even for thin vessels including microvessels. Second, the scattering coefficient of mucosa is large at short wavelengths. Figure 1(b) shows an example of the reduced scattering coefficient for human gastric mucosa.10 The of biological tissue typically increases monotonically as the wavelength becomes shorter, and the gradient tends to be larger in the range of blue light due to the effect of Rayleigh scattering.11 Thus, short-wavelength light does not penetrate into the deep layer of the mucosa by scattering and can detect only the superficial microvessels. Fig. 1Absorption coefficient of blood (a) and reduced scattering coefficient of mucosal tissue (b). The blood was calculated using the molar absorbance coefficient of - and deoxy-hemoglobin, as in Ref. 12, by considering the hemoglobin oxygen saturation (). The mucosal is for human gastric mucosa taken from Ref. 10.  The NBI system, utilizing a xenon lamp and a set of optical filters, provides narrow-band blue illumination (centered at 415 nm and bandwidth of ) for superficial vessel detection and green illumination (centered at 540 nm and with a bandwidth of ) for visualizing deeper vessels.1,13 The spectral characteristics of NBI are determined by the optical filters and cannot be changed during observations. The BLI system employs two lasers (sharply peaked in the ranges of and ) for its narrow-band illumination.2,8 For the BLI system, the spectral characteristics can be changed in principle by controlling the intensity ratio of those two lasers. The emergence of spectral endoscopy systems with multiple light sources has increased the importance of understanding the relationship between the light wavelength and visualization of the microvessels in the mucosa. While the theoretical analysis for evaluating the spectral images has become a critical issue to understand spectral images, the theory and the quantitative analysis methods remain to be established. Gono et al.14,15 in their pioneering work measured a mucosa underside of a human tongue using five narrow-band illuminations and demonstrated that the superficial capillary patterns were markedly improved by exploiting light of around 415 nm. Du Le et al.16,17 in a recent work attempted quantitative comprehension of vascular contrast and light wavelength by Monte Carlo simulations and phantom measurements and indicated some key factors to explain the behavior of vascular contrast by NBI. To make a quantitative evaluation of the appearance of superficial microvessels like those that emerge in the early cancerous tissue in relation to the wavelengths, however, these preceding studies have two problems: (1) in the observation of real human tissue by Gono et al., the actual depths and diameters of the observed vessels remained unclear; and (2) in the phantom experiment by Du Le et al., they did not investigate superficial thin vessels with a depth less than and diameter less than that are especially targeted for cancer diagnosis. Here, we developed experimental techniques for phantom measurements that allowed us to quantitatively evaluate the contrast of vessels with controllable depth and diameter including superficial microvessels as thin as , that were comparable in size with actual vessels that emerge in early cancer. We also performed a swine experiment, where the contrast of each vessel observed by an endoscope at four different wavelengths was investigated with its actual vascular depth, which were obtained by fluorescence labeling of the vessels and observing them with a confocal microscope. The details of these experiments are described and discussed. 2.Simulation Study and Phantom ExperimentTo validate the dependence of blood vessel contrast on the light wavelength, we performed a phantom experiment observing microvessel-simulating phantoms and Monte Carlo simulations. Since we focused on the physical behavior of vascular contrast of superficial thin vessels in the mucosa, in this work we used a simplified tissue model where a single vessel was embedded in a homogeneous medium as described in this section. 2.1.Methods for Phantom Experiment2.1.1.Microvessel-simulating phantomsWe produced microvessel-simulating phantoms by employing the technique for making a capillary pattern based on photolithography by Arai et al.18 This technique enables us to make a capillary within a polydimethylsiloxane (PDMS) resin base. The structure of the phantom is presented in Fig. 2. The depth and diameter of the capillary are controllable in the range of 15 to . We defined the phantom size as for the following two reasons: (1) to compare the simulation results with the measurements of the swine stomach as described in Sec. 3.2, the phantom thickness should be same as that of a swine gastric wall, typically 3 to 5 mm; and (2) the horizontal size of 30 mm is large enough to obtain a vascular contrast value that is unaffected by the finite phantom size. We have experimentally confirmed the validity of the phantom size as described in Sec. 2.1.6. The light scattering property of the PDMS base can be varied by adding titanium dioxide powder of the desirable concentration and particle size. The capillary of each phantom was filled with tartrazine solution. Since we used 445-nm laser light for the illumination for the phantom measurement (described in Sec. 2.1.2), the concentration of the titanium dioxide powder and that of the tartrazine solution was adjusted by considering their scattering and absorption coefficients at 445 nm, so that they simulated the targeted values of mucosal and blood , respectively. Table 1 shows three types of vessels (Types 1 to 3) and their ranges in depths and diameters classified in the analysis of the swine experimental data (described in Sec. 3.1.5). In the swine experiment, spectral images in the wavelength range of 405 to 473 nm were obtained. To permit the comparison of the results of phantom and swine experiments, we measured phantoms of the three vessel types and at the four wavelengths (405, 420, 445, and 473 nm) for each vessel type ( conditions in total). The targeted values of and for each wavelength are the same as those used for the simulation study (Sec. 2.2). Fig. 2Structure of microvessel-simulating phantom. The flow path of the blood-simulating fluid is drawn in gray. The vessel diameter is defined as the side length of the square cross section of the vessels.  Table 1Vessel specifications investigated in the simulation study and the analysis of the swine vessel images. Types 1, 2, and 3 correspond to the superficial microvessels, moderately deep and thick vessels, and deep and thick vessels, respectively.
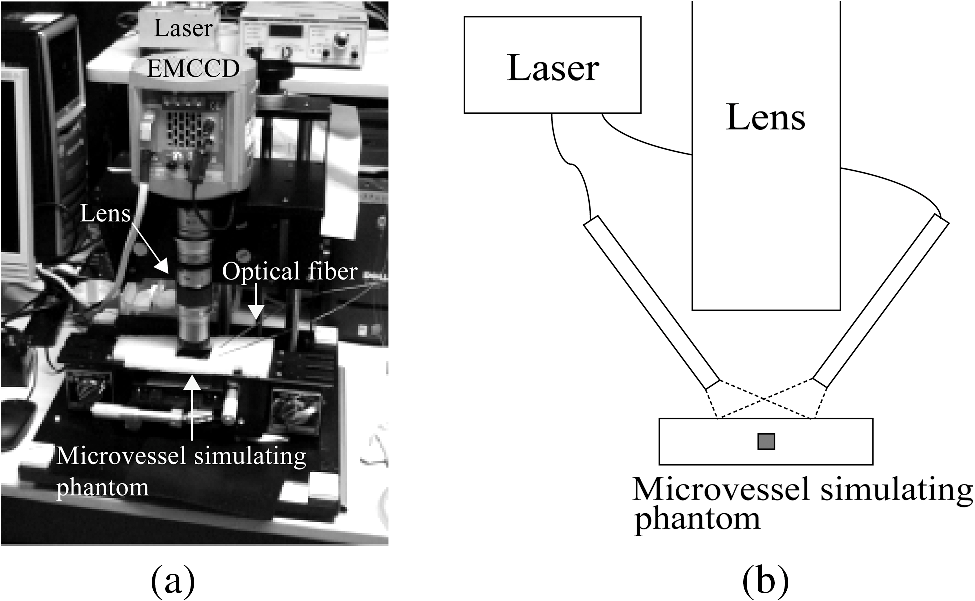
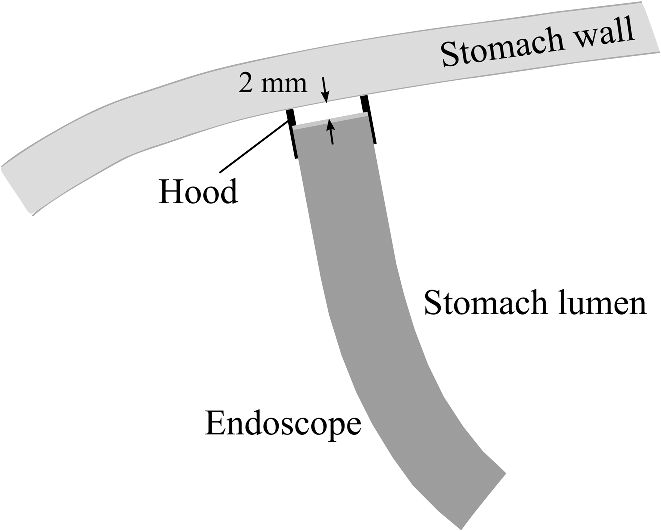
2.1.2.Image acquisitionThe image acquisition system is presented in Fig. 3. The diffused light from the 445-nm laser was irradiated on the phantom with an incident angle of 45 deg. (Here, since the 445-nm laser was exploited merely as a high-power monochromatic light source, the wavelength of 445 nm was not essential for this experiment). The reflected light image was captured with an EMCCD camera (iXon3 888, Andor) with an attached zoom lens (VH-Z100UR, Keyence). We obtained an image resolution of , which was sufficient to resolve even the thinnest capillary of diameter. The image-taking procedure consisted of reinjection of the tartrazine solution into the capillary, refocusing the camera, and image acquisition. To assess the reproducibility and error of the measured vascular contrast, we repeated the procedure for more than 10 times for each phantom. 2.1.3.Vascular contrastWe defined the vascular contrast as , where is the signal level of the vessel area and is that of the surrounding mucosal area. We obtained the contrast value for each acquired phantom image. Since we repeated the image acquisition procedure for plural times as explained above, we calculated the average and standard deviation for all the obtained images. 2.1.4.Determination of optical propertiesThe optical properties of the phantom resin base were determined by the integrating sphere technique (Fig. 4). The total transmittance and diffuse reflectance of the 2-mm-thick resin base were measured using an integrating sphere (RT-060-SF, Labsphere) and a spectrometer (PMA-12, Hamamatsu Photonics). The reduced scattering coefficient was determined by an inverse Monte Carlo technique.10 Here, we assumed a homogeneous, 4-mm-thick tissue model possessing the optical parameters of and and calculated its and using the software package Monte Carlo for multilayered (MCML).19 We performed the calculation for various and and determined the optical parameters that reproduced the measured values with minimal errors. Fig. 4Integrating sphere system to measure the total transmittance (a) and diffuse reflectance (b) spectra. A collimated parallel beam (5 mm in diameter) of a halogen lamp was injected at the phantom resin base attached at the integrating sphere, and the transmitted/reflected light was sent to the spectrometer through an optical fiber. When we measured the reference standard spectra, we detached the sample from the sphere.  2.1.5.Verification of phantom structureTo verify that each phantom was made with its intended structure, we cut the phantom vertically to the vessel after the measurement and acquired an image of the cross section with a confocal microscope (OPTELICS H1200, Lasertec). We obtained the actual depth and diameter of the vessel by converting the size on the cross-sectional image into the real size based on the spatial resolution of the image. 2.1.6.Validity check of phantom sizeAs explained in Sec. 2.1.1, we prepared phantoms of the single size of . To check the validity of this size, we prepared phantoms of different thicknesses and sizes and investigated the thickness/size dependence of the vascular contrast. As for the thickness, we prepared phantoms of Type 2 vessel at 473 nm, whose thickness was varied in the range of 3 to 8 mm. Here, note that the larger the scattering coefficient of the phantom is, the less the phantom reflectance becomes dependent on the thickness. Since the scattering coefficient is the smallest at 473 nm in the range of 405 to 473 nm, the thickness dependence may be observed most easily at this wavelength if it exists. As for the horizontal size, we prepared phantoms of Type 2 vessel at 405 and 473 nm, whose width across the capillary was varied in the range of 8 to 30 mm. 2.2.Methods for Simulation StudyTo investigate the variation in blood vessel contrast depending on the wavelength of illumination, we performed Monte Carlo simulations as follows. We modified the simulation software MCML19 to enable the simulation of light propagation in a tissue that possesses an internal blood vessel. Figure 5 shows the tissue model for this simulation. The structure of the tissue model can be defined by two parameters: , the vessel’s depth from the surface, and its diameter . We modeled three types of vessels, as shown in Table 1. The optical parameters of the tissue can be defined by three parameters: the absorption coefficient , scattering coefficient , and scattering anisotropy parameter . For the inner part of the vessel, we used the of hemoglobin12 for its absorption, where we defined the hemoglobin concentration as and the oxygen saturation as 70%, a typical value for gastrointestinal mucosa.20,21 The scattering coefficient within the vessel was set to zero to accord with the optical properties of the phantom vessels (described in Sec. 2.1.1). For the outer part of the vessel, we set to zero, assuming there was no significant absorption outside of blood vessels, and used reduced scattering coefficient for gastric mucosa, as in Ref. 10. The values of and used in this simulation are presented in Fig. 1. Photons were homogeneously injected into the tissue on an area of with incident angles in the range of 0 deg to 70 deg, and the emitted photons from the tissue surface were counted. The simulation was carried out for wavelengths in the range of 400 to 500 nm in 5-nm steps. We calculated two billion events for one simulating condition (tissue structure, optical parameters, and light wavelength). 2.3.ResultsFigure 6 shows the simulated vessel contrast for each type of vessel and wavelength tested. Here, we focus on the wavelengths of 405, 420, 445, and 473 nm at which spectral images were obtained in the swine experiment (described in Sec. 3.1.3). This result suggests the following properties regarding the image contrast of vessels: (1) the shallow and thin vessel ( deep and thick) presents the highest contrast at 420 nm, but it also presents a high density even at 405 nm, comparable with the case at 420 nm. The detectable optical density is low at 445 and 473 nm; (2) the vessel of moderate depth and diameter ( deep and thick) presents almost the same densities at three wavelengths: 405, 420, and 445 nm; and (3) the deep and thick vessel ( deep and thick) presents a higher density at 445 nm than at 405 nm. Fig. 6Simulated vascular contrast for each type of vessel. The four wavelengths 405, 420, 445, and 473 nm at which we observed in the swine experiment are indicated by solid lines.  Next, we verified the agreement between the simulations and phantom measurements. The measured actual vessel depth and diameter, and the scattering coefficients determined by the integrating sphere and inverse Monte Carlo method, were in agreement with their targeted values within 10% accuracy. Figure 7 shows the reflectance profiles and vessel contrast values obtained from the phantom images compared with the simulated values. All the measurements agreed well with the simulation results. Although there are small differences in the absolute values (within roughly 0.07 optical densities), the simulation results reproduced the wavelength dependence of vascular contrast for each vessel type very well. This accuracy is sufficient to allow discussion of the differences in vessel optical densities at multiple wavelengths as estimated by the simulations. Fig. 7Reflectance profiles (a)–(d) and vascular contrast values (e)–(g) obtained from the phantom images compared with the simulated values. The reflectance profiles show the vascular contrast distribution in the direction vertical to vessels. The contrast values and errors in (e)–(g) are the averages and standard deviations of repeated measurements as described in the text.  Figure 8 shows the results of the validity check of the phantom size. The observed vascular contrast is almost independent of both the thickness and horizontal size in the varied ranges. These results indicate that there is no problem for fixing the phantom size at the single condition of for the present purpose. 3.In Vivo Imaging Study with Swine3.1.Methods3.1.1.Ethics statementPrior to the study, animal protocol was reviewed and approved by the FUJIFILM Animal Experiment Committee and also by the Animal Care and Use Committee of Nihon Bioresearch Inc. 3.1.2.Pig preparationWe used a female miniature pig (weight 45.1 kg and age 19 months) from Nippon Institute for Biological Science. It was anesthetized by inhalation of a mixture of nitrous oxide and oxygen containing 0.5% to 1.5% isoflurane. All the following procedures were carried out under anesthesia. We opened the abdomen to expose the entire stomach. 3.1.3.EndoscopyWe prepared a special endoscope system for experimental use, equipped with laser diodes of 405, 420, 445, and 473 nm for illumination. This system enabled us to obtain and save images at a speed of . The illumination was subsequently switched to each of the four lasers synchronously with the video frames. The stomach mucosa was observed in the following manner. We inserted the endoscope into the stomach through the mouth and observed the gastric mucosa at the boundary of the cardiac and nonglandular area in magnifying mode. When we recorded the images, we kept the endoscope tip approximately 2 mm above the mucosa using the 2-mm-deep hood attached at the tip (Fig. 9). The observed area was marked by making spots using electric cautery. The outer side of the area was also marked by spotting with black ink. 3.1.4.Fluorescent labeling of gastric vesselsTo create a three-dimensional (3-D) image of the blood vessels in the observed area by endoscopy, we fluorescently labeled the gastric blood vessels using tomato lectin [Lycopersicon esculentum agglutinin (LEA)].22–25 LEA can selectively label vascular endothelial cells. To label the swine gastric vessels, we developed a method to administrate LEA to gastric vessels only. The abdomen was opened to expose the whole stomach, and then a cannula was inserted into the left gastric artery for agent injection. The left gastric vein was clamped, and the left and right gastroepiploic arteries, right gastric artery and vein, and short gastric artery and vein were ligated. A cannula for drainage was inserted into the left gastric vein. Next, 12 mg of FITC-labeled LEA (FL-1171, Vector Laboratories) was injected into the left gastric artery. Approximately 5 min later, the left gastric vein was released, and then 500 mL of PBS containing 4% paraformaldehyde was administered through the injection cannula for perfusion fixation of all gastric tissues and also to flush away the residual LEA in the blood. After fixation, the pig was euthanized by exsanguination of the abdominal aorta. The stomach was removed and cut open from the greater curvature, and then the tissue of the observed area was extracted. The excised tissue was immersed in a sucrose solution overnight, and then -thick cryostat sections were prepared. We observed the sections with a confocal laser microscope (LSM 780, Zeiss) at magnification, using an argon laser (488 nm) for FITC excitation. We obtained cross-sectional images at steps of . 3.1.5.Vessel image analysisWe converted the set of sectional microscopic images into a 3-D image. This 3-D image enabled us to obtain the diameter and depth of each vessel on the endoscopic image in the following manner. Figure 10 shows the 3-D fluorescence image of the extracted swine gastric tissue obtained by confocal microscopy. We divided the depth of this image into three levels (Level 1: 0 to , Level 2: 200 to , and Level 3: 400 to 600 ) and integrated the data of each level into a two-dimensional maximum intensity projection (MIP) image. We compared these MIP images and the endoscopic images [Fig. 11(a)], focusing on the vascular pattern, and identified the corresponding vessels to match these two types of images [Fig. 11(b)]. This matching enabled us to obtain the depth and diameter of each vessel that appeared on both images. We then selected three types of vessels whose depths and diameters are in the ranges as presented in Table 1. We calculated the vascular contrast values for these vessels. Fig. 10Three-dimensional (3-D) vascular image of the extracted swine gastric tissue obtained by confocal microscopy: (a) the 3-D vascular image data; (b) the MIP images (projected on the -plane) of all the depth levels; and (c)–(e) the MIP images of the three divided levels. 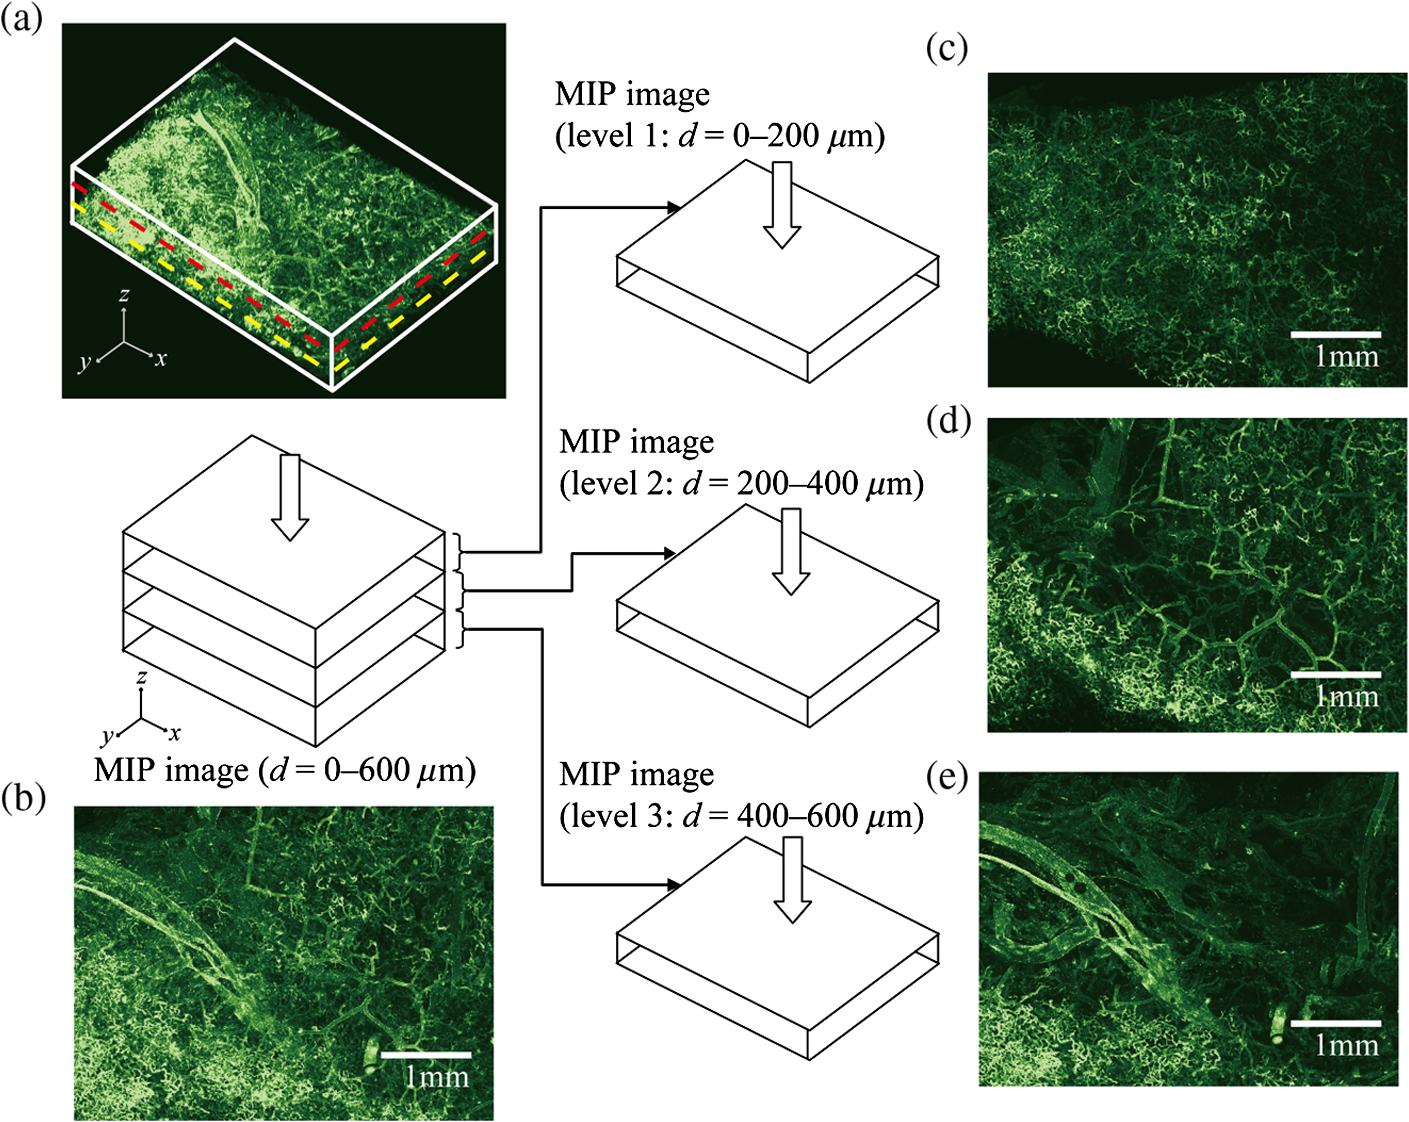 Fig. 11Results of matching microscopic and endoscopic images: (a) the MIP images of levels 1 and 2 (Fig. 10) and the endoscopic images of the BLI and monochromatic 445 nm corresponding to the same area on the observed tissue are juxtaposed; and (b) the corresponding landmark vessels are indicated by colored curves—red: ( and to ) and cyan: ( and to ).  3.2.ResultsWe classified the vessels that appeared in the endoscopic images by their depths and diameters into the three types presented in Table 1 and calculated the mean vascular contrasts for each type. The vascular contrasts were obtained for images at four wavelengths (405, 420, 445, and 473 nm). The results are presented in Fig. 12. The contrast of superficial microvessels is the highest at 420 nm and decreases in the order: 405, 445, and 473 nm. This relation between vascular contrast and wavelength is consistent with the simulation results of Type 1 vessels. The wavelength dependence of the obtained vascular contrast for the other types of vessels also agrees overall with the simulation results. 4.Discussion and ConclusionA simulation study and phantom measurements for common tissue models were performed. The vascular contrasts were matched with high precision for two types of vessel with different optical parameters (Fig. 7). These results validate our simulation method using the current conditions, thus we can discuss the vascular contrast based on the simulation results. As for superficial microvessels, the vascular contrast was the highest at a wavelength of 420 nm. This property agrees with the findings of Du Le et al.16,17 and can be ascribed to the optical properties of blood absorption, which peaks around 420 nm (Fig. 1). In addition to 420 nm, we also investigated vascular contrasts at 405 and 445 nm, wavelengths that were not studied in that publication. It should be noted that a small difference in wavelength around 420 nm leads to prominent differences in vascular contrast–depth relations (Fig. 6). These wavelength-dependent differences in the vascular appearance can also be identified in the endoscopic images (Fig. 13), where the vascular appearance drastically changes as the wavelength changes between 420 and 445 nm. This change can be attributed to the behavior of vascular contrast at 445 nm. Contrast for superficial microvessels at 445 nm is low compared with that at 420 nm, but becomes higher and comparable with 420 nm for deeper and thicker vessels (Fig. 12). This property suggests that changing the spectral information, even in the wavelength range of blue light, will permit one to select the type of vessels to enhance the image for clinical use. In particular, combining two spectral images, such as 405 or 420 and 445 nm, and exploiting the difference in the superficial microvascular contrast of these images may enable enhancement of highly superficial microvessels with a depth less than, e.g., . This could be useful for some clinical applications. For example, Konda et al.26 demonstrated that the superficial vascular density in Barrett’s esophagus increased as the lesion progressed from benign to invasive cancer and that the most superficial (0 to ) vascular density presented a significantly larger increase than those at depths of 0 to . The results presented above are based on monochromatic light at 405, 420, and 445 nm. However, NBI uses blue light at 415 nm with the bandwidth of . To investigate the effect of this band spread, we recalculated the contrast–depth relation of microvessels ( and ) for each wavelength by convolution of the simulated reflectance spectrum and the Gaussian functions with and 20 nm [Fig. 14(a)]. We also investigated in the case of a triangular filter function as shown in Fig. 14(b) to simulate the diminishing power as the wavelength approaches 400 nm due to the common spectral property of a xenon lamp used for endoscopy (Fig. 15). The results are presented in Fig. 16. The vascular contrast rapidly decreases as the bandwidth broadens, especially in the case of 420 nm. It becomes even smaller in the case of the triangular filter function due to the increased contribution of light at 440 to 450 nm. These results indicate that it is important to consider not only the peak wavelength, but also the bandwidth and its shape to obtain the desired vascular contrast. Fig. 14Optical band-pass filter functions used for the simulation of band broadening: (a) Gaussian filters with and 20 nm. We calculated at , 420, and 445 nm; and (b) triangular filter simulating the typical xenon lamp spectrum (Fig. 15) with limiting the wavelength range to less than 450 nm. 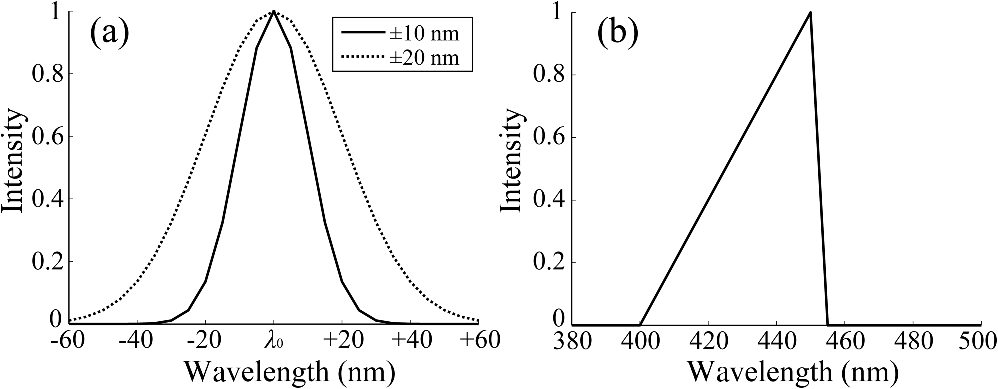 Fig. 15Typical spectrum of a xenon lamp as a white light source used for endoscopy (in-house data by FUJIFILM). The light intensity rapidly decreases as the wavelength approaches 400 nm.  Our microvessel-simulating phantom has a noteworthy feature—it can simulate superficial microvessels almost in full scale with controllable vascular depth and diameter and can also simulate the optical properties of actual tissue by controlling the concentration of light-scattering matter and absorptive pigments. Thus, this technique may enable optical evaluation of superficial microvessels that is clinically important for diagnosis and may be useful for future development of new spectral endoscopy techniques. In the swine experiment, we developed a method of local perfusion fixation that allowed fluorescence labeling of blood vessels which were limited to the stomach. 3-D imaging of blood vessels was established for mice in earlier work.24 In the present study, we demonstrated that it is also possible to apply this method to swine gastric mucosa to obtain 3-D mucosal vascular images. This technique may be useful for evaluating the depth and diameter of endoscopically observed mucosal vessels and developing new spectral endoscopy functions. Moreover, this technique is advantageous in that 3-D vascular structure containing microvessels can be easily obtained, compared with the conventional immunohistological method. The histological method requires preparation of many sections in small steps, and it is not easy to reproduce the 3-D microvascular structure from the sectional images. Our method for the evaluation of vascular contrast may improve the theoretical and quantitative understanding of the difference in various kinds of spectral endoscopic images, where the appearance of superficial microvessels is enhanced. Additionally, our study indicated that changing the spectral property even in the wavelength range of blue light may allow selective enhancement of the vascular depth for clinical use. To obtain high contrast of superficial microvessels, exploiting the large contribution of light in the range of 400 to 420 nm is essential and using longer wavelengths will enable enhancement of deeper and thicker vessels. Vessels in the tumorous tissue vary in their depths depending on the tumor type and its stage of progression. Thus, it is expected that the spectral imaging techniques for vascular enhancement will develop to the next stage where the spectral property of the illumination can be optimally changed in the target-lesion oriented manner. AcknowledgmentsWe would like to express our appreciation to the members of Imaging Technology Center, Medical System Research & Development Center, and Safety Evaluation Center of FUJIFILM Corporation for their help for the phantom and swine experiments. ReferencesP. Lukes et al.,
“Narrow band imaging (NBI)––endoscopic method for detection of head and neck cancer,”
Endoscopy, 75
–87 InTech, Croatia
(2013). http://dx.doi.org/10.5772/52738 Google Scholar
Y. Morimoto et al.,
“Development of a new generation endoscope system with lasers ‘LASEREO’,”
FUJIFILM Res. Dev., 58 1
–6
(2013). Google Scholar
V. Subramanian and K. Ragunath,
“Advanced endoscopic imaging: a review of commercially available technologies,”
Clin. Gastroenterol. Hepatol., 12
(3), 368
–376
(2014). http://dx.doi.org/10.1016/j.cgh.2013.06.015 CGHLAW 1542-3565 Google Scholar
M. Song and T. L. Ang,
“Early detection of early gastric cancer using image-enhanced endoscopy: current trends,”
Gastrointest. Intervention, 3
(1), 1
–7
(2014). http://dx.doi.org/10.1016/j.gii.2014.02.005 2213-1795 Google Scholar
O. Kikuchi et al.,
“Narrow-band imaging for the head and neck region and the upper gastrointestinal tract,”
Jpn. J. Clin. Oncol., 43
(5), 458
–465
(2013). http://dx.doi.org/10.1093/jjco/hyt042 JJCOAC 0368-2811 Google Scholar
M. Fujiya and Y. Kohgo,
“Image-enhanced endoscopy for the diagnosis of colon neoplasms,”
Gastrointest. Endosc., 77
(1), 111
–118
(2013). http://dx.doi.org/10.1016/j.gie.2012.07.031 GAENBQ 0016-5107 Google Scholar
H. Osawa and H. Yamamoto,
“Present and future status of flexible spectral imaging color enhancement and blue laser imaging technology,”
Dig. Endosc., 26
(1), 105
–115
(2014). http://dx.doi.org/10.1111/den.12205 Google Scholar
N. Yoshida et al.,
“The ability of a novel blue laser imaging system for the diagnosis of invasion depth of colorectal neoplasms,”
J. Gastroenterol., 49 73
–80
(2014). http://dx.doi.org/10.1007/s00535-013-0772-7 JOGAET 0944-1174 Google Scholar
N. Yoshida et al.,
“Ability of a novel blue laser imaging system for the diagnosis of colorectal polyps,”
Dig. Endosc., 26
(2), 250
–258
(2014). http://dx.doi.org/10.1111/den.2014.26.issue-2 0915-5635 Google Scholar
A. N. Bashkatov et al.,
“Optical properties of human stomach mucosa in the spectral range from 400 to 2000 nm: prognosis for gastroenterology,”
Med. Laser Appl., 22
(2), 95
–104
(2007). http://dx.doi.org/10.1016/j.mla.2007.07.003 1615-1615 Google Scholar
S. L. Jacques,
“Optical properties of biological tissues: a review,”
Phys. Med. Biol., 58 R37
–R61
(2013). http://dx.doi.org/10.1088/0031-9155/58/11/R37 PHMBA7 0031-9155 Google Scholar
S. Prahl,
“Optical absorption of hemoglobin,”
(2014) http://omlc.org/spectra/hemoglobin/ ( September ). 2014). Google Scholar
K. Nonaka, M. Nishimura and H. Kita,
“Role of narrow band imaging in endoscopic submucosal dissection,”
World J. Gastrointest. Endosc., 4
(9), 387
–397
(2012). http://dx.doi.org/10.4253/wjge.v4.i9.387 GAENBQ 0016-5107 Google Scholar
K. Gono et al.,
“Appearance of enhanced tissue features in narrow-band endoscopic imaging,”
J. Biomed. Opt., 9
(3), 568
–577
(2004). http://dx.doi.org/10.1117/1.1695563 JBOPFO 1083-3668 Google Scholar
K. Gono et al.,
“Endoscopic observation of tissue by narrow band illumination,”
Opt. Rev., 10
(4), 211
–215
(2003). http://dx.doi.org/10.1007/s10043-003-0211-8 1340-6000 Google Scholar
V. N. Du Le et al.,
“Vascular contrast in narrow-band and white light imaging,”
Appl. Opt., 53
(18), 4061
–4071
(2014). http://dx.doi.org/10.1364/AO.53.004061 APOPAI 0003-6935 Google Scholar
V. N. Du Le et al.,
“Monte Carlo modeling of light-tissue interactions in narrow band imaging,”
J. Biomed. Opt., 18
(1), 010504
(2013). http://dx.doi.org/10.1117/1.JBO.18.1.010504 JBOPFO 1083-3668 Google Scholar
S. Tanaka et al.,
“Quantitative assessment of manual and robotic microcannulation for eye surgery using new eye model,”
Int. J. Med. Rob. Comput. Assisted Surg.,
(2014). http://dx.doi.org/10.1002/rcs.1586 Google Scholar
L. Wang, S. L. Jacquesa and L. Zheng,
“MCML–Monte Carlo modeling of light transport in multi-layered tissues,”
Comput. Methods Program Biomed., 47
(2), 131
–146
(1995). http://dx.doi.org/10.1016/0169-2607(95)01640-F CMPBEK 0169-2607 Google Scholar
D. Van Noord et al.,
“Endoscopic visible light spectroscopy: a new, minimally invasive technique to diagnose chronic GI ischemia,”
Gastrointest. Endosc., 73
(2), 291
–298
(2011). http://dx.doi.org/10.1016/j.gie.2010.10.025 GAENBQ 0016-5107 Google Scholar
S. Friedland et al.,
“Measurement of mucosal capillary hemoglobin oxygen saturation in the colon by reflectance spectrophotometry,”
Gastrointest. Endosc., 57
(4), 492
–497
(2003). http://dx.doi.org/10.1067/mge.2003.162 GAENBQ 0016-5107 Google Scholar
S. Morikawa and T. Ezaki,
“Phenotypic changes and possible angiogenic roles of pericytes during wound healing in the mouse skin,”
Histol. Histopathol., 26
(8), 979
–995
(2011). HIHIES 0213-3911 Google Scholar
W. K. You et al.,
“Ricinus communis agglutinin I leads to rapid down-regulation of VEGFR-2 and endothelial cell apoptosis in tumor blood vessels,”
Am. J. Pathol., 176
(4), 1927
–1940
(2010). http://dx.doi.org/10.2353/ajpath.2010.090561 AJPAA4 0002-9440 Google Scholar
S. Mazzetti et al.,
“Lycopersicon esculentum lectin: an effective and versatile endothelial marker of normal and tumoral blood vessels in the central nervous system,”
Eur. J. Histochem., 48
(4), 423
–428
(2004). http://dx.doi.org/10.4081/916 EJHIE2 0391-7258 Google Scholar
S. Morikawa et al.,
“Abnormalities in pericytes on blood vessels and endothelial sprouts in tumors,”
Am. J. Pathol., 160
(3), 985
–1000
(2002). http://dx.doi.org/10.1016/S0002-9440(10)64920-6 AJPAA4 0002-9440 Google Scholar
V. J. A. Konda et al.,
“Evaluation of microvascular density in Barrett’s associated neoplasia,”
Mod. Pathol., 26 125
–130
(2013). http://dx.doi.org/10.1038/modpathol.2012.146 MODPEO 0893-3952 Google Scholar
|