
|
|
1.IntroductionRadiotherapy is one of the most common methods for the treatment of cancer. It is able to destroy the cancer cells using ionizing radiation (photons, electrons, protons, and heavier particles, such as carbon ions). Its use requires a continuous investigation about the interactions of radiation with cells and tissues to shed light on outstanding radiobiological issues, such as the variation in patient radiosensitivity, the inability to monitor patient’s radioresponse during the course of an extended treatment, and the failure of current models to predict cell survival or tumor control at single high doses. In recent years, optical methods have gained attention in medicine and biology because of their potentialities. Among these methods, Raman spectroscopy1 has shown to be a very promising tool for specific molecular fingerprinting in medical and biological applications. Its success has been strongly boosted by the possibility to couple Raman spectrometers with microscopes2 and to use nano-objects for enhancing the signal or targeting parts of complex systems.3,4 In particular, micro-Raman spectroscopy is a promising technique in the field of radiobiology and radiation oncology for its ability to assess the cellular damage at the molecular level.5–9 Raman spectroscopy technique may be used to monitor the minimum doses required to lethally damage tumor cells, reducing the risk of excess dose being delivered to healthy surrounding cells. The recent development of specific data analysis methods enabling the extraction of information embedded in the Raman spectra of complex samples, such as human tissues, fluids, and humors,10,11 has contributed to enhance the potentials of Raman spectroscopy. Among the others, the principal component analysis (PCA) method has proven to be particularly suitable for analyzing Raman spectra from cells and tissues. The PCA method performs a mathematical decomposition of the spectral data, which reduces the data dimensions to a smaller number of scores and principal components (PCs) or loadings that effectively carry most of the important information of the spectra.12 Classification of spectral data can be easily done by choosing different combinations of PCs to build a new coordinate system. PCA is widely used in Raman spectroscopy studies for pathological classification, such as to discriminate between Barrett’s and normal epithelium,13 to differentiate adenomatous from hyperplastic polyps of the colon,14 and to classify T and B lymphocytes of normal and leukemic patients.15 In a cell death study, Yao et al. have demonstrated the ability of the PCA method used for Raman spectra analysis to distinguish between live and apoptotic human gastric cancer cells.16 Ong et al. have used the PCA method for discriminating apoptosis and necrosis in K562 leukemia cells.17 Recently, the PCA analysis has been performed on selected wavenumber ranges of Raman spectra in order to get information embedded in those specific ranges. This method, which is gaining popularity for biomedical applications of Raman spectroscopy, is known as the interval-PCA (iPCA) method.18,19 In the present paper, biochemical and structural changes in the cell biological molecules due to exposition of cells to graded doses of x-ray have been investigated by confocal micro-Raman spectroscopy. In particular, Raman investigation on single normal mammary epithelial M-10 cells fixed6,20,21 immediately after irradiation (t0-cells) and fixed 24 h after irradiation (t24h-cells) has been carried out in order to study both the effects of the irradiation and the efficacy of the recovery process of the cells. The analysis of Raman spectra by simple regression analysis and by the PCA method on the whole spectra and on selected ranges of the spectra (iPCA) has allowed us to outline the subtle variations in the Raman fingerprints of proteins, lipids, and nucleic acids due to x-ray radiation expositions. Particular attention has been paid to the comparison of results from t0-cells and t24h-cells, also with the aid of the dose dependence of PCA and iPCA components. Interestingly, the employed experimental conditions (laser wavelength and power), together with a data collection geometry are compatible with an in vivo study, which would further contribute to clarify interaction processes between cells and ionizing radiation. 2.Materials and Methods2.1.Samples Preparation and TreatmentsHuman mammary epithelial cells from H184B5F5-1 M/10 line22 were grown on polylysine-coated glass coverslips () in -MEM medium at 37°C, 5% . Polylysine improves the adhesion of cells on the glass coverslips. The concentration of cells was such that the cells were not confluent but intercellular spaces were left for measuring the background signal (see Fig. 1). A STABILIPLAN machine (Siemens, Munich, Germany) was used for x-ray irradiation. X-rays (250 kVp) were produced by a Thomson tube (TR 300F) and filtered by 1-mm-thick Cu foil. Cellular samples derived from one single batch, in order to avoid interbatch variation, were exposed to various doses of x-rays at a dose rate of . In particular, cells exposed to 2.5 Gy (exposure time: 2 min 40 s), 5 Gy (exposure time: 5 min 20 s), 7.5 Gy (exposure time: 8 min), and 10 Gy (exposure time: 10 min 30 s) were investigated together with nonexposed cells (0 Gy). These dose values are in the range of ionizing radiation doses involved in the treatment of breast cancer.23 In fact, cancer treatment by ionizing radiation typically occurs by administering daily fractions of doses on the order of 2 Gy. The overall treatment may last several weeks with the total dose necessary for local tumor control ranging between 50 and 60 Gy. In addition, these doses are those typically used to construct a clonogenic dose-response curve.24 After the exposure, a set of cells was immediately fixed in paraformaldehyde 3.7%. Another set (maintained in α-MEM medium at 37°C, 5% ) was allowed to recover for 24 h after the end of the exposure process and was then fixed in paraformaldehyde 3.7%. The fixation procedure is important to store the cells before, during, and after the measurement and to significantly reduce the damage induced by the laser photo-linked to the photochemical processes of oxidation. Since 2004, several investigations have been performed to study the fixation effects on the Raman spectra of cells,20,21 all agreeing on the importance of choosing the appropriate fixative to avoid artifacts in the spectra. In particular, Meade et al. have recently shown that a fixation procedure with a low concentration of paraformaldehyde (3.7%) provides the best results.21 Accordingly, all the measurements were performed on cells fixed by using this concentration of paraformaldehyde and then kept in phosphate buffered saline (PBS) until Raman measurements were performed. 2.2.Micro-Raman SpectroscopyRaman spectra were recorded at room temperature by means of a micro-Raman spectrometer (LabRam, Jobin-Yvon Horiba), by using a He-Ne laser operating at . The laser beam was focused on samples by an Olympus optical microscope with a oil immersion objective (with numerical aperture, ). The light spot had a diameter of , consistent with the calculated value of Airy disc diameter, and small enough to allow the investigation of a single cell.25 A laser power of 2 mW was measured at the sample. The glass coverslip with the cells was placed on a microscopy slide provided with a well filled with PBS solution. The laser beam crossing the glass coverslip probed the fixed single cells (see Fig. 2). The used glass is almost transparent to the visible region of light, and the excitation light could reach the sample with a minimum intensity loss. In order to limit the contribution of the glass substrate to the Raman signal, the excitation laser beam was carefully focused inside the sample. The residual signal from the glass was almost smooth in the region of interest and was removed by a suitable numerical data treatment described below in Sec. 2.3. Fig. 2Schematic representation of the setup used for the acquisition of Raman signal from M10 fixed cells adherent to the glass coverslip.  It is worth noting that the laser power level and the collection data geometry adopted here are also suited to be applied for studying in vivo cell samples without any further manipulation. The acquisition time was fixed at 30 s for each spectrum acquisition and the signal was averaged after four acquisitions. The background signal (from the glass coverslip and PBS solution) was recorded for each coverslip from a region where no cells were present. Scattered light was collected in backscattering geometry and a notch filter was used to suppress the elastic component of the scattered radiation. The collected light beam was dispersed into a spectrometer equipped with a grating. The spectral resolution was in the investigated spectral range (500 to ). A cooled charge coupled device (CCD) system detected the Raman spectrum, and a separate CCD camera collected white light microscope images of the cells being probed. For each coverslip sample, different points were randomly selected and investigated, for a total of spectra for each dose. For the set of cells fixed immediately after irradiation (t0-cells), a total of 108 spectra was recorded and analyzed. For the set of cells fixed 24 h after irradiation (t24h-cells), 98 spectra were recorded and analyzed. 2.3.Data Analysis2.3.1.Preliminary analysisThe whole data set was preliminarily processed to remove the fluorescence background and excess noise by a numerical procedure based on wavelet algorithms.26,27 Basically, the Raman signal was represented in terms of the sum of elementary functions (wavelets) at different frequency scales in a hierarchical representation known as discrete wavelet transform (DWT). Starting from the decomposed parts, the signal can be reconstructed by an inverted process (IDWT). If the last approximation component is not included in the IDWT process, the smoother part of the signal is removed. In the case of a Raman spectrum, this smooth signal component is mainly caused by light diffusion and fluorescent processes. Similarly, by removing the fast frequency components, it is possible to eliminate noncorrelated noise signals. In our case, bi-orthogonal wavelets based on the B-spline function were employed for an eight-level decomposition of the signal. The signal was recalculated from detail components up to the sixth level. In order to discriminate the Raman signal of cells from the background signal due both to PBS and, minimally, to the glass substrate, spectra from cells in PBS solution were compared to spectra from bare PBS by using a linear regression procedure. Finally, the PBS+glass signal was subtracted from the cell+PBS+glass spectra and scaled by the slope coefficient determined by the linear regression. The cell complex spectra obtained by the above-described procedure were analyzed in terms of convoluted Lorentzian shaped vibrational modes. A best-fit procedure was used in order to determine optimized intensity, position, and line-width of Lorentzian peaks, starting from an initial manually set configuration. The fitting performance was evaluated by means of the parameter. All spectral processing steps were performed with MATLAB® (Version 7.6, MathWorks, Natick, Massachusetts) software package by employing purposely written programs using MATLAB® Wavelet Toolbox. 2.3.2.Linear regression analysisAfter the wavelet procedure, we adopted a univariate analysis27,28 to emphasize the similarities between spectra obtained from cells in the same experimental conditions and to highlight the differences between spectra relative to cells exposed to different doses of irradiation. In particular, for each wavenumber point, the intensity of the spectrum ( variable) was compared to the corresponding value of another spectrum variable ( variable) referring to a different sample, by performing a linear regression or univariate analysis of data. The basic assumption is that the spectrum Y (containing the data ) is a linear function of another spectrum X (containing the data ), that is . If no structural change occurs in the sample, the perturbation terms depend only on the experimental conditions and follow a Gaussian distribution, with mean 0. Regression analysis allows us to determine the parameters and . To evaluate the similarity between data sets, we calculated the sample coefficient of determination , defined as where is the average value of vector Y. ranges from 0 for uncorrelated data to 1 for perfect linear dependence. The linear regression was evaluated on a number of points ranging between 500 and 700, implying a high level of significance of the procedure.282.3.3.Principal component analysis and interval-PCAAfter these preliminary steps, the fully processed data set was then analyzed by PCA and iPCA algorithms16,17,29,30 in order to reduce the dimension of the data while accounting for most of the variance in the original data. PCA-based analysis was performed by analyzing the covariance matrix after subtracting the mean of the variables. The number of components to be considered was defined as the number of components required to explain at least 80% of the total variance. All procedures of multivariate analysis were performed on the complete data set. PCA analysis was performed first on the full spectral window (500 to ); then the spectral window was divided into 20 intervals and the PCA was performed on each interval (i-PCA). The intervals were properly chosen to separately give access to features assigned to DNA/RNA, lipids, and proteins. In particular, the i-PCA results of four intervals were considered for the analysis: the 2910 to interval, mainly including lipids-related features, the 1590 to interval, where features due to amide I can be observed, the 930 to spectral range, mainly including DNA/RNA-related features, and the 1250 to interval, where the fingerprints of protein, lipids, and DNA/RNA are all observed. Due to the complexity of human cell samples, it is necessary to take into account that in some spectral regions, contributions from proteins, lipids, and nucleic acids can overlap due to the experimental spectral resolution.31,32 Comparison among means of PCA scores obtained for spectra grouped by radiation dose was performed by one-way analysis of variance, with a significance level of 5%. In the case in which the test casts doubt on the null hypothesis (probability ), the Tukey-Kramer test with a significance level of 5% was carried out to make a pairwise comparison in order to extract which groups have means significantly different from the others. All spectral processing steps were performed with MATLAB® (version 7.6) software package by employing properly written programs using MATLAB® Statistical Toolboxes and i-PCA toolboxes.29 3.Results and Discussion3.1.Features of Raman spectra from control cellsThe Raman spectrum obtained by averaging all the spectra from control cells (0-Gy cells) is shown in Fig. 3 together with the results of the deconvolution procedure of the whole spectrum. The iterative fitting algorithm converged for a reduced value to a convolution of Lorentzian peaks whose positions are labeled. A great number of peaks are observed, as expected, since the Raman spectrum of a cell is known to contain contributions from proteins, lipids, and nucleic acids. In particular, spectral features due to proteins arise from ring vibrational modes of aromatic amino acids, amide groups of secondary protein structures, and stretching or deformation of carbon atoms bonded with nitrogen, hydrogen, or other carbon atoms. Nucleic acid features include contributions from vibrational modes due to RNA and DNA bases, as well as from the sugar-phosphate backbone of DNA. A number of different stretching and deformation modes of lipid functional groups are responsible for features that are also detectable throughout the spectral window. However, it is well known1,16,30 that the region from 1800 to does not give any useful information on cells and thus will be neglected in any further analysis. Details about the tentative assignment of peaks, which are in agreement with Refs. 7, 16, 17, 31, and 32, are reported in Table 1, also considering the well-known overlap of some features. In particular, the deconvolution procedure indicates contributions located at (phenylanine), (adenine), (tryptophan), (tyrosine and backbone O-P-O), (phenylalanine), (C-H bending phenylalanine), (C-N stretching of proteins, C-C stretching of lipids, and O═P═O stretching of DNA/RNA), (C-N and C-C stretching of proteins and lipids, respectively), (various configurations of amide III), (amide III, adenine, and twisting of lipids), (adenine, guanine, C-H deformations of proteins, and twisting of lipids), ( bending of proteins and scissoring of lipids), (adenine and guanine), (various configurations of amide I), (C═O contribution stretching of lipids), (related to symmetric stretching of proteins and lipids), and at (C-H stretching of proteins and lipids). Fig. 3Deconvolution analysis of the averaged Raman spectrum of control cells. The average Raman signal is fitted to the sum of convoluted Lorentzian bands, each one shown with a thin line. The spectral position of each Lorentzian band is also reported. The attributions of the Raman peaks are reported in Table 1. 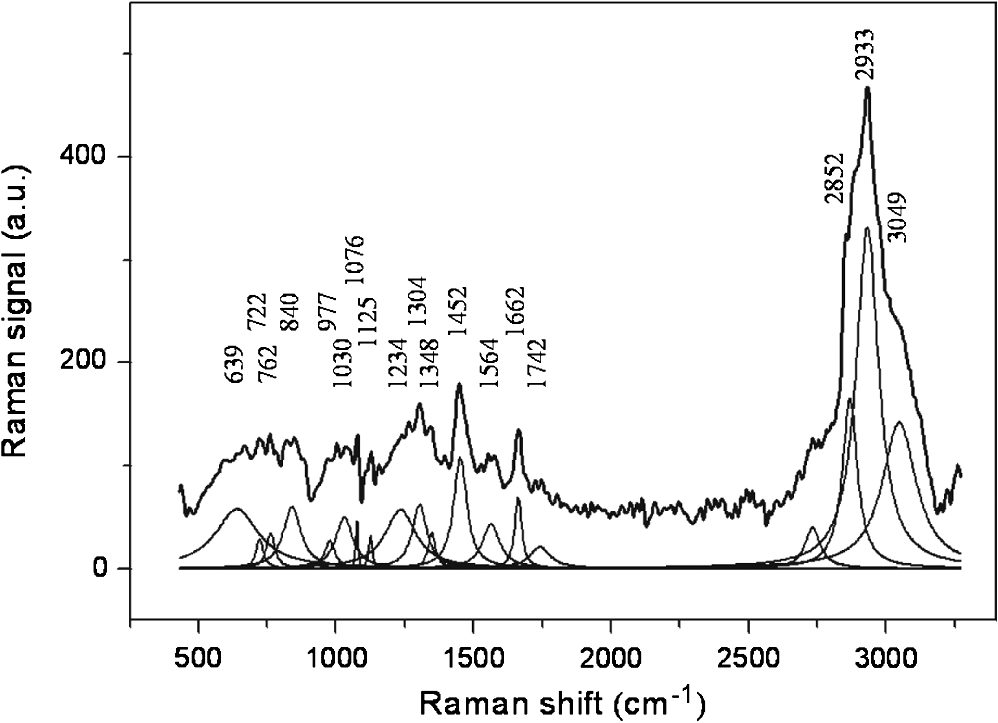 Table 1Main peaks observed in Raman spectra of fixed cells and corresponding assignments according to Refs. 7, 16, 17, 31, and 32. In some cases, a wavenumber range is given for the various contributions in order to take into account results from principal component analysis (PCA) and interval-PCA (i-PCA) analysis. Abbreviations: p, proteins; d, DNA/RNA; l, lipids.
The spectra obtained by averaging all the wavelet-treated spectra acquired from t0-cells exposed at an identical dose of x-ray radiation feature similar characteristics for each of the five investigated doses. They show features similar to those discussed above for unirradiated control cells, and only subtle differences occur among spectra from cells irradiated with different doses. This also occurs for spectra recorded from t24h-cells. For this reason, univariate approach can assist in further analysis of our results. 3.2.Univariate Analysis ResultsWhen spectral modifications are relatively weak and they are not characterized by the appearance of new peaks, a global analysis of the spectrum can provide some advantages in the evaluation of spectral changes.28,33 The parameter has been calculated for evaluating the correlation between spectra from cell samples that underwent the same treatment (cells fixed at the same time after irradiation and exposed to the same x-ray dose). Its value ranges between 0.99 and 0.97, thus suggesting a high overall correlation. Conversely, the values obtained from the comparison of spectra from samples that have undergone different treatments (different time of fixation, different x-ray dose) are significantly lower, ranging from 0.75 to 0.80. These values suggest a low overall correlation as a result of subtle differences between the considered spectra. 3.3.Multivariate Analysis of Raman Spectra from Cells Fixed Immediately After Irradiation (t0-Cells)PCA and i-PCA analysis on the complete data set of spectra recorded from t0-cells (108 spectra) have been performed to acquire information on the differences among control and irradiated cells. In particular, the first step of the analysis has been carried out for the whole spectral window (500 to ) in order to describe the variability of the data set. For all cases, a number of components enabling us to describe at least 80% of the total variance have been considered. The first PCA (PC1) component (eigenvector) obtained on the complete data set of full spectra [shown in Fig. 4(a)] describes the most significant source of spectral variability, which in this case is 42% of the total variance in the data set. Many of the positive and negative features observed in the PC1 eigenvector can be assigned by comparison with the described spectrum of the cell before irradiation (Fig. 3) and by using Table 1. The features that are observed for the first time in Fig. 4 can be assigned using Table 1. They are reported in Table 2. In particular [see Fig. 4(a)], the positive features located at 669, 731, and can be assigned to DNA/RNA bases (adenine, guanine, and thymine), the ones at 762 and exclusively to proteins, and that at to proteins and lipids. Regarding the negative features of PC1, two observed peaks are exclusively due to proteins (at 1442 and ), one due to lipids (at ), and two (at 2889 and ) due to proteins and lipids. Fig. 4Results of the principal component analysis (PCA) for the full spectral window for spectra from cells fixed immediately after x-ray exposure (t0-cells); 87% of the total variance is explained by using the first three PCA components: (a) first PCA component (42% of total variance) with labels of assigned features (see text and Table 1), (b) PCA scores for the first PCA component (spectrum number versus PC1 scores); different markers categorize all 108 spectra by irradiation dose, (c) second PCA component (35% of total variance) with labels of assigned features, (d) spectrum number versus PC2 scores, (e) third PCA component (10% of total variance) with labels of assigned features, (f) spectrum number versus PC3 scores.  Table 2Summary of PCA and iPCA results from t=0 fixed cells. The spectral positions of all the features outlined by multivariate analysis are listed; negative features are marked using bold characters. In “Dose dep.” line, the dependence of PCA and i-PCA scores on x-ray dose is reported. Abbreviations: prt, partial; exp var., explained variability.
Any spectrum with a higher (i.e., more positive) PCA score for a given PCA component will have a proportionately higher amount of the positive features and lower amount of the negative features from that component. Therefore, the PCA scores can identify changes in the relative biomolecule composition between samples, where the molecular groups responsible for the spectral changes are identified by the features of the corresponding component. For PC1, positive scores are correlated with increased contribution to the variability from nucleic acid, while negative scores are correlated with increased contribution from lipids and proteins. The PCA scores for the 108 spectra, grouped by the irradiated dose, are shown in Fig. 4(b). The statistical analysis of the scores shows that PC1 is not able to discriminate between irradiated and control cells. This suggests that the variability expressed by the first PCA component is mainly due to intrinsic variability within and among cells and spectra. This result is in agreement with findings reported in previous studies about applications of PCA on Raman spectra from single cells.7–9 The eigenvector of PC2 is shown in Fig. 4(c). It describes the second most significant source of spectral variability in the data set, which is 35% of total variance and should not include the existing inherent variability between spectra that we suppose to be described by the first component. Many of the positive and negative features in the components have been previously discussed. In Table 2, all the resolved spectral features of PC2 component are reported with their assignments according to Table 1. The positive features are due to DNA/RNA, lipids, and proteins, while negative features do not include contributions coming from DNA/RNA. In particular, the features located in the 1610 to range (three sharp peaks at 1618, 1652, and ) can be read as an amide I–related negative feature. Interestingly, some features appear both in PC1 and PC2. Since the inherent variability within and among cells is supposed to be described by PC1, we suppose that a specific variability, probably due to irradiation, is described by PC2. This hypothesis is confirmed by the plot of PC2 scores shown in Fig. 4(d) for all the 108 spectra. The score values have a lower variability within each group of spectra (data are grouped according to the radiation dose) with respect to the variability observed for PC1 scores. Control cell spectra have negative score values (), suggesting a high contribution from negative features (coming from proteins and lipids with a significant contribution from proteins amide I–related features) before irradiation. The PC2 scores increase abruptly to a high positive value () for 2.5-Gy irradiated cells and decrease with increasing dose: they are for a 5-Gy dose and become negative for higher doses ( and for 10- and 7.5-Gy doses, respectively). Statistical analysis of the PC2 scores shows a clear separation among all the groups. This indicates that the changes in Raman spectra described by PC2 are correlated with the dose, thus suggesting that the radiation-induced spectral variability explains a high percentage of the total variance. In fact, the percentage of the total variance explained by PC2 is only slightly lower than the inherent spectral variability explained by PC1 (35% for radiation versus 42% for inherent variability). Since the first two components account for 77% of the total variance, the third component has to be considered in order to explain at least 80% of the total variance (the first three components explain 87% of the total variance). In fact, the PC3 component [shown in Fig. 4(e)] describes 10% of the total variance. Besides the discussed features due to an overlapping of contributions from proteins and lipids (negative features at 2848 and and at ), and DNA/RNA (positive feature at ), there are some negative features not yet discussed. They can be assigned with the aid of Table 1 exclusively to protein tyrosine (), and to proteins and DNA/RNA (feature at ). The third PC scores [Fig. 4(f)] display a variation within a single group higher than that observed for PC2 scores. Statistical analysis shows that they enable us to distinguish all the spectra from 5- and 7.5-Gy irradiated cells and those recorded for control and 10-Gy irradiated cells. This suggests that the variation explained by this component partly arises from variations induced by irradiation. All the results of this analysis are reported in Table 2 for further comparison. Overall, PC2 and PC3 components show a dependence on the dose confirming the preliminary results obtained from the linear regression analysis, which indicated a difference between spectra from samples in different conditions. PCA analysis suggested that the changes are due to different x-ray doses. In fact, the PC1 component that is related to cellular variability7 does not show any dose dependence. In order to get information on the dependence of specific features on the radiation dose, the i-PCA analysis has been carried out on selected spectral ranges. In particular, four ranges have been considered for the i-PCA analysis: 2910 to , mainly including lipids-related features, 1590 to , including amide I–related features, 930 to , which is related to DNA/RNA features, and the 1250 to range, where the fingerprints of protein, lipids, and DNA/RNA are all observed. For each considered range, two i-PCA components are required to describe at least 80% of the total variance. The results are summarized in Table 2. The 1590 to interval is selected as the representative interval, and the corresponding results are shown and discussed in more detail. For this spectral range, the first two components are shown in Fig. 5(a), and the corresponding scores are shown in Fig. 5(b) as a score plot (i.e., PC2 scores versus PC1 scores). In particular, it can be observed that the PC1 component, accounting for 79% of the variability, displays three negative features, located at 1620, 1656, and , assigned to proteins and lipids. The corresponding PC1 scores depend on the dose and the differences between groups are statistically significant. In particular, an increase of the score is observed from the negative scores for the unirradiated cells spectra to positive values for doses of 2.5 and 5.0 Gy. PC1 scores become negative for spectra from 7.5- and 10-Gy irradiated cells. PC2 components explain 11% of the variance with positive and negative features reported in Table 2. The corresponding PC2 scores partially depend on the dose, as confirmed by statistical analysis. Fig. 5Results of the interval-PCA (iPCA) analysis performed in the 1590 to interval for Raman spectra of cells fixed at . By using the first two components, 90% of the total variance is explained: (a) first two PCA components with labels of assigned features (see text and Table 1) and (b) PC2 scores versus PC1 scores.  Details about i-PCA results for the 2910 to interval are reported in Table 2. Briefly, PC1 accounts for 68% and PC2 for 30%. PC1 scores show no dependence on the dose, and the differences among groups are not statistically significant. PC2 scores show a dependence on the dose: a decrease of the scores is observed from the positive mean of unirradiated cells spectra to negative values for doses of 2.5 and 5.0 Gy. A highly positive mean value is observed for 7.5-Gy irradiated cells and a value consistent (within the standard deviation) with that of the unirradiated cell spectra is observed. Statistical analysis shows that PC2 is able to discriminate all the groups with the exception of spectra from 0 and 10 Gy. The described dependence of PC1 and PC2 scores on the dose suggests that the inherent variability in the Raman fingerprints of the symmetric stretching in proteins and lipids and of CH stretching in lipids is described by the first component, while the variability induced by irradiation is explained by the second component. Regarding the 1250 to interval, the first component accounts for 69% of the total variance and the second component for 19%, as reported in Table 2. PC1 displays four negative features (see Table 2). The corresponding PC1 scores depend on the dose and the differences between groups are statistically significant for all the couples except when the spectra from unirradiated cells are compared to those from 10-Gy irradiated cells. The scores display a positive mean value at 0-Gy doses. The mean becomes negative for spectra from 2.5- and 5-Gy irradiated cells and positive for higher doses. PC2 displays two positive features and a negative one. The corresponding scores allow discriminating between only some groups, as obtained by statistical analysis. As for the i-PCA analysis performed on the 930 to spectral window, PC1 (accounting for 73% of the total variance) shows a negative feature at (due to stretching mode of phenylalanine) and a positive feature at , resulting from the superposition of contributions from proteins (C-N stretching), lipids (C-C stretching), and DNA/RNA (C-O stretching). PC2 displays a positive feature at , which has been assigned to the C-H bending of proteins phenylalanine. Statistical analysis shows that neither the scores of PC1 nor those of PC2 enable us to discriminate between the groups of spectra. However, PC1 scores enable to differentiate spectra from irradiated and unirradiated cells (whatever the dose is) and to separate spectra from cells irradiated with intermediate values of dose (2.5 and 5 Gy) from those from cells irradiated with high doses (7.5 and 10 Gy). Also, in this case, the last line of Table 2 regarding dose dependence can give further information. Summarizing the results of the i-PCA analysis, we can say that for cells fixed immediately after the irradiation for the 2910 to interval, typical of lipid contribution, some dose dependence is outlined for the PC2 component. These results are in agreement with the changes observed on membrane samples from irradiated Chinese hamster V79 cells.32 Also, the dose dependence shown by PC1 and PC2 components in the amide I region (1590 to ) is compatible with the changes reported in the literature.6,7,34 This can be ascribed to protein biochemical changes causing protein unfolding with the consequent loss of functional properties. 3.4.Multivariate Analysis of Raman Spectra from Cells Fixed 24 h After Irradiation (t24h-cells)To get information on the changes that occur in spectra detected for t24h-cells, PCA and i-PCA analysis have been performed on the complete data set from a cell, which is constituted by 98 spectra. According to the procedure described in Sec. 2, as a first step, the analysis has been carried out on the full spectral window (500 to ) and then i-PCA was performed. For all the cases, a number of components enabling us to describe at least 80% of the total variance have been considered. Results are reported in Table 3. Table 3Summary of PCA and iPCA results from t=24 h fixed cells. The spectral positions of all the features outlined by multivariate analysis are listed; negative features are marked by bold characters. In “Dose dep.” line, the dependence of PCA and i-PCA scores on x-ray dose is reported. Abbreviations: prt, partial; exp var., explained variability.
Regarding the PCA analysis of the full spectra, three components are required in order to describe 84% of the variance. The first PCA component [shown in Fig. 6(a)] describes 59% of the total variance in the data set. This component shows both negative and positive features that have been assigned and discussed (see Table 1). In this section, assignments are briefly reported between brackets (p for proteins, d for DNA/RNA, l for lipids) since almost all have been already discussed. In PC1 component, positive features are observed at (l,d), (p), (p), (p,l,d), (p,l,d), (d), (p), (p,l), (p,l), (p,l), and at (l). Negative features are observed at (p), (p,l), (p,l), (d), and at (p). According to the assignment, both positive and negative features mainly arise from proteins and lipids. As previously remarked, it cannot be determined whether the variability described by these overlapping negative features is uniquely lipid or protein in origin. By performing the statistical analysis, it comes out that the PC1 score values [Fig. 6(b)] show neither a clear separation between spectra from the irradiated and control cells nor a dependence on the dose. This can be read once again as a clue that the variability expressed by the first PCA component is mainly due to inherent variability within and among cells, which is in agreement with what was observed for spectra from t0-cells. Fig. 6Results of the PCA analysis for the full spectral window for cells fixed 24 h after x-ray exposure (t24h-cells); 84% of the total variance is explained by using the first three PCA components: (a) first PCA component (59% of total variance) with labels of assigned features (see text and Table 1), (b) PCA scores for the first PCA component (spectrum number versus PC1 scores); different markers categorize all 98 spectra by irradiation dose, (c) second PCA component (19% of total variance) with labels of assigned features, (d) spectrum number versus PC2 scores, (e) third PCA component (6% of total variance) with labels of assigned features, (f) spectrum number versus PC3 scores. 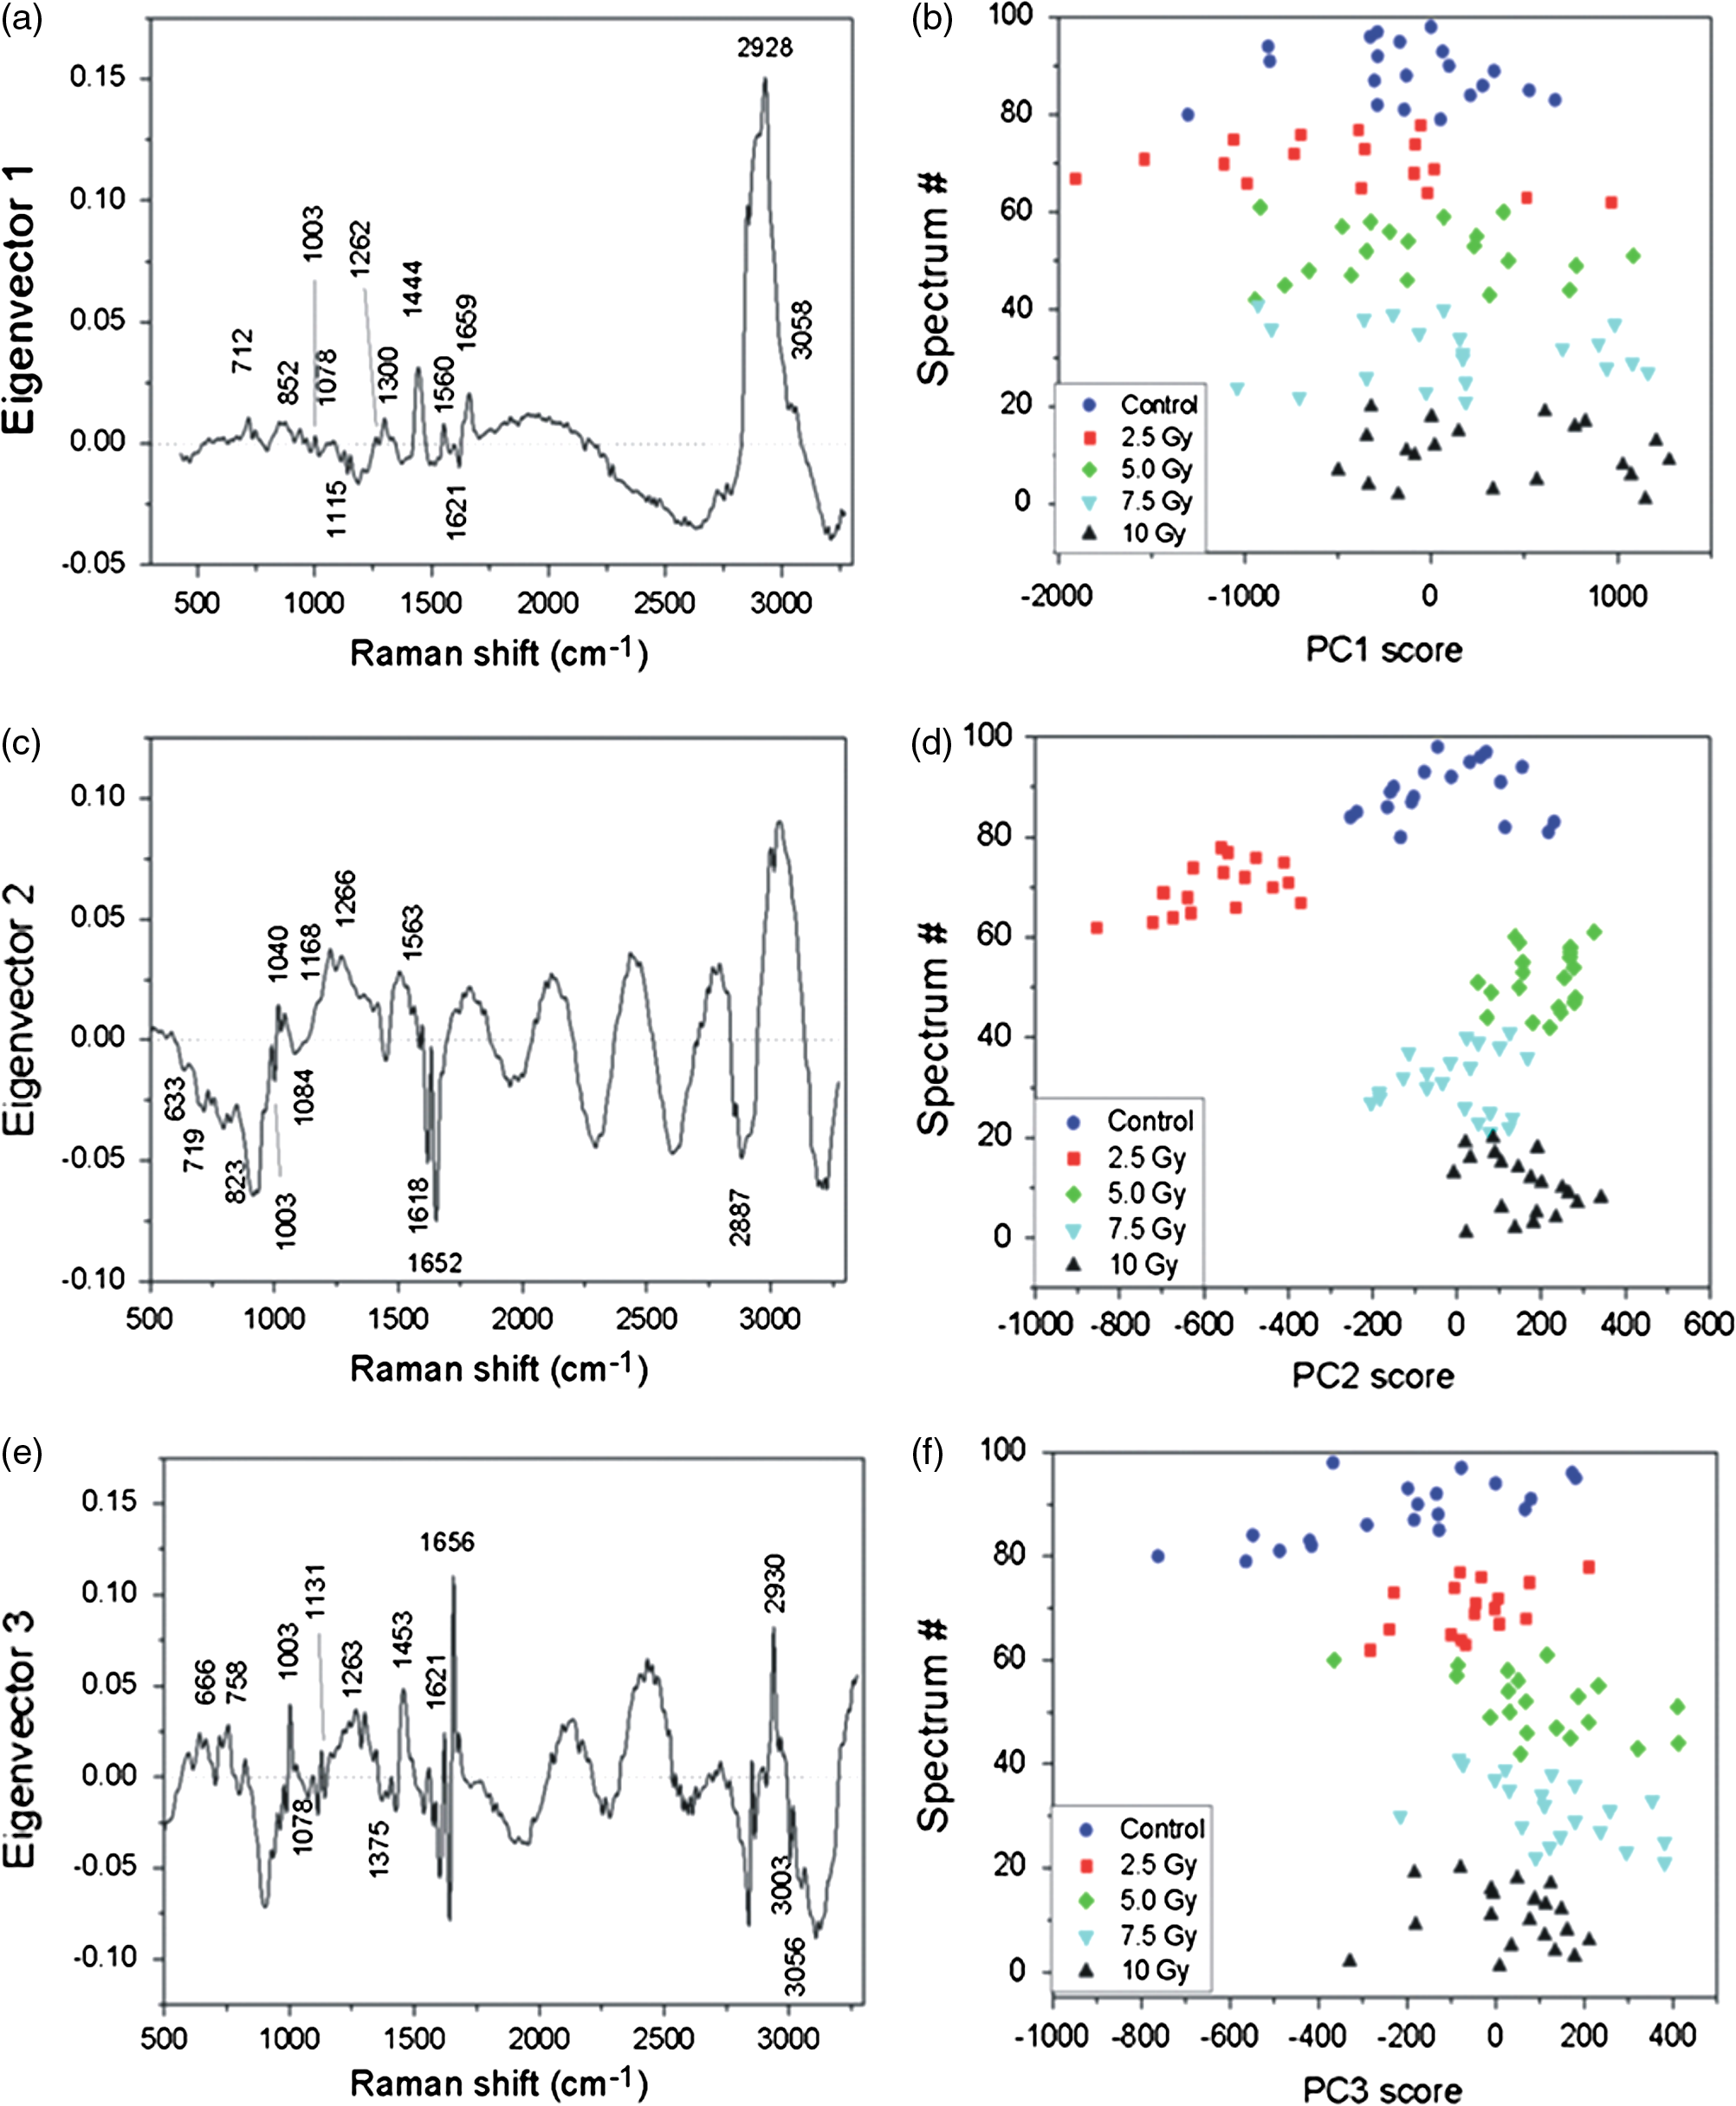 The second PCA component [Fig. 6(c)] accounts for 19% of the total variance in the data set. It shows positive assigned features located at (p), (p), (p,l), and at (d), and negative assigned features located at (p), (l,d), (p,d), (p), (p,l,d), (d), (p), (p,l), (p,l), and at (p,l). Also, in this case, the majority of the observed features arise from proteins and lipids. The PC2 scores [shown in Fig. 6(d)] are not able to discriminate among all the groups, but are only able to discriminate among spectra from 2.5-Gy dose irradiated cells and those from cells irradiated by higher doses, as inferred by the statistical analysis. The third PCA component [Fig. 6(e)] accounts for only 6% of the total variance in the data set, but is required to describe at least 80% of the total variance. The spectral positions of positive and negative features are summarized in Table 3. Among others, assigned positive features are observed at (d), (l,d), (p), (p,d), (p), (p), (p,l), (p,d,l), (p,d,l), (probably due to p,l), (d), (p), (p), and at (p,l), and negative features at (p,l,d), (p,l), (d), (l), and at (d). Differences among PC3 scores [Fig. 6(f)] are not statistically significant, and they do not allow a clear separation between spectra, thus suggesting that the variability expressed by this component is not dependent on the dose. After 24 h of x-ray exposure, the dose dependence of PCA components (see last line in Table 3) is almost entirely lost. This is in agreement with published studies suggesting that after x-ray exposure, some mechanisms are activated to minimize damages.35 The i-PCA analysis has also been employed for analyzing spectra from t24h-cells, by considering the same intervals discussed for spectra from t0-cells. Also, in this case, the results obtained for the 1590 to interval are discussed with slightly more detail. The first two components observed in this interval are shown in Fig. 7(a), and the corresponding scores are reported in Fig. 7(b) as PC2 scores versus PC1 scores. The first component, accounting for 49% of variability, shows three negative features at 1621, 1656, and , due to protein components. As for the mean of the scores, statistical analysis shows that PC1 is able to discriminate spectra from 0-Gy irradiated cells from spectra from cells irradiated with 2.5 and 5.0 Gy. On the contrary, PC1 scores seem not to be able to distinguish among spectra from 0- and 10-Gy and between 5- and 7.5-Gy irradiated cells. As for the second component, it accounts for 32% of the total variance and shows two positive features at (arising due to contribution from proteins) and (due to superposition of contributions from proteins and lipids), and a negative one at (p). The statistical analysis of the means shows that PC2 is able to discriminate spectra from 0- or 2.5-Gy irradiated cells from spectra of cells exposed to higher radiation doses (5.0, 7.5, and 10 Gy). Fig. 7Results of the iPCA analysis performed in the 1590 to interval for Raman spectra of cells fixed at . By using the first two components, 81% of the total variance is explained: (a) first two PCA components with labels of assigned features (see text and Table 1) and (b) PC2 scores versus PC1 scores.  As for the 2910 to spectral window, only one component is required to explain at least 80% of the total variance (PC1 accounts for 86%). This component features a negative peak at , which can be assigned to proteins and lipids. The second component, which explains only 13% of the total variance, displays a positive feature at that, considering the spectral resolution of the experiment, can be assigned to symmetric stretching in proteins and lipids and a negative feature at (l). Differences in PC1 and PC2 scores are not statistically significant. In the 1250 to range, the first component accounts for 68% of the total variability and shows two negative features located at (p,l,d) and (d). The second component, accounting for 15% of the total variance, shows two positive features at (p,l) and (p,l,d), and a negative one at (due to contributions from DNA/RNA). Neither PC1 score values nor PC2 score values show statistically significant differences between groups. The first component accounts for 60% of variance and the second component for 10% in the 930 to range. Hence, the third component is required for accounting for 80% of the total variance (PC3 accounts exactly for 10%). Despite this, the first two components are discussed here. The PC1 component shows a negative feature at and a positive one at , both related to proteins. A negative nucleic acid–related feature (at ) is also observed. The second component shows two positive features at 1003 and (both related to proteins), and a negative one at (p,l,d). As for the mean of the scores, neither PC1 values nor PC2 values show statistically significant differences. For cells fixed 24 h after the irradiation (see Table 3), it is possible to note that for almost all i-PCA components, the possibility to discriminate among spectra related to cells exposed to various levels of x-ray dose is quite lost. The only component that still maintains significant differences related to the dose is the PC1 component of the 1590 to amide I region. 4.ConclusionsThe herein presented analysis of Raman spectra from irradiated human mammary epithelial cells confirmed that they show significant differences compared to the spectra of control cells. The measurements were performed by using experimental conditions well suited to record spectra from intact cells. Univariate and multivariate analysis have been used to identify significant parameters for the study of changes induced by various levels of irradiation dose. Moreover, the comparison between analysis performed on cells fixed immediately after the exposure and the ones fixed after 24 h has enabled us to observe the effects of the recovery processes enacted by the cells, thanks to the use of the PCA analysis method. Our investigation confirms a good sensitivity of the micro-Raman technique to detect the chemical changes induced by x-ray radiation on fixed cells. Hence, this technique could be of use in the field of radiotherapy to monitor the minimal doses sufficient to lethally damage the cancer cells, thus reducing the risk of providing the patient with an excess of dose that could lead to damage of surrounding healthy cells. ReferencesE. B. Hanlon et al.,
“Prospect for in vivo Raman spectroscopy,”
Phys. Med. Biol., 45 R1
–R49
(2000). http://dx.doi.org/10.1088/0031-9155/45/2/201 PHMBA7 0031-9155 Google Scholar
G. J. Puppels et al.,
“Studying single living cells and chromosomes by confocal Raman microspectroscopy,”
Nature, 347 301
–303
(1990). http://dx.doi.org/10.1038/347301a0 NATUAS 0028-0836 Google Scholar
I. Delfino, A. R. Bizzarri and S. Cannistraro,
“Time-dependent study of single-molecule SERS signal from yeast cytochrome c,”
Chem. Phys., 326 356
–362
(2006). http://dx.doi.org/10.1016/j.chemphys.2006.02.020 CMPHC2 0301-0104 Google Scholar
I. Delfino et al.,
“Yeast cytochrome c integrated with electronic elements: a nanoscopic and spectroscopic study down to single molecule level,”
J. Phys.: Condens. Matter, 19 225009
(2007). http://dx.doi.org/10.1088/0953-8984/19/22/225009 JCOMEL 0953-8984 Google Scholar
J. Qi et al.,
“Raman spectroscopic study on Hela cells irradiated by x-rays of different doses,”
Chin. Opt. Lett., 7
(8), 734
–737
(2009). http://dx.doi.org/10.3788/COL20090708.0734 COLHBT 1671-7694 Google Scholar
R. Risi et al.,
“X-ray radiation-induced effects in human mammary epithelial cells investigated by Raman micro-spectroscopy,”
Proc. SPIE, 8427 84272E
(2012). http://dx.doi.org/10.1117/12.921389 PSISDG 0277-786X Google Scholar
Q. Matthews et al.,
“Raman spectroscopy of single human tumour cells exposed to ionizing radiation in vivo,”
Phys. Med. Biol., 56 19
–38
(2011). http://dx.doi.org/10.1088/0031-9155/56/1/002 PHMBA7 0031-9155 Google Scholar
S. Devpura et al.,
“Vision 20/20: the role of Raman spectroscopy in early stage cancer detection and feasibility for application in radiation therapy response assessment,”
Med. Phys., 41 050901
(2014). http://dx.doi.org/10.1118/1.4870981 MPHYA6 0094-2405 Google Scholar
M. Yasser et al.,
“Raman spectroscopic study of radioresistant oral cancer sublines established by fractionated ionizing radiation,”
PLoS One, 9
(5), e97777
(2014). http://dx.doi.org/10.1371/journal.pone.0097777 1932-6203 Google Scholar
J. L. Lambert, C. C. Pelletier and M. Borchert,
“Glucose determination in human aqueous humor with Raman spectroscopy,”
J. Biomed. Opt., 10 031110
(2005). http://dx.doi.org/10.1117/1.1914843 JBOPFO 1083-3668 Google Scholar
R. Malini et al.,
“Discrimination of normal, inflammatory, premalignant and malignant oral tissue: a Raman spectroscopy studies,”
Biopolymers, 81 179
–193
(2006). http://dx.doi.org/10.1002/(ISSN)1097-0282 BIPMAA 0006-3525 Google Scholar
B. G. M. Vandeginste et al., Handbook of Chemometrics and Qualimetrics, Elsevier Science, The Netherlands
(1998). Google Scholar
I. A. Boere et al.,
“Use of fibre optic probes for detection of Barrett’s epithelium in the rat oesophagus by Raman spectroscopy,”
Vib. Spectrosc., 32
(1), 47
–55
(2003). http://dx.doi.org/10.1016/S0924-2031(03)00046-8 VISPEK 0924-2031 Google Scholar
A. Molckovsky et al.,
“Diagnostic potential of near infrared Raman spectroscopy in the colon: differentiating adenomatous from hyperplastic polyps,”
Gastrointest. Endosc., 57
(3), 396
–402
(2003). http://dx.doi.org/10.1067/mge.2003.105 \GAENBQ 0016-5107 Google Scholar
J. W. Chan et al.,
“Nondestructive identification of individual leukemia cells by laser trapping Raman spectroscopy,”
Anal. Chem., 80
(6), 2180
–2187
(2008). http://dx.doi.org/10.1021/ac7022348 ANCHAM 0003-2700 Google Scholar
H. Yao et al.,
“Raman spectroscopic analysis of apoptosis of single human gastric cancer cells,”
Vib. Spectrosc., 50
(2), 193
–197
(2009). http://dx.doi.org/10.1016/j.vibspec.2008.11.003 VISPEK 0924-2031 Google Scholar
Y. H. Ong, M. Lim and Q. Liu,
“Comparison of principal component analysis and biochemical component analysis in Raman spectroscopy for the discrimination of apoptosis and necrosis in K562 leukemia cells,”
Opt. Express, 20
(20), 22158
–22171
(2012). http://dx.doi.org/10.1364/OE.20.022158 OPEXFF 1094-4087 Google Scholar
L. Nørgaard et al.,
“Interval partial least-squares regression (iPLS): a comparative chemometric study with an example from near-infrared spectroscopy,”
Appl. Spectrosc., 54 413
–419
(2000). http://dx.doi.org/10.1366/0003702001949500 APSPA4 0003-7028 Google Scholar
L. Leardi and L. Nørgaard,
“Sequential application of backward interval partial least squares and genetic algorithms for the selection of relevant spectral regions,”
J. Chemom., 18 486
–497
(2004). http://dx.doi.org/10.1002/(ISSN)1099-128X JOCHEU 0886-9383 Google Scholar
T. J. Harvey et al.,
“Classification of fixed urological cells using Raman tweezers,”
J. Biophotonics, 2
(1–2), 47
–69
(2009). http://dx.doi.org/10.1002/jbio.v2:1/2 JBOIBX 1864-063X Google Scholar
A. D. Meade et al.,
“Studies of chemical fixation effects in human cell lines using Raman microspectroscopy,”
Anal. Bioanal. Chem., 396 1781
–1791
(2010). http://dx.doi.org/10.1007/s00216-009-3411-7 ABCNBP 1618-2642 Google Scholar
M. R. Stampfer,
“Growth of human mammary epithelial cells in monolayer culture,”
Cell Culture Methods for Molecular and Cell Biology, 171
–182 Alan R. Liss Inc., New York
(1982). Google Scholar
J. D. Schoenfeld and J. R. Harris,
“Abbreviated course of radiotherapy for breast cancer,”
Breast, 20 S116
–S127
(2011). http://dx.doi.org/10.1016/S0960-9776(11)70308-3 1475-3480 Google Scholar
T. T. Puck and P. I. Marcus,
“Action of x-rays on mammalian cells,”
J. Exp. Med., 103 653
–666
(1956). http://dx.doi.org/10.1084/jem.103.5.653 JEMEAV 0022-1007 Google Scholar
R. E. Fisher, B. Tadic-Galeb and P. R. Yoder, Optical System Design, 2nd ed.McGraw Hill Prof., New York
(2000). Google Scholar
C. Camerlingo et al.,
“Wavelet data processing of micro-Raman spectra of biological samples,”
Meas. Sci. Technol., 17 298
–303
(2006). http://dx.doi.org/10.1088/0957-0233/17/2/010 MSTCEP 0957-0233 Google Scholar
C. Camerlingo et al.,
“An investigation on micro-Raman spectra and wavelet data analysis for pemphigus vulgaris follow-up monitoring,”
Sensors, 8
(6), 3656
–3664
(2008). http://dx.doi.org/10.3390/s8063656 SNSRES 0746-9462 Google Scholar
C. Camerlingo et al.,
“Micro-Raman spectroscopy and univariate analysis for monitoring disease follow-up,”
Sensors, 11
(9), 8309
–8322
(2011). http://dx.doi.org/10.3390/s110908309 SNSRES 0746-9462 Google Scholar
K. E. Esbensen, Multivariate Data Analysis—in Practice. An Introduction to Multivariate Data Analysis and Experimental Design, 4th ed.CAMO–ASA, Oslo
(2000). Google Scholar
I. Delfino et al.,
“Visible micro-Raman spectroscopy for determining glucose content in beverage industry,”
Food Chem., 127 735
–742
(2011). http://dx.doi.org/10.1016/j.foodchem.2011.01.007 FOCHDJ 0308-8146 Google Scholar
I. Notingher et al.,
“Spectroscopy study of human lung epithelial cell (A549) in culture: living cells versus dead cells,”
Biopolymers, 72 230
–240
(2003). http://dx.doi.org/10.1002/(ISSN)1097-0282 BIPMAA 0006-3525 Google Scholar
C. Yu et al.,
“Characterization of human breast epithelial cells by confocal Raman microspectroscopy,”
Cancer Detect. Prev., 30 515
–522
(2006). http://dx.doi.org/10.1016/j.cdp.2006.10.007 CDPRD4 0361-090X Google Scholar
M. Portaccio et al.,
“Monitoring production process of cisplatin-loaded PLGA nanoparticles by FT-IR microspectroscopy and univariate data analysis,”
J. Appl. Polym. Sci., 132
(3), 41305
(2015). http://dx.doi.org/10.1002/APP.41305 JAPNAB 1097-4628 Google Scholar
S. P. Verma and N. Sonwalkar,
“Structural changes in plasma membranes prepared from exposed Chinese hamster V79 cells as revealed by Raman spectroscopy,”
Radiat. Res., 126 27
–35
(1991). http://dx.doi.org/10.2307/3578167 RAREAE 0033-7587 Google Scholar
L. Hernandez et al.,
“Increased mammogram-induced DNA damage in mammary epithelial cells aged in vitro,”
PLoS One, 8
(5), e63052
(2013). http://dx.doi.org/10.1371/journal.pone.0063052 1932-6203 Google Scholar
BiographyInes Delfino is an assistant professor at the University of Tuscia, Viterbo, Italy. She received her MS degree in physics in 1996 and her PhD degree in materials engineering in 2001 from the University of Napoli “Federico II.” She is the author of more than 50 journal papers and international volumes. Her current research interests include optical spectroscopies, biophotonics, nanohybrid systems, and multivariate analysis. |
|||||||||||||||||||||||||||||||||||||||||||||||||||||||||||||||||||||||||||||||||||||||||||||||||||||||||||||||||||||||||||||||||||||||||||||||||||||||||||||||||||||||||||||||||||||||||||||||||||||||||||||||||||||||||||||||||||||||||||||||||||||||||||||||||||||||||||||||||||||||||||||||||||||||||||||||||||||||||||||||||||||||||||||||||||||||||||||||||||||||||||||||||||||||||||||||||||||||||||||||||||||||||||||||||||||||||||||||||||||||||||||||||||||||||||||||||||||||||||||||||||||||||||||||||||||||||||||||||||||||||||||||||||||||||||||||||||||||||||||||||||||||||||||||||||||||||||||||||||||||||||||||||||||||||||||||||||||||||||||||||||||||||||||||||||||||||||||||||||||||||||||||||||||||||||||||||||||||||||||||||||||||||||||||||||||||||||||||||||||||||||||||||||||||||||||||||||||||||||||||||||||||||||||||||||||||||||||||||||||||||||||


