|
|
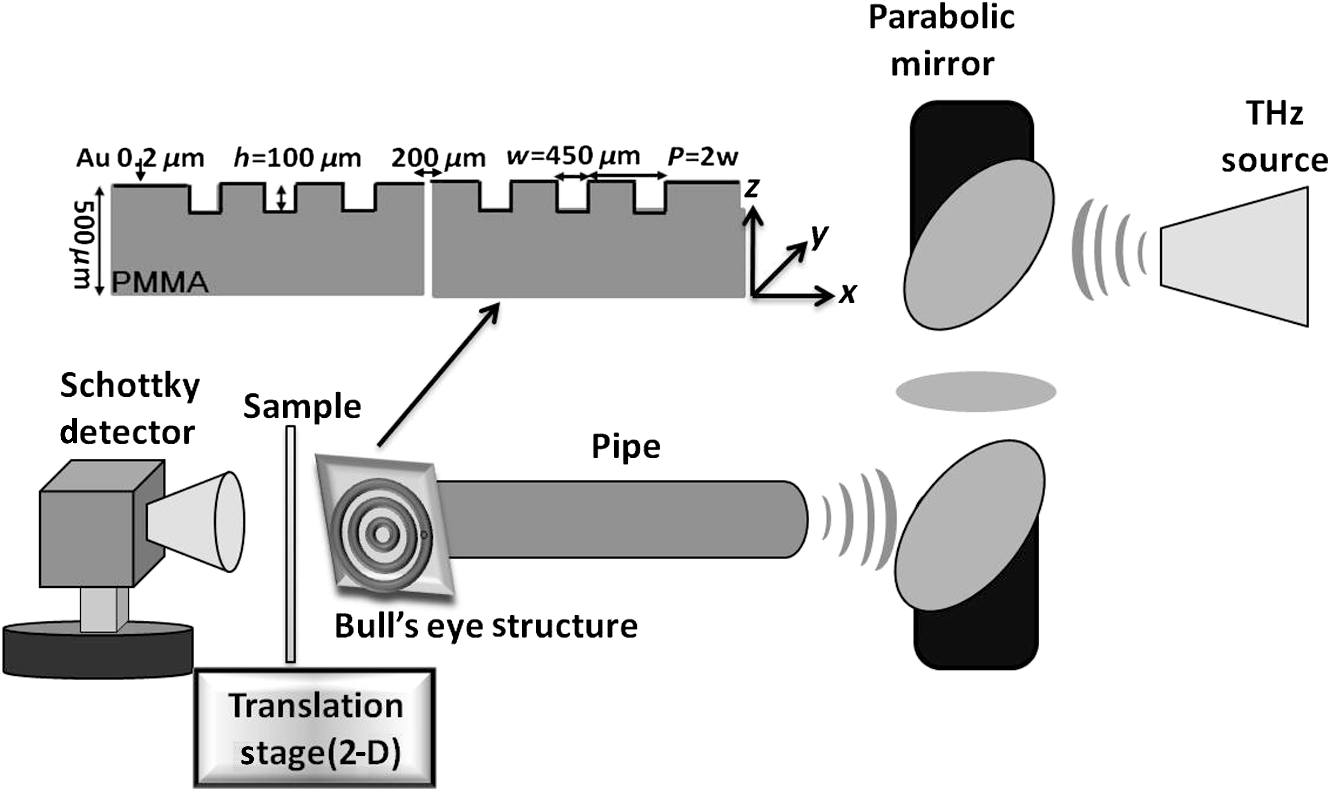
1.IntroductionTerahertz (THz) radiation has a number of properties that make it an attractive biomedical imaging technique.1–8 For example, compared to infrared and optical radiation, THz radiations longer wavelengths reduce the chances of scattering in biologic tissue.1 Contrary to x-rays, THz radiation has relatively low photon energy and so does not ionize tissues.2,3 Moreover, crystalline molecules have characteristic “fingerprint” absorption spectra (vibrational or rotational energy level) at THz range.9,10 This offers the possibility to combine spectral identification with imaging. THz radiation can also detect differences in water content and density of tissue.10 Such methods could allow effective detection of cancer with a safer and less invasive means.3–8 It has been previously shown that THz imaging techniques can be used to observe an absorbance contrast between healthy and cancerous breast,3–5 skin,6 liver,7 and colonic human tissues.8 This presented the potential for THz imaging to be used as a diagnostic probe for tumors. In our previous works,4,5,7 we demonstrated the capability of THz near-field imaging to differentiate human breast and liver tumors from healthy tissues. Here, we improved on our original THz fiber-based near-field imaging system4,5,7 by increasing the THz power at the sample by use of a pipe waveguide. We then used this pipe-based near-field imaging system to diagnose freshly surgically excised human colonic tissues. The difference in THz absorption between tumor and healthy tissue can be used to identify cancerous tissue and shows a good correlation both in size and shape with corresponding pathological micrographs. The capability to distinguish tumors from healthy tissues is also demonstrated by quantitative analysis, and the corresponding sensitivity and specificity are both as high as 100%. 2.Experimental SetupA schematic of the THz pipe-based near-field imaging system is shown in Fig. 1. In brief, a continuous wave Gunn oscillator module emitted 300 GHz waves, which were collected by a pair of off-axis parabolic mirrors and focused into a polymethyl methacrylate pipe waveguide with a substantially low attenuation constant ( at 300 GHz).11 Compared to our previous fiber-based imaging system, the illuminating THz power on the sample was increased by about 50%.11 The pipe has a central core diameter of 5.0 mm with 0.5 mm of cladding. The length of the pipe was 40 cm. The guiding mechanism of the pipe waveguide is similar to the antiresonant reflecting optical waveguide,12 but realized by a single low index () dielectric layer. Behind the pipe output, we used a bull’s-eye metallic spatial filter4,5,13 with a subwavelength aperture ( diameter) to achieve enhanced transmission power and near-field spatial resolution. The longitudinal section diagram of the filter is shown in the inset of Fig. 1. The periodic concentric grooves with Au film caused the resonant coupling of the THz waves to the surface plasmon waves and accordingly enhanced the transmission. Figure 2 shows the calculated transmission enhancement factor of an aperture with a bull’s-eye structure filter normalized to a bare aperture with the same size. The transmission ratio through an aperture with a bull’s-eye structure was 2.01%, which was 10-fold higher than transmission through a bare aperture, i.e., 0.19%. The spatial resolution was estimated by a knife-edge method.14 We measured the transmission power by scanning a sharp-edged metal film across the THz beam radiated from the exit side of the bull’s-eye aperture. Therefore, by using the 10% to 90% criterion of the transmission power in the - and -directions, we quantified the effective spatial resolution as 0.22 mm in the -direction and 0.21 mm in the -direction. In Fig. 3, we also measured the effective spatial resolution along the -direction. It is clear that the bull’s-eye metallic spatial filter leads to a strong angular confinement. Finally, the transmitted power from the exit side of the aperture was detected by a Schoktty diode detector. The two-dimensional () image was obtained by scanning the sample with by two fast speed translation stages, and the imaging time was about 1 min for steps. 3.Specimen Preparation and Imaging AcquisitionThe specimens used in the study were provided by Tumor Specimens Library, Jiangsu. All specimens were frozen-sectioned into thick slices and placed on the selected coverglasses. Before sectioning the tissues, coverglasses were first carefully selected with the same thickness (), and then all the selected coverglasses were fixed on the microscope slice holder of the microscope stage for THz transmission measurement. According to the measured absorbance shown in Fig. 3, we can see that the minimum absorbance deference between healthy colonic tissue and cancerous tissue was . After acquiring the transmission power of the coverglasses, we removed the coverglasses which had transmission power 5% lower or higher than the average value. It is important to notice that 5% transmission fluctuation will mean error in the measured absorbance for a thick sample slice. The distance in the -direction between the bottom of the coverglasses and the surface of the metallic bull’s-eye structure was approximately . Coverglasses were stabilized on a microscope slice holder of a microscope stage. The distance in the direction between the bottom of the sample and the surface of the metallic bull’s-eye structure was approximately . After the tissues’ sectioning, we brought the specimens to THz imaging within half an hour. During THz imaging, without any other treatment, we kept the specimens under room temperature of 22°C. The laboratory had humidity. The specimens were beginning to thaw during the measurement but showed no signs of dehydration. Before THz near-field transmission illumination imaging, we did not know whether the tissues were healthy or with tumor. After THz imaging analysis, all specimens were sent for routine pathological hematoxylin and eosin (H&E) stain and examination in Tumor Specimens Library. That is to say, we performed THz analysis and histological identification independently. THz near-field images in this work show the THz absorbance () of the measured samples. Most of the tissue samples were not homogeneous and contained a mixture of tissue types. To extract the properties of the constituent tissue types, the absorbance was averaged linearly by assuming that any reflections and scattering caused by heterogeneities within samples were negligible.9,10,15 The absorbance was calculated according to the Beer–Lambert law , where is the transmitted power of the THz wave through the slices and the coverglass, is the background (transmission power of THz wave through the blank coverglass), and is the thickness of the slice, which was measured and averaged according to 3 to 5 different positions of each slice using an optical microscope. For the poor section quality condition induced by man-made or machine causes, the viscous tissues will adhere to the blade and make the slices with uneven thickness. With higher transmission in these specific thin spots, thus obtained value will be underestimated. We found that if the sample thickness fluctuation exceeded , the calculated would be fallacious. All samples selected had a thickness fluctuation lower than . The absorbance spectra we used for analyzing images are shown in Fig. 4, which was measured in far-field and calculated according to the mean absorbance based on 30 different human colonic tissue specimens (14 healthy and 16 with tumor). Samples for the THz spectra measurement were prepared by cutting slices of tissue with a uniform thickness of approximately . The error was induced by the differences in water content and tissue density of human tissues.10 From Fig. 4, the mean absorbance of healthy colonic tissue was 9.3 to , while tissue with tumor was 11.4 to .8 It is clear that cancerous tissue absorbed much more THz waves than healthy tissues. The distinguishable absorbance contrast between healthy and cancerous tissue was the key to realizing THz imaging examination. Therefore, as our THz image show, we defined the color bar as follows: if the absorbance inside a certain region of the THz image was about 11.4 to , we marked the regions as tumor and showed the region in red color, while the healthy tissue was in green color. The acquired THz near-field images and the corresponding pathologic photomicrograph of H&E stained sections are shown in Fig. 5. From the corresponding THz near-field images, we successfully identified the healthy tissue and cancerous tissue, which agreed well with the identification by pathological H&E stain examination in terms of size and shape. 4.Performance StudyBefore the THz near-field imaging can be widely recognized in clinical practice, the performance of sensitivity and specificity are important determinants.16,17 The diagnosis outcome can be positive or negative, while the actual health status of the people may be different. The definitions are as follows: true positive (TP): sick people correctly diagnosed as cancerous. False positive (FP): healthy people wrongly identified as cancerous. True negative (TN): healthy people correctly identified as healthy. False negative (FN): sick people wrongly identified as healthy. Sensitivity is the probability of a positive diagnosis among patients with cancer, and it can be expressed as . Specificity is the probability of a negative diagnosis among patients without cancer, and it can be described as: . Based on the results on 58 specimens (20 healthy tissues and 38 tissues with tumor) from 31 patients (mean age: 59 years; range: 46 to 79 years), we studied the sensitivity and specificity of the THz near-field imaging to quantify the diagnostic capability of the examination. The THz near-field examinations of all these specimens are in good agreement with the corresponding pathologic diagnoses. The outcome statistics show that the corresponding sensitivity and specificity are both 100%. Therefore, from the THz near-field microscopic images of colonic tissues, we would expect 100% of patients with colonic tumor to have abnormal examination results while 100% of patients without colonic cancer would have normal examination results. The above statistical results indicate that our THz near-field imaging system could be added to the surgeon’s imaging instruments to improve and aid the detection and diagnosis of colonic tumor tissues. 5.ConclusionIn conclusion, using a pipe-based near-field THz imaging system, we test the possibility of diagnosing human colonic tissues. According to the THz absorbance contrast, the result of the THz near-field imaging examination agrees well with the follow-up identification of the same sliced sample with pathologic H&E stain diagnosis. Due to the fact that all the results are easily quantifiable based on the absorbance, THz imaging is thus possible to reduce the load of extensive and time-consuming pathological examination procedures. Meanwhile, based on the statistical study, we demonstrated that the corresponding diagnostic sensitivity and specificity on colonic cancer could both be as high as 100%. With the help of this THz near-field imaging system, we can expect to economize the use of hospital and human resources. AcknowledgmentsThis work was supported by the National Natural Science Foundation of China under Grant Nos. 61107089 and 11374050. ReferencesB. Ferguson et al.,
“Identification of biological tissue using chirped probe THz imaging,”
Microelectron. J., 33
(12), 1043
–1051
(2002). http://dx.doi.org/10.1016/S0026-2692(02)00109-X MICEB9 0026-2692 Google Scholar
A. J. Fitzgerald, B. E. Cole and P. F. Taday,
“Nondestructive analysis of tablet coating thickness, uniformity and integrity using terahertz pulsed imaging,”
J. Pharm. Sci., 94
(1), 177
–183
(2005). http://dx.doi.org/10.1002/(ISSN)1520-6017 JPMSAE 0022-3549 Google Scholar
A. J. Fitzgerald et al.,
“Terahertz pulsed imaging of human breast tumors,”
Radiology, 239
(2), 533
–540
(2006). http://dx.doi.org/10.1148/radiol.2392041315 RADLAX 0033-8419 Google Scholar
H. Chen et al.,
“Performance of THz fiber-scanning near-field microscopy to diagnose breast tumors,”
Opt. Express, 19
(20), 19523
–19531
(2011). http://dx.doi.org/10.1364/OE.19.019523 OPEXFF 1094-4087 Google Scholar
C. M. Chiu et al.,
“All-terahertz fiber-scanning near-field microscopy,”
Opt. Lett., 34
(7), 1084
–1086
(2009). http://dx.doi.org/10.1364/OL.34.001084 OPLEDP 0146-9592 Google Scholar
R. M. Woodward et al.,
“Terahertz pulse imaging in reflection geometry of human skin cancer and skin tissue,”
Phys. Med. Biol., 47
(21), 3853
–3863
(2002). http://dx.doi.org/10.1088/0031-9155/47/21/325 PHMBA7 0031-9155 Google Scholar
H. Chen et al.,
“The diagnosis of human liver cancer by using THz fiber-scanning near-field imaging,”
Chin. Phys. Lett., 30
(3), 030702
(2013). http://dx.doi.org/10.1088/0256-307X/30/3/030702 CPLEEU 0256-307X Google Scholar
C. B. Reid et al.,
“Terahertz pulsed imaging of freshly excised human colonic tissues,”
Phys. Med. Biol., 56
(14), 4333
–4353
(2011). http://dx.doi.org/10.1088/0031-9155/56/14/008 PHMBA7 0031-9155 Google Scholar
P. C. Ashworth et al.,
“Terahertz pulsed spectroscopy of freshly excised human breast cancer,”
Opt. Express, 17
(15), 12444
–12454
(2009). http://dx.doi.org/10.1364/OE.17.012444 OPEXFF 1094-4087 Google Scholar
S. Sy et al.,
“Terahertz spectroscopy of liver cirrhosis: investigating the origin of contrast,”
Phys. Med. Biol., 55
(24), 7587
–7596
(2010). http://dx.doi.org/10.1088/0031-9155/55/24/013 PHMBA7 0031-9155 Google Scholar
L. J. Chen et al.,
“Low-loss subwavelength plastic fiber for terahertz waveguiding,”
Opt. Lett., 31
(3), 308
–310
(2006). http://dx.doi.org/10.1364/OL.31.000308 OPLEDP 0146-9592 Google Scholar
M. A. Duguay et al.,
“Antiresonant reflecting optical waveguides in multilayer structures,”
Appl. Phys. Lett., 49
(1), 13
–15
(1986). http://dx.doi.org/10.1063/1.97085 APPLAB 0003-6951 Google Scholar
A. Agrawal and A. Nahata,
“Time-domain radiative properties of a single subwavelength aperture surrounded by an exit side surface corrugation,”
Opt. Express, 14
(5), 1973
–1981
(2006). http://dx.doi.org/10.1364/OE.14.001973 OPEXFF 1094-4087 Google Scholar
S. Hunsche et al.,
“THz near-field imaging,”
Opt. Commun., 150
(1–6), 22
–26
(1998). http://dx.doi.org/10.1016/S0030-4018(98)00044-3 OPCOB8 0030-4018 Google Scholar
G. M. Png et al.,
“The impact of hydration changes in fresh bio-tissue on THz spectroscopic measurements,”
Phys. Med. Biol., 53
(13), 3501
–3517
(2008). http://dx.doi.org/10.1088/0031-9155/53/13/007 PHMBA7 0031-9155 Google Scholar
A. K. Akobeng,
“Understanding diagnostic tests 1: sensitivity, specificity and predictive values,”
Acta Paediatr., 96
(3), 338
–341
(2007). http://dx.doi.org/10.1111/j.1651-2227.2006.00180.x APAEEL 0803-5253 Google Scholar
D. G. Altman and J. M. Bland,
“Statistics notes diagnostic tests 1: sensitivity and specificity,”
Br. Med. J., 308
(6943), 1552
(1994). http://dx.doi.org/10.1136/bmj.308.6943.1552 BMJOAE 0007-1447 Google Scholar
|