
|
|
1.IntroductionCorneal collagen cross-linking (CXL), a nearly noninvasive treatment method, has been developed to slow down or halt the progression of keratoconus.1 The procedure of CXL is based on the application of combined ultraviolet-A (UV-A) light and riboflavin (vitamin B2). Riboflavin injection followed by UV-A irradiation causes a photochemical reaction (photosensitized oxidation)2 that gives rise to cross-linking by forming intra- and interfibrillar covalent bonds between collagen fibrils in the corneal stroma.3 As a result, mechanical stiffness of the cornea and its biochemical resistance to enzymatic digestion are increased,4,5 which impedes the progression of keratoconus. Owing to its safety, positive clinical outcomes, and simple protocol, CXL treatment has become very common,1 and its clinical sustaining effects have been demonstrated.6 Since then, detection and measurement of the treatment results have been receiving much attention. To date, several optical imaging techniques have been applied to investigate the morphological changes and to identify the treatment effect on the cornea after the CXL treatment. Mazzotta et al.7 investigated the side effects of CXL treatment, such as stromal edema, rarefaction, and stromal keratocyte reappearance with time, using confocal laser scanning microscopy that enabled the observation and evaluation of corneal layers and nerves at the subcellular level.8–11 With an immunofluorescence confocal imaging system, Bottós et al.12 directly visualized ultrastructural stromal modification in porcine cornea after a CXL procedure and quantitatively assessed the CXL treatment effect. However, staining with specific fluorescent dye and/or contrast agent for targeting cellular components requires additional sample preparation and can be toxic to tissues. Bueno et al.13 identified morphological changes in corneal stroma after CXL treatment in bovine and porcine eyes using nonlinear microscopy, which provides two-photon excitation fluorescence and second harmonic generation corneal images without any staining process.14–17 Although those microscopic imaging modalities can achieve subcellular spatial resolution, their imaging speed, penetration depth, and field of view are limited. As an alternative imaging method, Doors et al.18 used anterior segment optical coherence tomography (AS-OCT) to report a short-term CXL treatment result and its relationship with morphological characteristics appearing after the treatment. Although this method has high imaging speed, deep penetration depth, and large field of view, it is only capable of providing the scattering property without other functional tissue properties, such as birefringence. Polarization-sensitive OCT (PS-OCT), referred as a functional extension of OCT, measures the polarization state of backscattered light and provides depth-resolved polarization property images of the sample structure. In human eye imaging, PS-OCT has been demonstrated to distinguish structures with birefringent, polarization preserving, and depolarizing properties.19–26 Due to the fact that the cornea consists of highly organized collagen fibrils in the stroma, it is known to have birefringence, and abnormalities in the cornea, such as keratoconus, cause the disruption in the organization of the collagen fibrils appear with an alternation of the birefringence.27 PS-OCT has been utilized to investigate the birefringence property of keratoconus.27,28 Recently, Alonso-Canerio et al.29 reported the promising potential of PS-OCT for identifying the changes occurring after chemical agent (glutaraldehyde)-based CXL treatment on porcine cornea. The aim of this pilot study is to assess the utility of PS-OCT to image and discriminate the morphological variation caused by more clinically relevant riboflavin/UV-A induced collagen cross-linking treatment on cornea. The riboflavin instillation followed by UV-A irradiation is applied on freshly enucleated bovine eyes in order to stimulate cross-linking. Using PS-OCT, the cross-linking effect is observed in cross-sectional structure with a standard scattering OCT image, and polarization contrast images such as phase retardation and degree of polarization uniformity (DOPU).21 With graph theory-based cornea segmentation algorithm,30 the thickness variation caused by CXL is also quantitatively analyzed. In particular, a global threshold is set from the averaged DOPU depth profile and is applied for estimating the effective cross-linking depth. In this study, standard and accelerated CXL protocols are applied on the bovine cornea, and the cross-linking effectiveness following the different protocols are compared. 2.Materials and Methods2.1.SystemJones-matrix-based OCT (Jones matrix OCT), one of the subtypes of PS-OCT, is employed in this study. Figure 1 shows the schematic of the Jones matrix OCT. The system design and processing principle are very similar to the previous system reported by the authors.31 The system is based on a MEMS-based swept-source (Axsun Technology Inc., Massachusetts) with a 100 kHz sweeping rate, a center wavelength of 1060 nm, and a spectral range around 110 nm. These properties of the light source determine the depth resolution of the system, which is measured to be in air. The light source is directed to a 90:10 fiber coupler after passing through a fiber isolator that is inserted for protection of the light source from backreflected light; 90 and 10% of the light are coupled to a passive polarization delay unit and a reference arm, respectively. Fig. 1Schematic diagram of Jones matrix optical coherence tomography (OCT) system. LP, linear polarizer; PC, polarization controller; FC, fiber collimator; M, mirror; PBS, polarizing beam splitter; NPBS, nonpolarizing beam splitter; H and V, horizontal and vertical balanced photodetectors.  The polarization delay unit composed of a linear polarizer, a polarization beam splitter (PBS), and two mirror-based retroreflectors is employed for multiplexing two polarization states of the light source by splitting the beam into two orthogonal linear polarization states, delaying one from the other by adjusting one of the retroreflectors, and then recombining them. The light from the polarization delay unit is then directed to a 50:50 fiber coupler. The two ports of the fiber coupler are connected to a sample arm and a phase stabilization unit, respectively. From the phase stabilization unit that consists of a fiber collimator, lens, and mirror, a phase calibration signal is generated and utilized for stabilizing the phase of OCT signal among A-scans. The detailed description of the unit and data processing has been reported elsewhere.31 The sample beam passes through a collimator (F280 APC-C, Thorlabs Inc., New Jersey), a two-axis galvanometer scanner, and an objective lens (AC254-060-C-ML, Thorlabs Inc.) and finally illuminates the eye. The reference beam, reflected by a mirror and recoupled to the 90:10 coupler, is aligned to the linear polarization state of the 45-deg angle by a linear polarizer in the polarization diversity (PD) detection unit that also consists of a nonpolarization beam splitter (NPBS), two PBSs, and two balanced photodetectors (BPDs, PDB430C, Thorlabs Inc.). In the PD detection unit, the reference light combines with the backscattered sample light from the eye at the NPBS. The combined light is then split into horizontal and vertical polarization components by the PBSs, and finally, the interference signal is detected by the BPDs. With this configuration, the PS-OCT system enables acquisition of Jones matrix tomography in which a Jones matrix is obtained for each pixel. In the sample arm, a collimated light with a diameter of 3.4 mm is introduced into the objective lens with a focal length of 60 mm. The lateral resolution is estimated to be . The measurable imaging depth range is determined to be with a polarization delay displacement of , which is set by the polarization delay unit.31 With an optical probing power of 1.5 mW, which is below the laser safety limit defined by American National Standard Institute, the sensitivity and signal roll-off are measured to be 93.5 dB and , respectively. 2.2.Specimen PreparationTo investigate the cross-linking effect on the corneal stroma in detail after a CXL procedure, we measured bovine cornea ex vivo using the PS-OCT described in Sec. 2.1. Fresh bovine ocular globes (30 specimens) were obtained from a local abattoir (Pitt Meadows Meats Ltd., Canada). All eyes were from less than eight-months-old animals, enucleated and transported within 2 h postmortem. During the transportation, the samples were submerged in physiologic saline medium (0.9% sodium chloride irrigation, Baxter Corp.) and kept in a cool box. Without staining or fixation, the eyes were submerged under BSS sterile irrigation solution (Alcon Canada Inc., Canada) in a container with the anterior side facing the probe beam and imaged within 24 h postmortem. The bovine eyes were divided into four groups according to the different preparation processes. For the CXL group (10 eyes), a conventional CXL procedure was performed following the standard protocol (Ref. 1). In order to allow the photosensitizer solution to diffuse into the stroma, after removing the corneal epithelium using a scalpel, riboflavin solution (10 mg riboflavin-5-phosphaste 0.1% in 10 mg dextran-T-500 20% solution, Macdonald’s Prescriptions laboratory, Canada) was administrated every 5 min for 30 min. Next, UV-A light irradiance with a 365 nm wavelength and power was applied for 30 min (energy dose of ). During the UV-A exposure time, instillation of riboflavin solution was continued every 5 min. For the accelerated CXL (ACXL) group (10 eyes), a similar protocol for the CXL procedure except with a higher UV-A irradiation power of but a shorter exposure time of 10 min was applied, where the same energy dose of was used. Two control groups were designed. In control A (five eyes), only mechanical epithelial debridement was performed. In control B (five eyes), instillation of riboflavin solution at every 5 min was additionally applied for 30 min. No UV-A irradiation was applied to either control group. 2.3.Measurement and Postprocessing ProtocolPS-OCT images were acquired from the center of the cornea. A transversal area of 4.5 mm was scanned with 512 A-lines to form a B-scan image, and 10 B-scans were successively taken at the same location. With the multiple B-scans, a global-phase-corrected sensitivity-enhanced scattering OCT image was created.31 For the phase retardation image, adaptive Jones matrix averaging with a kernel size of () was applied for improving the image quality of the phase retardation.31 Finally, a DOPU image was also produced from the averaged Jones matrix image.31 Here, since the accuracy of the polarization-dependent measurements can be drastically affected by the signal-to-noise ratio (SNR),32 data points whose effective SNR was were discarded in the computation of the phase retardation and DOPU images. In order to identify the time-dependent morphological variation caused by the CXL procedure, each eye sample was imaged every 10 min over a period of 2 h. 2.4.Corneal Thickness CalculationIn order to measure the corneal thickness, a simplified version of the graph theory-based cornea segmentation algorithm30 was applied in this study. The segmentation process is illustrated with one eye of the control A group as shown in Fig. 2. Fig. 2Graph-theory-based cornea segmentation procedure: (a) original OCT intensity image, (b) and (c) positive and negative gradient images, and (d) and (e) top and bottom cornea boundaries obtained from the gradient images, (f) segmented cornea layer, and (g) final segmentation result with second-order polynomial fitting process.  First, positive gradient [Fig. 2(b)] and negative gradient [Fig. 2(c)] images are obtained from the scattering OCT image [Fig. 2(a)]. Second, from the gradient images, the surface [Fig. 2(d)] and the bottom [Fig. 2(e)] boundaries corresponding to Bowman’s membrane and corneal endothelium layers are determined and then overlapped with the original OCT image [Fig. 2(f)]. Finally, the segmented layers are fitted by a second-order polynomial fitting process and delineated as shown in Fig. 2(g). With this fitted boundary information, the mean and standard deviation of the overall corneal thickness were calculated and used for quantitative analysis of the time-dependent thickness variation described in Sec. 3.2. Here, a refractive index of bovine stroma ()33 was used in this study for calculating the corneal thickness because the dominant corneal layer component within the measurement range was stroma after removing the epithelium layer. 3.Results3.1.Cross-Linking Effect on CorneaFigure 3 shows representative PS-OCT measurement results of the control A (upper row) and CXL group (bottom row). In Fig. 3, each column represents scattering OCT [Figs. 3(a) and 3(d)], phase retardation [Figs. 3(b) and 3(e)], and DOPU images [Figs. 3(c) and 3(f)], respectively. Fig. 3Representative B-scan images of the bovine cornea. Upper and bottom rows represent control A and collagen cross-linking (CXL) group, respectively: (a) and (d) scattering OCT images, (b) and (e) phase retardation images, and (c) and (f) degree of polarization uniformity (DOPU) images are shown. Scale bars show 1 mm.  In the case of control A, within the stromal layer, homogeneous intensity distribution and random phase retardation are observed in the scattering OCT image [Fig. 3(a)] and the phase retardation image [Fig. 3(b)], respectively. In addition, as shown in Fig. 3(c), no remarkable feature is identified with the DOPU contrast. In the CXL group, on the other hand, the anterior part of the stroma appears with a slightly higher contrast in the scattering OCT image [Fig. 3(d)]. Unlike the control case, a depth-oriented slow increase is observed in the phase retardation image [Fig. 3(e)]. Particularly, a distinctive zone is clearly identified at the anterior stroma in the DOPU image [Fig. 3(f)] as exhibiting an increased DOPU contrast. In this study, this distinctive region observed within the anterior stroma after the CXL procedure is defined as an effective cross-linking region, which is more specifically described in Sec. 4. The histograms of the phase retardation are further shown in Fig. 4. Because of the depth-oriented phase retardation increase within the effective cross-linking area, an asymmetrical shape known as a right-skewed distribution pattern is observed in the histogram of the CXL group (blue bars), while a pattern very close to normal distribution is found from the histogram of control A (red bars). 3.2.Corneal Thickness ChangeDuring the time-series measurement, it is noticed that the CXL procedure causes corneal thinning. In order to identify the main factor of the corneal thinning, measurement results of three different groups with time intervals of 1 h are compared as shown in Fig. 5: control A [without riboflavin instillation and UV-A irradiation, upper row Figs. 3(a)–3(c)], control B [with riboflavin instillation but without UV-A irradiation, middle row Figs. 3(d)–3(f)], and CXL group (with riboflavin instillation and UV-A irradiation, bottom row Figs. 3(g)–3(i)]. Each time-series measurement starts after the corneal epithelium abrasion (control A), riboflavin administration for 30 min (control B), and UV-A illumination for 30 min (CXL group), respectively. Fig. 5Representative OCT intensity B-scan time-series images of control A (upper row), control B (middle row), and CXL group (bottom row) with time intervals of 1 h.  As shown in Fig. 5, the corneal thickness reduction could be observed from all of the three groups listed above, even though the eyes were immersed in irrigating solution to avoid dehydration effects. Nevertheless, more rapid progression of corneal thinning is found from both the control B and CXL groups. Using the corneal thickness calculation method described in Sec. 2.4, the mean corneal thickness of each group and its variation over 2 h with time intervals of 10 min are measured and plotted in Fig. 6. From control A, the dehydration effect on the corneal thickness given by the experimental condition is confirmed by its mean thickness change rate of (thickness from to ). From the CXL group, the mean thickness decrease rate of (thickness from to ) is found, which demonstrates the corneal thinning followed by the CXL procedure as showing a steeper decrease in corneal thickness as compared with control A. In addition, a comparable corneal thickness change rate of (thickness from to ) is also observed in control B. While dehydration in the ex vivo cornea is unavoidable under the current experimental conditions, the faster thinning rate in the control B and CXL groups indicates that additional corneal thinning happens due to the riboflavin instillation that is the common process of these two groups (not in control A). Accordingly, it seems that the main factor for the CXL-induced corneal thinning is the dehydration effect from the riboflavin solution instead of the UV-A irradiation. 3.3.Time-Series Investigation of CXL EffectAfter completing the CXL procedure, a dynamical morphology change with time occurs and is observed in scattering OCT, phase retardation, and DOPU images. Figure 7 presents a series of tomographic PS-OCT images [Figs. 7(a)–7(i)] of the cornea after the CXL procedure and the averaged depth profiles of each contrast image [Figs. 7(j)–7(l)]. Fig. 7Time-series measurement result of CXL group. Polarization-sensitive OCT (PS-OCT) images in the first, second, and third rows were taken immediately, 1 h, and 2 h after CXL procedure, respectively. (a), (d), and (g) Scattering OCT images, (b), (e), and (h) phase retardation images, and (c), (f), and (i) DOPU images are shown. Scale bars show 1 mm. Bottom row represents depth-profile analysis of the PS-OCT time-series measurement. Averaged depth profiles of (j) normalized intensity, (k) phase retardation, and (l) DOPU are shown. The effective cross-linking depth (2 h after CXL procedure), determined by a DOPU threshold of 0.4, is marked by the black dotted lines. The estimated effective cross-linking depths for 0, 1, and 2 h are displayed by red dashed lines in the scattering OCT images (a), (d), and (g), respectively.  From the scattering OCT images [Figs. 7(a), 7(d), and 7(g)], it can be found that the effective cross-linking region defined in Sec. 3.1 becomes more and more hyperscattering as time passes. From the phase retardation images [Figs. 7(b), 7(e), and 7(h)], the effective region starts to appear with a slow phase retardation increase in depth and exhibits a higher value of phase retardation increase as time progresses (shown more clearly in the averaged depth profile of phase retardation [Fig. 7(k)]. In the DOPU contrast images [Figs. 7(c), 7(f), and 7(i)], pixels with high DOPU values are observed within the effective cross-linking region, in which the density of the high DOPU value pixels increases as time progresses. Figures 7(j), 7(k), and 7(l) show the averaged depth profiles of each contrast image obtained by averaging the A-lines along the B-scan direction [after image flattening with cornea layer segmentation (Sec. 2.4)]. In this study, from the averaged DOPU depth profile [Fig. 7(l)], the DOPU quantity of 0.4 is empirically determined as a global threshold for estimating the effective cross-linking depth that represents the transition between the cross-linking affected and nonaffected regions in the cornea. As an example, the effective cross-linking depth corresponding to 2 h after CXL are estimated as the depth of intersection with the DOPU threshold, and its result is marked by the black dotted line in Figs. 7(j)–7(l). At the estimated effective cross-linking depth, local minimum intensity and phase retardation increase are observed in the averaged depth profile of normalized intensity [Fig. 7(j)] and phase retardation [Fig. 7(k)], respectively. From the scattering OCT images [Figs. 7(a), 7(d), and 7(g)] where the effective cross-linking depth is delineated by red dashed line, it can be found that the estimation result closely matches with the boundary of the effective cross-linking region. 3.4.Time-Series Investigation of ACXL EffectThe standard CXL procedure involves 30 min of UV-A irradiation at an intended irradiance of with a total surface energy dose of (Dresden protocol1). Although the conventional CXL treatment has been demonstrated for its safety and long-term treatment effectiveness in different clinical trials,34–38 its long procedure time lasting from 40 min to 1 h may lead to patient discomfort. According to the photochemical law of reciprocity (Bunsen-Roscoe law),39 it is believed that the photochemical process behind cross-linking depends on the absorbed UV-A energy, and its following biological effect is proportional to the total energy dose delivered to the biological tissue. Based on this physical theory, for accelerating the cross-linking procedure, so called ACXL,40,41 it is possible in principle to achieve an identical biological effect by delivering the same amount of energy dose with a reduced illumination time but increased irradiation UV-A intensity. In this study, the ACXL procedure (10 min UV-A illumination at ), with the same energy dose as standard for 30 min, is carried out and its time-series effect is investigated. Figure 8 presents a series of tomographic PS-OCT images [Figs. 8(a)–8(i)] of the cornea after the ACXL procedure and the averaged depth profiles of each contrast image [Figs. 8(j)–8(l)]. Similar to the standard CXL case, in the scattering OCT images [Figs. 8(a), 8(d), and 8(g)], the effective cross-linking area appears as hyperscattering immediately after the ACXL procedure, and its intensity tends to increase as time progresses. Within the effective cross-linking region, an increase of phase retardation with depth is observed in the phase retardation images [Figs. 8(b), 8(e), and 8(h)], and a distinctive feature in comparison to the rest of the cornea is more clearly provided from the DOPU images [Figs. 8(c), 8(f), and 8(i)]. Fig. 8Time-series measurement result of accelerated CXL (ACXL) group. PS-OCT images in the first, second, and third rows were taken immediately, 1 h, and 2 h after ACXL procedure, respectively. (a), (d), and (g) Scattering OCT images, (b), (e), and (h) phase retardation images, and (c), (f), and (i) DOPU images are shown. Scale bars show 1 mm. Bottom row represents depth-profile analysis of the PS-OCT time-series measurement. Averaged depth profiles of (j) normalized intensity, (k) phase retardation, and (l) DOPU are shown. The effective cross-linking depth (2 h after CXL procedure), determined by a DOPU threshold of 0.4, is marked by the black dotted lines. The estimated effective cross-linking depths for 0, 1, and 2 h are displayed by red dashed lines in the scattering OCT images (a), (d), and (g), respectively.  Figures 8(j), 8(k), and 8(l) show the time-dependent change in the averaged depth profiles of the normalized intensity, phase retardation, and DOPU images, respectively. As with the standard CXL case, a DOPU value of 0.4 in its depth profile [Fig. 8(l)] is set as the threshold for estimating the effective cross-linking depth. The black dotted line in the averaged depth profile of PS-OCT images [Figs. 8(j), 8(k), and 8(l)] represents the effective cross-linking depth 2 h after the ACXL procedure. In the scattering OCT images [Figs. 8(a), 8(d), and 8(g)], the effective cross-linking depths at 0, 1, and 2 h, respectively, determined by the DOPU threshold are also marked by a red dashed line. 3.5.Standard CXL Versus Accelerated CXLAccording to the equal-dose principle, the same cross-linking effect is expected from the two different CXL procedures applied in this study: CXL (30 min UV-A illumination at ) and ACXL (10 min UV-A illumination at ). Although very similar morphological variation aspects are found in both CXL and ACXL procedure results as shown in Secs. 3.3 and 3.4, there is a also perceptible difference in terms of the cross-linking effectiveness between the two CXL procedures. In this study, in order to evaluate the effectiveness, comparison of the effective cross-linking depth is first performed, and its result is shown in Fig. 9(a). As mentioned in Secs. 3.3 and 3.4, the effective cross-linking depth is estimated from the DOPU depth profile by setting the DOPU threshold of 0.4. With the standard CXL procedure, the cross-linking depth is immediately after the procedure, and moderately increases to after 2 h. In the case of the ACXL protocol, the effective cross-linking depth is first observed at and reaches to 2 h after the ACXL procedure. Fig. 9Comparison of collagen cross-linking effect of CXL and ACXL procedures: (a) effective cross-linking depth and (b) mean DOPU value variations with time. 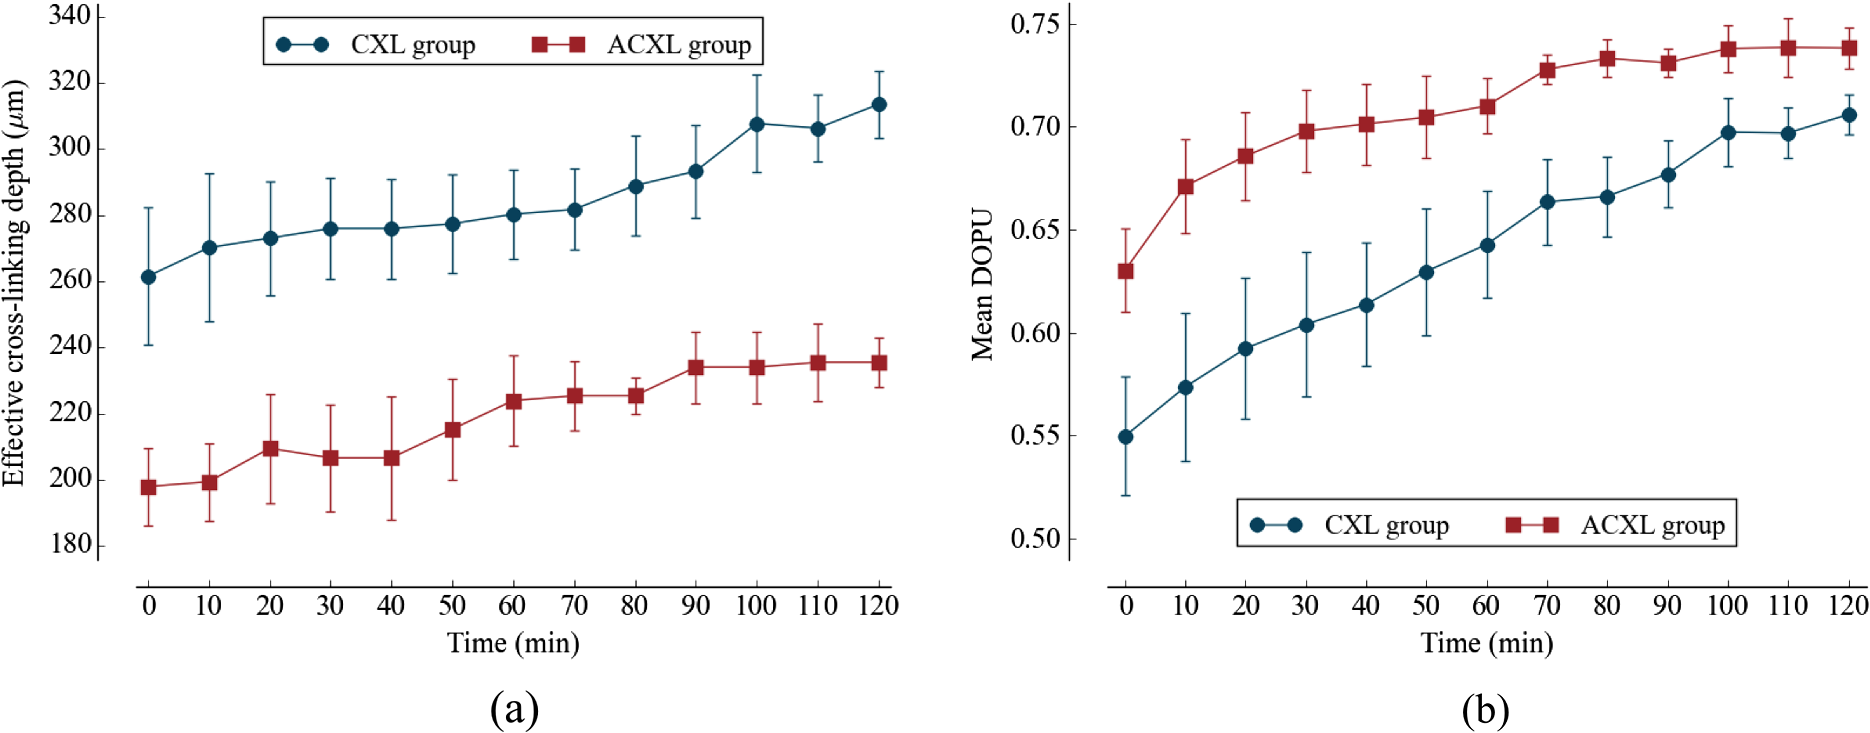 In addition to the effective cross-linking depth, cross-linking effects followed by the two protocols are also examined with respect to the averaged mean DOPU value within the cross-linking region as shown in Fig. 9(b). From the ACXL group, as compared with the CXL group, higher mean DOPU values are observed at the initial and final stages of the time-series measurement. Meanwhile, the CXL group (from to ) shows the more progressive incline aspect than that of the ACXL group (from to ). 4.DiscussionIn this study, an effective cross-linking region is differentiated by PS-OCT. It appears as showing hyperscattering, slow phase retardation change in depth, and a high DOPU value. The effective cross-linking depth can be determined by an empirical DOPU threshold. This depth matches well with the stromal demarcation line reported in the literature.7,18,42–44 Currently, it is believed that the stromal demarcation line observed after the CXL treatment represents the activation of keratocyte followed by the keratocyte repopulation and new collagen synthesis.45 Based on this hypothesis, in general, the stromal demarcation line is regarded as the transition zone between the cross-linked anterior corneal stroma and untreated posterior corneal stroma after CXL treatment. With slit-lamp examination, the stromal demarcation line could be detectable at a depth of as early as two weeks after the CXL procedure.42,43 Using confocal microscopy and AS-OCT, the depth of cross-linking is also detected at a depth of 270 to .7,18,44 In our study, in the case of the standard CXL protocol, the effective cross-linking depth appears at , which corresponds well to the depth of the stromal demarcation line reported previously. Recently, by using confocal microscopy, Dhaliwal and Kaufman46 observed hyper-reflective spherical structures with diameters of 4 to in the anterior of the human cornea immediately after the CXL treatment for up to a depth of . They also identified keratocyte damage (cell shrinking and apoptosis) by histology within the depth in which the spherical structures were visible. The authors stated that the spherical structures might represent damaged cells or cellular fragments. The hyperscattering observed in our scattering OCT image could be regarded as being affected by the hyper-reflective spherical structures. In addition, Bottós et al.12 directly visualized the cross-linking effect using confocal fluorescence imaging. After the CXL procedure, well-organized and densely packed collagen fiber distribution was markedly observed within the limited anterior stroma that was regarded as a cross-linked zone. The change in the phase retardation and DOPU contrasts observed in our study could be explained based on the above reported morphological evidence appearing after the CXL treatment. After the CXL procedure, the organization pattern of the collagen fibers in the anterior stroma changes to denser and more compact, which gives rise to a moderate increase in the cumulative phase retardation image and high uniformity in the DOPU image within the cross-linked region. In our experiments, different cross-linking progress aspects from two different CXL procedures are observed. The effective cross-linking depth is significantly deeper after a 30-min CXL treatment than after a 10-min ACXL procedure. The conventional CXL procedure provides a greater progressive cross-linking effect on the cornea than the ACXL procedure, which is implied by the more rapid and lasting rise of the mean DOPU value with time. Based on these results, it would be possible to infer that the photochemical reaction established by the Bunsen-Roscoe law cannot be directly corresponded to the photobiological effect on complex biological systems. In our study, instead of the intensity threshold based method that is a more straightforward approach in general, an empirical DOPU threshold quantity is used for determining the effective cross-linking depth because DOPU is less affected by SNR and provides high consistency among the samples. In the future, more robust automatic segmentation and quantification of the cross-linking progress with polarization related parameters, such as local birefringence, should be devised in order to find the optimal conditions for maximizing the cross-linking effect with a minimized procedure time. 5.ConclusionIn conclusion, we introduced PS-OCT as a reliable imaging modality in terms of evaluating the outcome of CXL treatment. Using PS-OCT imaging, effective cross-linking depth and cross-linking progression along the time could be determined, which would be able to provide a direct clinical sign to detect the effectiveness of CXL treatment in the future. To date, specific criteria and/or guidelines for achieving maximum cross-linking effect ensuring a long lasting outcome are still unknown. However, we believe it would be possible to find the optimal condition through a mid-long-term clinical study with the proposed method using a PS-OCT system. AcknowledgmentsMyeong Jin Ju is supported by the University of British Columbia (UBC) Four Year Fellowship and the BCFRST Foundation and the British Columbia Innovation Council of Canada. ReferencesG. Wollensak, E. Spoerl and T. Seiler,
“Riboflavin/ultraviolet-A-induced collagen crosslinking for the treatment of keratoconus,”
Am. J. Ophthalmol., 135 620
–627
(2003). http://dx.doi.org/10.1016/S0002-9394(02)02220-1 AJOPAA 0002-9394 Google Scholar
M. Kohlhaas et al.,
“Biomechanical evidence of the distribution of cross-links in corneas treated with riboflavin and ultraviolet A light,”
J. Cataract Refract. Surg., 32 279
–283
(2006). http://dx.doi.org/10.1016/j.jcrs.2005.12.092 JCSUEV 0886-3350 Google Scholar
A. S. McCall et al.,
“Mechanisms of corneal tissue cross-linking in response to treatment with topical riboflavin and long-wavelength ultraviolet radiation (UVA),”
Invest. Ophthalmol. Vis. Sci., 51 129
–138
(2010). http://dx.doi.org/10.1167/iovs.09-3738 IOVSDA 0146-0404 Google Scholar
E. Spoerl, M. Huhle and T. Seiler,
“Induction of cross-links in corneal tissue,”
Exp. Eye Res., 66 97
–103
(1998). http://dx.doi.org/10.1006/exer.1997.0410 EXERA6 0014-4835 Google Scholar
G. Wollensak, E. Spoerl and T. Seiler,
“Stress-strain measurements of human and porcine corneas after riboflavin-ultraviolet-A-induced cross-linking,”
J. Cataract Refract. Surg., 29 1780
–1785
(2003). http://dx.doi.org/10.1016/S0886-3350(03)00407-3 JCSUEV 0886-3350 Google Scholar
G. Wollensak,
“Crosslinking treatment of progressive keratoconus: new hope,”
Curr. Opin. Ophthalmol., 17 356
–360
(2006). http://dx.doi.org/10.1097/01.icu.0000233954.86723.25 COOTEF Google Scholar
C. Mazzotta et al.,
“Treatment of progressive keratoconus by riboflavin-UVA-induced cross-linking of corneal collagen: ultrastructural analysis by Heidelberg retinal tomograph II in vivo confocal microscopy in humans,”
Cornea, 26 390
–397
(2007). http://dx.doi.org/10.1097/ICO.0b013e318030df5a CORNDB 0277-3740 Google Scholar
J. C. Erie,
“Corneal wound healing after photorefractive keratectomy: a 3-year confocal microscopy study,”
Trans. Am. Ophthalmol. Soc., 101 293
–333
(2003). TAOSAT 0065-9533 Google Scholar
I. Perez-Gomez and N. Efron,
“Change to corneal morphology after refractive surgery (myopic laser in situ keratomileusis) as viewed with a confocal microscope,”
Optom. Vis. Sci., 80 690
–697
(2003). http://dx.doi.org/10.1097/00006324-200310000-00010 OVSCET 1040-5488 Google Scholar
R. L. Niederer et al.,
“Age-related differences in the normal human cornea: a laser scanning in vivo confocal microscopy study,”
Br. J. Ophthalmol., 91 1165
–1169
(2007). http://dx.doi.org/10.1136/bjo.2006.112656 BJOPAL 0007-1161 Google Scholar
O. Stachs et al.,
“Structural-functional correlations of corneal innervation after LASIK and penetrating keratoplasty,”
J. Refract. Surg., 26
(3), 159
–167
(2010). http://dx.doi.org/10.3928/1081597X-20100224-01 JRSUEY 0883-0444 Google Scholar
K. M. Bottós et al.,
“Immunofluorescence confocal microscopy of porcine corneas following collagen cross-linking treatment with riboflavin and ultraviolet A,”
J. Refract. Surg., 24
(7), 715
–719
(2008). JRSUEY 0883-0444 Google Scholar
J. M. Bueno et al.,
“Multiphoton microscopy of ex vivo corneas after collagen cross-linking,”
Invest. Ophthalmol. Vis. Sci., 52 5325
–5331
(2011). http://dx.doi.org/10.1167/iovs.11-7184 IOVSDA 0146-0404 Google Scholar
D. W. Piston, B. R. Masters and W. W. Webb,
“Three-dimensionally resolved NAD(P)H cellular metabolic redox imaging of the in situ cornea with two-photon excitation laser scanning microscopy,”
J. Microsc., 178 20
–27
(1995). http://dx.doi.org/10.1111/jmi.1995.178.issue-1 JMICAR 0022-2720 Google Scholar
A. T. Yeh et al.,
“Selective corneal imaging using combined second-harmonic generation and two-photon excited fluorescence,”
Opt. Lett., 27 2082
–2084
(2002). http://dx.doi.org/10.1364/OL.27.002082 OPLEDP 0146-9592 Google Scholar
N. Morishige and N. Teruo,
“Second harmonic generation for visualizing 3-dimensional structure of corneal collagen lamellae,”
Cornea, 28 S46
–S53
(2009). http://dx.doi.org/10.1097/ICO.0b013e3181ae9f37 CORNDB 0277-3740 Google Scholar
F. Aptel et al.,
“Multimodal nonlinear imaging of the human cornea,”
Invest. Ophthalmol. Vis. Sci., 51 2459
–2465
(2010). http://dx.doi.org/10.1167/iovs.09-4586 IOVSDA 0146-0404 Google Scholar
M. Doors et al.,
“Use of anterior segment optical coherence tomography to study corneal changes after collagen cross-linking,”
Am. J. Ophthalmol., 148 844
–851
(2009). http://dx.doi.org/10.1016/j.ajo.2009.06.031 AJOPAA 0002-9394 Google Scholar
B. Cense et al.,
“Thickness and birefringence of healthy retinal nerve fiber layer tissue measured with polarization-sensitive optical coherence tomography,”
Invest. Ophthalmol. Vis. Sci., 45 2606
–2612
(2004). http://dx.doi.org/10.1167/iovs.03-1160 IOVSDA 0146-0404 Google Scholar
M. Miura et al.,
“Imaging polarimetry in age-related macular degeneration,”
Invest. Ophthalmol. Vis. Sci., 49 2661
–2667
(2008). http://dx.doi.org/10.1167/iovs.07-0501 IOVSDA 0146-0404 Google Scholar
E. Götzinger et al.,
“Retinal pigment epithelium segmentation by polarization sensitive optical coherence tomography,”
Opt. Express, 16 16410
–16422
(2008). http://dx.doi.org/10.1364/OE.16.016410 OPEXFF 1094-4087 Google Scholar
M. Pircher et al.,
“Transversal phase resolved polarization sensitive optical coherence tomography,”
Phys. Med. Biol., 49 1257
–1263
(2004). http://dx.doi.org/10.1088/0031-9155/49/7/013 PHMBA7 0031-9155 Google Scholar
M. Yamanari, S. Makita and Y. Yasuno,
“Polarization-sensitive swept-source optical coherence tomography with continuous source polarization modulation,”
Opt. Express, 16 5892
–5906
(2008). http://dx.doi.org/10.1364/OE.16.005892 OPEXFF 1094-4087 Google Scholar
M. Pircher, C. K. Hitzenberger and U. Schmidt-Erfurth,
“Polarization sensitive optical coherence tomography in the human eye,”
Prog. Retin. Eye Res., 30 431
–451
(2011). http://dx.doi.org/10.1016/j.preteyeres.2011.06.003 PRTRES 1350-9462 Google Scholar
M. Pircher et al.,
“Imaging of polarization properties of human retina in vivo with phase resolved transversal PS-OCT,”
Opt. Express, 12 5940
–5951
(2004). http://dx.doi.org/10.1364/OPEX.12.005940 OPEXFF 1094-4087 Google Scholar
M. J. Ju et al.,
“Three-dimensional volumetric human meibomian gland investigation using polarization-sensitive optical coherence tomography,”
J. Biomed. Opt., 19 030503
(2014). http://dx.doi.org/10.1117/1.JBO.19.3.030503 JBOPFO 1083-3668 Google Scholar
E. Götzinger et al.,
“Imaging of birefringent properties of keratoconus corneas by polarization-sensitive optical coherence tomography,”
Invest. Ophthalmol. Vis. Sci., 48 3551
–3558
(2007). http://dx.doi.org/10.1167/iovs.06-0727 IOVSDA 0146-0404 Google Scholar
S. Fukuda et al.,
“Keratoconus diagnosis using anterior segment polarization-sensitive optical coherence tomography,”
Invest. Ophthalmol. Vis. Sci., 54 1384
–1391
(2013). http://dx.doi.org/10.1167/iovs.12-10979 IOVSDA 0146-0404 Google Scholar
D. Alonso-Caneiro et al.,
“Non-invasive assessment of corneal crosslinking changes using polarization sensitive optical coherence tomography,”
Proc. SPIE, 8567 85670F
(2013). http://dx.doi.org/10.1117/12.2002988 PSISDG 0277-786X Google Scholar
F. LaRocca et al.,
“Robust automatic segmentation of corneal layer boundaries in SDOCT images using graph theory and dynamic programming,”
Biomed. Opt. Express, 2 1524
–1538
(2011). http://dx.doi.org/10.1364/BOE.2.001524 BOEICL 2156-7085 Google Scholar
M. J. Ju et al.,
“Advanced multi-contrast Jones matrix optical coherence tomography for Doppler and polarization sensitive imaging,”
Opt. Express, 21 19412
–19436
(2013). http://dx.doi.org/10.1364/OE.21.019412 OPEXFF 1094-4087 Google Scholar
S. Makita, M. Yamanari and Y. Yasuno,
“Generalized Jones matrix optical coherence tomography,”
Opt. Express, 18 854
–876
(2010). http://dx.doi.org/10.1364/OE.18.000854 OPEXFF 1094-4087 Google Scholar
T. Lai and S. Tang,
“Cornea characterization using a combined multiphoton microscopy and optical coherence tomography system,”
Biomed. Opt. Express, 5 1494
–1511
(2014). http://dx.doi.org/10.1364/BOE.5.001494 BOEICL 2156-7085 Google Scholar
F. Raiskup-Wolf et al.,
“Collagen crosslinking with riboflavin and ultraviolet-A light in keratoconus: long-term results,”
J. Cataract Refract. Surg., 34 796
–801
(2008). http://dx.doi.org/10.1016/j.jcrs.2007.12.039 JCSUEV 0886-3350 Google Scholar
A. Caporossi et al.,
“Long-term results of riboflavin ultraviolet A corneal collagen cross-linking for keratoconus in Italy: the Siena eye cross study,”
Am. J. Ophthalmol., 149 585
–593
(2010). http://dx.doi.org/10.1016/j.ajo.2009.10.021 AJOPAA 0002-9394 Google Scholar
C. Wittig-Silva et al.,
“A randomized controlled trial of corneal collagen cross-linking in progressive keratoconus: preliminary results,”
J. Refract. Surg., 24
(7), S720
–725
(2008). JRSUEY 0883-0444 Google Scholar
A. Caporossi et al.,
“Age-related long-term functional results after riboflavin UV A corneal cross-linking,”
J. Ophthalmol., 2011 608041
(2011). http://dx.doi.org/10.1155/2011/608041 JOOPA8 2090-004X Google Scholar
A. Caporossi et al.,
“Riboflavin-UVA-induced corneal collagen cross-linking in pediatric patients,”
Cornea, 31 227
–231
(2012). http://dx.doi.org/10.1097/ICO.0b013e31822159f6 CORNDB 0277-3740 Google Scholar
G. S. Brindley,
“The Bunsen-Roscoe law for the human eye at very short durations,”
J. Physiol. (Lond.), 118 135
–139
(1952). http://dx.doi.org/10.1113/jphysiol.1952.sp004779 Google Scholar
J. Wernli et al.,
“The efficacy of corneal cross-linking shows a sudden decrease with very high intensity UV light and short treatment time,”
Invest. Ophthalmol. Vis. Sci., 54 1176
–1180
(2013). http://dx.doi.org/10.1167/iovs.12-11409 IOVSDA 0146-0404 Google Scholar
H. U. Celik et al.,
“Accelerated corneal crosslinking concurrent with laser in situ keratomileusis,”
J. Cataract Refract. Surg., 38 1424
–1431
(2012). http://dx.doi.org/10.1016/j.jcrs.2012.03.034 JCSUEV 0886-3350 Google Scholar
T. Seiler and F. Hafezi,
“Corneal cross-linking-induced stromal demarcation line,”
Cornea, 25 1057
–1059
(2006). http://dx.doi.org/10.1097/01.ico.0000225720.38748.58 CORNDB 0277-3740 Google Scholar
G. Wollensak et al.,
“Keratocyte apoptosis after corneal collagen cross-linking using riboflavin/UVA treatment,”
Cornea, 23 43
–49
(2004). http://dx.doi.org/10.1097/00003226-200401000-00008 CORNDB 0277-3740 Google Scholar
J. C. Yam, C. W. Chan and A. C. Cheng,
“Corneal collagen cross-linking demarcation line depth assessed by Visante OCT after CXL for keratoconus and corneal ectasia,”
J. Refract. Surg., 28 475
–481
(2012). http://dx.doi.org/10.3928/1081597X-20120615-03 JRSUEY 0883-0444 Google Scholar
G. Wollensak et al.,
“Wound healing in the rabbit cornea after corneal collagen cross-linking with riboflavin and UVA,”
Cornea, 26
(5), 600
–605
(2007). CORNDB 0277-3740 Google Scholar
J. S. Dhaliwal and S. C. Kaufman,
“Corneal collagen cross-linking: a confocal, electron, and light microscopy study of eye bank corneas,”
Cornea, 28 62
–67
(2009). http://dx.doi.org/10.1097/ICO.0b013e31818225c3 CORNDB 0277-3740 Google Scholar
BiographyMyeong Jin Ju is a PhD student at the University of British Columbia and is working on research on functional optical coherence tomography (OCT) and its application to ophthalmology. Currently, he is actively working on an multifunctional OCT system that is capable of performing polarization and Doppler imaging. Shuo Tang is an associate professor at the Department of Electrical and Computer Engineering at the University of British Columbia. His research interest is in biomedical optical imaging systems and devices, including multiphoton microscopy, optical coherence tomography, and micro-endoscopy systems for biomedical applications. |


