|
|
|
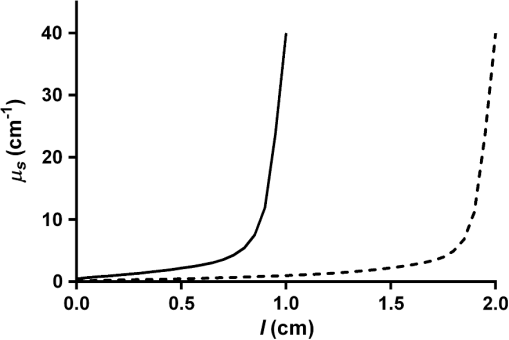
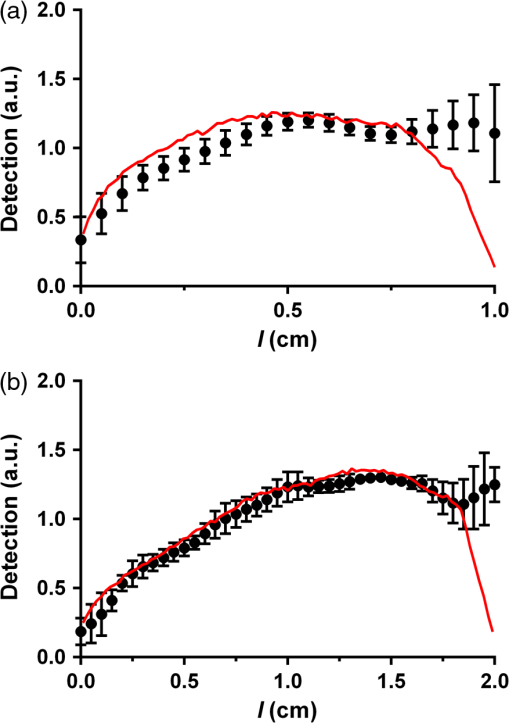
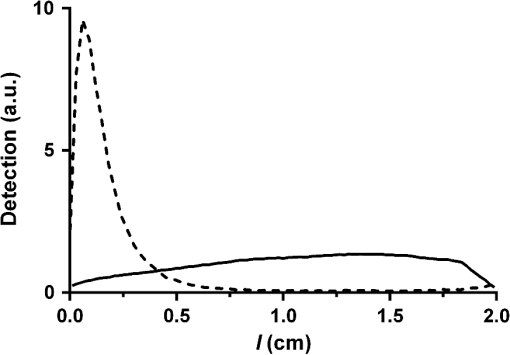
Cylindrical diffusing fibers (diffusers) emit light radially along some portion of the fiber length and are designed to provide uniform irradiance along this length. Many of these fibers are of two main designs, both involving scatterers embedded in the distal portion of the fiber. In the first design, the scatterer concentration is uniform along the diffuser length and a dielectric reflector is positioned at the distal end of the diffuser region.1 The second design does not utilize a reflector, and instead uses a scatterer concentration that increases distally in order to achieve uniform irradiance.2 Previous studies have rigorously characterized the emission behavior of these and other diffuser designs.3,4 One of the main applications for cylindrical diffusers is the delivery of therapeutic light for interstitial photodynamic therapy (iPDT). PDT is a treatment that involves the activation of light-sensitive drugs known as photosensitizers by light of the appropriate wavelength in order to generate reactive oxygen species that lead to the destruction of tissue.5 iPDT refers to the use of PDT in cases where the target tissue is not accessible to off-surface or intraluminal illumination, thus requiring the insertion of cylindrical diffusers for delivery of light. For large tumors, such as those in the prostate,6 arrays of diffusers can be inserted to deliver the desired fluence to the tissue volume, typically on the order of . The region of tissue that receives a therapeutic PDT dose is largely determined by the distribution of fluence and photosensitizer within the target volume. Since the fluence distribution is determined by the tissue optical properties and the photosensitizer has a distinct absorption spectrum, spectroscopic measurements are often performed before and during iPDT sessions. This is typically accomplished by the use of dedicated spectroscopy instruments7 or by the insertion of additional isotropic fibers as sources and detectors.8 These solutions involve the insertion of additional needles into the patient, which lengthens the procedure, places a further burden on the clinician, and increases the risk of bleeding and swelling. It would, therefore, be desirable to perform spectroscopic measurements with the diffusers that have already been inserted for treatment purposes. In order to do this, it is necessary to characterize the detection behavior of these diffusers. Previously, we demonstrated that the detection in diffusers incorporating a dielectric reflector (Model 5901, Pioneer Optics Company, Bloomfield, Connecticut) was axially heterogeneous.9 In this paper, we characterize the axial detection behavior of diffusers that do not incorporate an end reflector (Model 7033, Pioneer Optics Company) and describe a method for determination of the scatterer concentration gradient based on a measurement of the diffuser emission profile. Both the emission and detection axial profiles of three 1- and 2-cm diffusers were measured. To measure the source profile, the diffuser was secured vertically and coupled to a laser source at 665 nm (LDX-3115-665 HHL, LDX Optronics, Inc., Maryville, Tennessee). An isotropic probe (Model IP85, Medlight SA, Ecublens, Switzerland) was attached to a translation stage (430 Series, Newport Corporation, Irvine, California), and coupled to a spectrometer (BTC112E, B&W Tek, Inc., Newark, Delaware). The isotropic probe was placed approximately 1 mm from the diffuser surface and translated parallel to the diffuser axis in 0.5-mm intervals. At each interval, a spectrum was captured with an integration time of 5 to 10 ms. After correcting for integration time, the output at each point was quantified by integrating the detected spectrum from 663 to 667 nm. Due to the performance of the measurements in air and the finite size of the isotropic probe, it is likely that some photons emitted at low angles with respect to the diffuser axis were not detected. For measurement of detection the same process was used, but with the isotropic probe coupled to the laser source and the diffuser connected to the spectrometer. In order to use the measured source profile to determine the scattering gradient within the diffuser, it was assumed that a single scattering event would result in a photon being emitted from the diffuser and that absorption was negligible within the diffusive region. The intensity at any point inside the diffuser can, therefore, be represented using the Beer–Lambert law where is the intensity at a distance from the proximal end of the diffusive region, is the intensity at the proximal end of the diffusive region, and is the scattering coefficient at a particular position in the diffusive region. Since the scatterers in the diffusive region are much smaller than the wavelength and are randomly oriented, we assume that scattering within the diffusive region is isotropic, so is equal to the reduced scattering coefficient, . Based on the assumption of a single scattering event resulting in emission of a photon from the diffuser, the source profile can be related to the derivative of the intensity profile with respect to position The normalized source distribution , where is the length of the diffuser, is used because can only vary from 1 at the proximal end of the diffuser to 0 at the distal end of the diffuser. Using the measured source profile, Eq. (2) was solved using a constrained nonlinear optimization (fmincon, MATLAB®, Mathworks, Natick, Massachusetts) in order to determine for each diffuser, with constrained to be positive. The results of this are shown in Fig. 1. As expected, the calculated profile shows an increasing scatterer concentration with distance from the proximal end of the diffusive region. The maximum value of is equivalent for the two diffuser lengths.Fig. 1Calculated profiles for 1-cm (solid line) and 2-cm (dashed line) diffusers show increasing scatterer concentration with distance from the proximal end of the diffuser.  The calculated profiles were confirmed using a Monte Carlo model of the diffusers which has been previously described.9 For this study, the diffuser model was modified in order to allow for a spatially dependent scattering coefficient within the diffusive medium and to remove the dielectric reflector. The scattering coefficient within the diffuser was represented by breaking the diffusive length into 128 regions, each with an appropriately set scattering coefficient. Standard Monte Carlo collision and boundary handling were then used to govern photon propagation within the diffuser. Simulation of detection was handled by launching photons at random points on the surface of the diffuser cladding inwards toward the diffusive medium at random angles over the full half sphere. Any photons that struck the interface between the proximal end of the diffusive medium and the fiber core within the NA of the fiber () were scored as detected with the axial position at which the photon was launched recorded. Photons that left the diffuser were immediately terminated. For each simulation, photons were launched until 1,000,000 photons were detected in order to achieve a suitable signal-to-noise ratio. Measured and simulated axial detection profiles for 1- and 2-cm diffusers are shown in Fig. 2. The measured data shown are mean values of measurements made on three different diffusers of the same length, with error bars representing standard deviations. As can be seen, there is good agreement between the measured and simulated data. The detection profile is reproducible among diffusers of the same length, as indicated by the relatively small error bars. For both diffuser lengths, detection increases distally until reaching a plateau at roughly half the diffuser length. Fig. 2Measured (dot) and simulated (solid line) detection profiles for (a) 1-cm and (b) 2-cm diffusers. For measured detection profiles, data points are means of measurements performed on three different diffusers and error bars are standard deviation.  The largest deviation between measured and simulated detection occurs within the last 1 mm of each diffuser, and is partially due to reflection occurring at the boundary between the diffusive region and the fiber cladding that is not included in the model described in Eqs. (1) and (2). Another possible source for this difference is in the assumption of single scattering. For a large portion of the diffuser, the calculated scatterer concentration results in a mean free path that is larger than the width of the diffusive medium (0.5 mm), meaning that a single scattering event is likely to result in the photon exiting the fiber. However, at the distal end of this region, the mean free path can be much smaller than the diffuser width, leading to multiple scattering in this portion of the diffuser. As described above, the detection profile of diffusers incorporating a dielectric reflector was previously determined.9 This profile was found to be highly heterogeneous, with the majority of detection occurring in the proximal third of the diffusive region. For the diffuser design examined in this study, the detection profile was found to be more homogeneous, with detection shifted distally. A comparison between simulated detection profiles for 2-cm diffusers using these two designs is shown in Fig. 3. Since axial detection can vary largely between diffuser models, it is, therefore, important to determine the detection behavior of a particular diffuser model before using the diffuser as a detector. As shown in Fig. 2, variability among individual diffusers with the same design is relatively small. Therefore, it should not be necessary to measure the detection profile of each individual diffuser, but only a representative sample from a particular model. Fig. 3Comparison of simulated detection profiles for diffusers with a scatterer gradient and without a dielectric reflector (solid line) versus diffusers with a dielectric reflector and constant scatterer concentration (dashed line). The solid line represents the simulation results presented in this paper, while the dashed line represents the simulation results from Baran and Foster.9  The goal of performing optical measurements using cylindrical diffusers as sources and detectors is to be able to determine optical properties and photosensitizer concentration for iPDT using the treatment fibers. This would reduce clinical complexity and risk for the patient, while providing the information required for accurate treatment planning and monitoring. In situations utilizing arrays of diffusers, one diffuser would act as a source and the other diffusers would act as detectors. Using these spatially resolved measurements and the models of diffuser emission and detection behavior described here and elsewhere,9,10 it is hypothesized that information about tissue optical properties could be extracted. This will require careful characterization of the effects of the tissue refractive index on diffuser detection behavior and will be examined in future studies. A single diffuser could also act as both a source and detector for performing fluorescence spectroscopy. We have previously demonstrated recovery of intrinsic fluorescence from a measurement made using a single spherical isotropic fiber as both source and detector by application of a forward adjoint model.11 By combining this forward adjoint model with the source and detector profiles demonstrated here, we suggested that a single diffuser scheme could be used to determine fluorophore concentration in the region surrounding the diffuser. This would be particularly useful in the determination of photosensitizer concentration, as most photosensitizers are fluorescent.12 AcknowledgmentsThis work was supported by the NIH Grants CA68409 and CA55791 awarded by the National Cancer Institute. The author would like to thank Dr. Thomas Foster for helpful discussion and a careful review of this paper. ReferencesL. H. P. Murrer, J. P. A. Marijnissen and W. M. Star,
“Light distribution by linear diffusing sources for photodynamic therapy,”
Phys. Med. Biol., 41 951
–961
(1996). http://dx.doi.org/10.1088/0031-9155/41/6/001 PHMBA7 0031-9155 Google Scholar
L. M. Vesselov, W. Whittington and L. Lilge,
“Performance evaluation of cylindrical fiber optic light diffusers for biomedical applications,”
Lasers Surg. Med., 34 348
–351
(2004). http://dx.doi.org/10.1002/(ISSN)1096-9101 LSMEDI 0196-8092 Google Scholar
P. Agostinis et al.,
“Photodynamic therapy of cancer: an update,”
CA Cancer J. Clin., 61 250
–281
(2011). http://dx.doi.org/10.3322/caac.v61:4 CAMCAM 0007-9235 Google Scholar
H. Patel et al.,
“Motexafin lutetium-photodynamic therapy of prostate cancer: short- and long-term effects on prostate-specific antigen,”
Clin. Cancer Res., 14 4869
–4876
(2008). http://dx.doi.org/10.1158/1078-0432.CCR-08-0317 CCREF4 1078-0432 Google Scholar
T. M. Baran, M. C. Fenn and T. H. Foster,
“Determination of optical properties by interstitial white light spectroscopy using a custom fiber optic probe,”
J. Biomed. Opt., 18
(10), 107007
(2013). http://dx.doi.org/10.1117/1.JBO.18.10.107007 JBOPFO 1083-3668 Google Scholar
T. C. Zhu, J. C. Finlay and S. M. Hahn,
“Determination of the distribution of light, optical properties, drug concentration, and tissue oxygenation in-vivo in human prostate during motexafin lutetium-mediated photodynamic therapy,”
J. Photochem. Photobiol. B, 79 231
–241
(2005). http://dx.doi.org/10.1016/j.jphotobiol.2004.09.013 JPPBEG 1011-1344 Google Scholar
T. M. Baran and T. H. Foster,
“New Monte Carlo model of cylindrical diffusing fibers illustrates axially heterogeneous fluorescence detection: simulation and experimental validation,”
J. Biomed. Opt., 16
(8), 085003
(2011). http://dx.doi.org/10.1117/1.3613920 JBOPFO 1083-3668 Google Scholar
A. Dimofte et al.,
“Determination of optical properties in heterogeneous turbid media using a cylindrical diffusing fiber,”
Phys. Med. Biol., 57 6025
–6046
(2012). http://dx.doi.org/10.1088/0031-9155/57/19/6025 PHMBA7 0031-9155 Google Scholar
T. M. Baran and T. H. Foster,
“Recovery of intrinsic fluorescence from single-point interstitial measurements for quantification of doxorubicin concentration,”
Lasers Surg. Med., 45 542
–550
(2013). http://dx.doi.org/10.1002/lsm.22166 LSMEDI 0196-8092 Google Scholar
B. C. Wilson and M. S. Patterson,
“The physics, biophysics and technology of photodynamic therapy,”
Phys. Med. Biol., 53 R61
–R109
(2008). http://dx.doi.org/10.1088/0031-9155/53/9/R01 PHMBA7 0031-9155 Google Scholar
|

