
|
|
1.IntroductionAlthough noninvasive blood glucose prediction using near-infrared (NIR) spectroscopy has been studied for many years at various companies and research laboratories in the world, there is no medical device approved by the Food and Drug Administration of the United States at present.1–3 One of the technical problems is that the glucose signal contained in the NIR reflection spectra from living tissue is significantly small compared to the signals of other components in living tissue, such as water, protein, fat, etc.4,5 Therefore, it is very difficult to prevent many kinds of disturbances (caused by the changes in the contents of the components other than glucose) from being present in the measured spectra and also very difficult to secure a prediction accuracy sufficient for clinical applications. It is common that NIR spectroscopy for noninvasive blood glucose prediction applies chemometrics, which uses multivariate analyses to obtain calibration models. Generally speaking, in chemometrics, a researcher should collect spectra as many as times possible with pre-experiments, and a set of the spectra must contain various disturbances covering wide ranges of their changes. Then the set of the spectra is used for a multivariate analysis to obtain a robust and accurate calibration model.6 However, collecting spectra as many times as possible for that purpose adversely impairs the building of a good calibration model for accurate prediction. In particular, for blood glucose prediction, due to the poor signal-to-noise ratios of the measured spectra against the variation of glucose content, which is essentially very small in tissues, the measureable number of disturbances and the measurable ranges of their changes are limited. Then, to reduce the number of disturbances, many researchers have tried to measure spectra under constrained or controlled conditions, such as building calibration models for individuals, improving the reproducibility of the positioning of sensors, controlling the skin temperature, etc.7,8 Multivariate analyses enable us to automatically and easily build calibration models that predict an objective variable by removing the influences of the disturbances. However, when the calibration models built by multivariate analyses are used, the processes to predict the blood glucose contents from measured NIR spectra are so-called black boxes. Therefore, many of the former studies using multivariate analyses have reported only the prediction accuracy of the blood glucose content, and have not evaluated the results from a spectroscopic point of view with consideration of the glucose signals or disturbances contained in the measured NIR spectra. As a result, unfortunately, trial and error studies with concepts or methods similar to those already found to be unsuccessful by former studies have been repeatedly conducted. This fact might be one of the reasons for the delayed realization of noninvasive blood glucose prediction by NIR spectroscopy. Arnold et al.9 applied a net analyte signal (NAS) method to noninvasive NIR glucose prediction for evaluation of glucose signals and disturbances contained in the measured spectra. They obtained NIR transmission spectra by in vivo experiments using rats and by in vitro experiments using aqueous glucose solutions in the wavelength range from 2040 to 2380 nm and predicted the glucose contents from the spectra. They showed that the calculated NAS vectors agreed well with the regression vectors obtained from the partial least squares (PLS) analysis which correctly predicted glucose content, and they concluded that analysis of the regression vectors could provide valuable insights into the chemical basis of selectivity for multivariate calibration models. Alexeeva and Arnold10 made a heterogeneity distribution map of the ingredients contained in rat skin tissue, i.e., water, collagen, fat, keratin, etc., by a microspectroscopy technique measuring NIR transmission spectra in the wavelength range from 2040 to 2380 nm. They concluded that such a heterogeneity resulted in a significant disturbance for the blood glucose prediction and that appropriate corrections were needed to reduce the influence of tissue heterogeneity for accurate noninvasive glucose prediction in the future. Maruo et al.11,12 proposed a unique method for building a calibration model from NIR diffuse reflectance spectra obtained numerically by a Monte Carlo simulation using the absorption and scattering coefficients of living tissues. Their method made it possible to arbitrarily numerically incorporate the disturbances into the spectra by properly adjusting the optical properties according to the changes in the contents of tissue components and other disturbing factors. They generated a total of 64 NIR diffuse reflectance spectra of human skin in the wavelength range from 1400 to 1850 nm by changing the glucose, water, fat, and protein contents as well as the scattering coefficient and temperature in the skin. A calibration model for noninvasive blood glucose prediction was built by a multivariate analysis from the 64 spectra, and the performance of this method was examined with clinical measurements. It is suggested that the major factors disturbing the spectra were water, fat, protein, scattering, and temperature changes in the skin tissue. Toward the realization of noninvasive glucose prediction, we believe that the origins and magnitudes of the disturbances contained in the measured spectra should be understood and that the disturbances should be removed by calibration models obtained by multivariate analysis, or by controlling the measurement conditions, or by other methods. The purpose of this study is to develop a method that can clearly show the process of predicting the blood glucose contents from measured spectra for understanding the origins and magnitudes of the disturbances and which can successfully trace and predict the changes in the blood glucose content. The blood glucose prediction method developed in this study is similar to the methods based on the conventional classical least squares (CLS) method,13 and is summarized in the following. NIR absorbance spectra are obtained periodically from the reflectance spectra measured at the fixed measurement position of human skin irradiated by NIR light. Then, the absorbance difference spectra are calculated by subtracting the basis absorbance spectrum, which is the first absorbance spectrum measured at the beginning of measurement, from the measured absorbance spectra obtained every 5 min. Using the modified Beer’s law,14 we assume that the absorbance difference spectra can be synthesized by a linear combination of NIR absorption spectra of four components in the skin tissue (water, protein, glucose, and fat) and scattering equivalent absorption (so-called baseline15) component, and we can obtain the temporal changes in the contents of the components by solving the linear equations for five wavelengths characteristic to the five components. The temporal changes in the glucose content in the skin have been found to reflect the temporal changes in the glucose content in the blood with a time delay of about several minutes.16,17 Therefore, the temporal changes in the glucose content obtained above are expected to trace the temporal changes in the blood glucose content, but the results show failures. The reasons for the failures can be partly attributed to the changes in the scattering property in the skin after attaching the probe on the skin and to the difficulty of separating the glucose and baseline components. In order to incorporate the gradual changes in the scattering property during measurement in real time and to separate the glucose and baseline components, we develop a new approach to introduce a temporally varying imaginary component, which combines and replaces the baseline and fat components. The obtained changes in the glucose contents successfully trace and predict the changes in the blood glucose contents. In Sec. 1, the background and purpose of this study are described, and the method proposed in this study is summarized. In Sec. 2, the prediction method, which is a simple application of the standard CLS method based on the modified Beer’s law, is formulated by considering the five components (water, protein, glucose, fat, and baseline), and the experimental setup and data acquisition are explained. Then the results using the five components are described and the reasons for the failures of the prediction are explained. In Sec. 2.2, the imaginary component is introduced, and the results using the imaginary component are described and show the success in prediction. Sections 3 and 4 give discussion and conclusions, respectively. 2.Methods Based on the Modified Beer’s Law2.1.Formulation of the Blood Glucose PredictionBased on the modified Beer’s law, we first define three dimensionless quantities, i.e., the absorbance difference spectrum (expressed as the absorbance difference or the difference spectra for simplicity where it is understood without confusion), , the absorption spectrum of component , , and the content index of component , , where and are the wavelength and time after the start of the measurement, respectively. Appendix A gives the detailed derivations of the three quantities and the relationship among them, Eq. (15), which is rewritten below as Eq. (1), meaning that is synthesized (or constructed) by the sum of the products of and the difference in , Δ, over the components of concern In this study, a total of five components (water, glucose, protein, fat, and baseline) are chosen to synthesize the absorbance difference spectra. The methods at determining of the five components are given in Appendix B, and Fig. 1 shows of the five components. The baseline component, which is the scattering equivalent absorption spectrum, is one of the key components in this study. In our previous study, we created diffuse reflectance spectra from a Monte Carlo simulation of light propagation in the skin tissue and built a calibration model from these spectra using a PLS analysis.11 Six components that influenced the spectra were chosen in the simulation, and five of them are also chosen in this study. One component that is not used in this study is temperature. During the experiments conducted in this study, the skin temperature was controlled and kept at by fixing the optical probe to the skin surface by an adhesive tape as explained in Sec. 2.2, while in the previous study, the probe was attached to the skin surface by pushing at each spectral measurement.12 Thus, temperature is excluded from the disturbance components to reduce the number of disturbances for a better demonstration of the method in this study. Fig. 1Absorption spectra, , of the four components in living tissues and baseline for synthesizing the absorbance difference spectra. 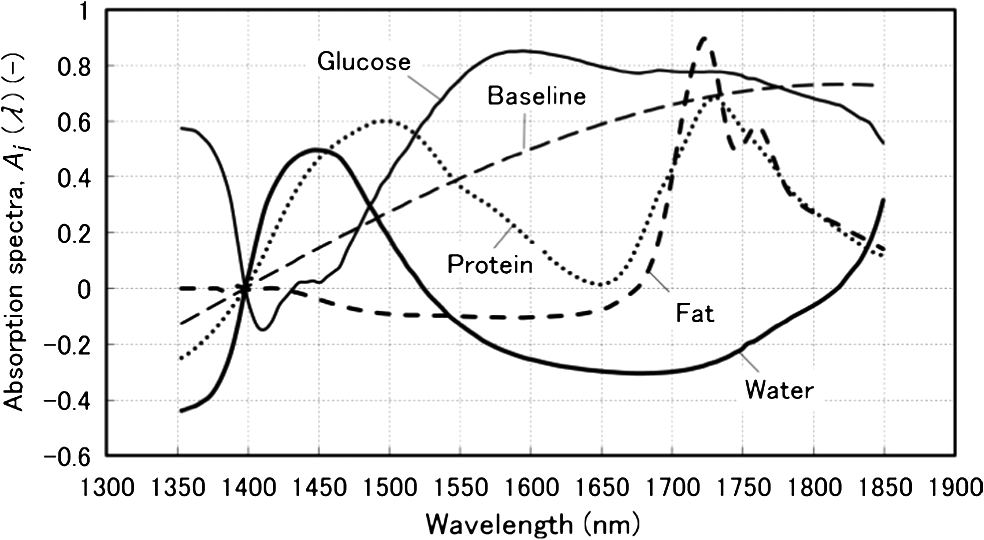 Equation (1) is applied at the five characteristic wavelengths of the five components to obtain a set of simultaneous equations, Eq. (2): where the subscripts of and , i.e., , , , , and , indicate water, protein, glucose, baseline, and fat, respectively. The characteristic wavelengths of the four tissue components are selected at their absorption peaks of 1450 nm for water, 1510 nm for protein, 1600 nm for glucose, and 1727 nm for fat, respectively. For the baseline, that has no absorption peak, we have selected 1650 nm for the reason that the influences of water, protein, and fat on the measured spectral changes would be relatively small at , where absorption by these components is weak.By solving Eq. (2), the unknowns, , , , , and , are obtained as Eq. (3): There are several reasons why we do not use the measured spectra fully over the whole wavelength range but use only the characteristic wavelengths: (1) the relation between the difference spectra and the quantities associated with the components is intuitively understood, (2) numerical calculation of Eq. (3) is easy, (3) the differences between the results using the full spectra and those using the characteristic wavelengths are found to be very small from our experiences, and (4) using only several wavelengths is more practical than using the full spectra toward the realization of noninvasive blood glucose monitoring devices. The absolute values of the contents of the components cannot be obtained because the modified Beer’s law includes unknown light path lengths in the skin, but the temporal changes in the contents of the components relative to those at the beginning can be obtained. The predicted blood glucose content, , is obtained by Eq. (4) from the change in the glucose content index, , using a conversion factor, , and the measured (true) initial blood glucose content, 2.2.ExperimentsWe have developed a new diffuse reflectance spectroscopic instrument to measure the NIR reflectance spectra from the human skin. Figure 2 shows a schematic diagram of the instrument, which consisted of a 150-W halogen lamp light source (TYPE 6550, Philips, Netherlands), an optical fiber bundle that included both source and detector fibers (cladding diameter , core diameter , NA 0.2, Fujikura, Japan), and a compact spectrometer containing a grating and a 256-channel linear-array photodetector (C9914GB, Hamamatsu Photonics, Japan). The optical signals from the spectrometer were transferred to a computer (Let’s Note, Panasonic, Japan) to be processed for prediction of the blood glucose contents. The source and detector optical fibers were combined to make a single optical fiber bundle with a probe that had a cylindrical shape of 20 mm diameter and 8 mm length. Figure 2(a) shows the arrangement of the optical fibers at the end plane of the probe, where 12 source fibers surrounded one detector fiber in a circle with a radius of . The temperature of the interface between the probe and the skin surface was proportional-integral-differential controlled to be kept at with a ribbon heater and a thermocouple attached to the probe. Light from the halogen lamp was collected by a concave mirror and transmitted through the source fibers to irradiate the skin. Then diffusely reflected light that reached the detector fiber was transmitted to the spectrometer. The reflected light intensity from a standard reflectance target, defined in Eq. (10), was measured by irradiating a standard 10% reflectance target (Labsphere, USA) at the beginning of the experiment. The spectra from 1350 to 1850 nm with a wavelength step of were used for data processing. The accumulation time of each linear-array photodetector was 140 ms, and 288 spectra were averaged per measurement to obtain one spectrum. The quality of the spectra was also assessed by measuring spectra every 5 min over the period of 120 min and by conducting a root-mean-square (rms) noise analysis of 100% lines on the collected data. Results showed that the average rms of the 100% line was , which we predicted was sufficient for the purpose of predicting the blood glucose contents.18 Fig. 2(a) Arrangement of the source and detector optical fibers at the probe end and (b) schematic diagram of the experimental setup. 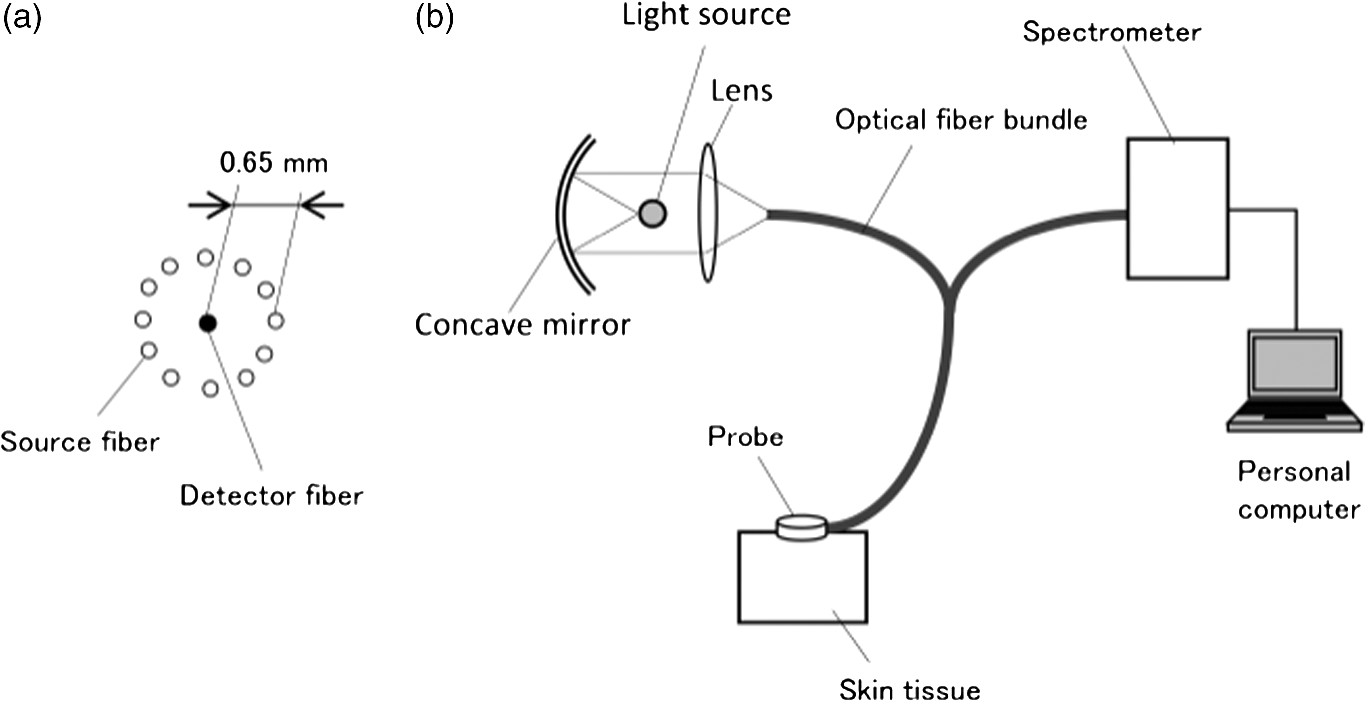 True blood glucose contents and NIR diffuse reflectance spectra were measured continuously during the experiment in which blood glucose contents were changed artificially by oral glucose intake. True blood glucose contents were measured by using a portable blood glucose meter (DIA meter, Arkray, Japan) from a blood drop obtained by puncturing a fingertip every 15 min. The optical probe for spectral measurement was attached on the inside skin surface of the left forearm of a subject by a medical double-sided adhesive tape, and the NIR diffuse reflectance spectra were measured every 5 min during the experiment. A 200 ml of liquid-type nutrition food (Calorie Mate, Otsuka Pharmaceutical Co., Ltd., Japan) containing carbohydrates, 10 g protein, and 4.5 g lipid was used for oral glucose intake. Each measurement was taken before glucose intake, and after glucose intake. The subject was a healthy man in his fifties and was kept seated calmly on a chair with a natural posture. His left forearm was horizontally placed on a soft pad without fixation, and he was encouraged to move as little as possible. No remarkable motion was observed during the measurement. Because the measured difference spectra were unstable immediately after the optical probe was attached to the forearm, spectral measurements started 30 min after attaching the probe when the measured absorbance difference spectra became stable. The first measured absorbance spectrum was used as the basis spectrum, defined in Appendix A. Measurements of the true blood glucose contents every 15 min started immediately after attaching the probe, so the third true blood glucose content and the first absorbance spectrum were measured at almost at the same time. The experiment was approved by the ethical committee of the company where the first author worked. 2.3.Results Using Five ComponentsMeasured and synthesized difference spectra, , are shown in Fig. 3. Figure 3(a) plots 40 spectra of measured every 5 min, and it is seen that the measured increases with the increase in time to depart from the axis, . Figure 3(b) plots 40 spectra of synthesized from the calculated of the five components using the measured in Fig. 3(a) and Eq. (3). It is seen that the shapes of the synthesized in Fig. 3(b) agree well with those of the measured ones in Fig. 3(a). The change in the glucose content index, , and the true blood glucose content, , are plotted in Fig. 4. From the good agreement between the measured and synthesized , it is expected that the profile of would trace that of , but it does not, as is shown in Fig. 4. Fig. 3Absorbance difference spectra obtained by (a) measurement, (b) synthesis using the five components, and (c) synthesis using the four components including the imaginary component.  Fig. 4Time series of the glucose content indices (left ordinate) and the true blood glucose contents (right ordinate) when using the five components.  Not only in the experiment stated above, but also in other oral glucose intake experiments, similar disagreements between the profiles of and were observed although good agreements between the measured and synthesized were obtained. Resultantly, we conclude that it is difficult to predict the blood glucose contents correctly by a simple calculation of Eq. (3), which considers the five components of water, protein, glucose, fat, and baseline. From these results, we hypothesize the following:
Now we propose a method in the next section to solve the problems described above so as to separate the glucose and baseline contributions in the measured , and to simultaneously incorporate the gradual change in scattering in the skin by introducing an imaginary component. 3.Introducing an Imaginary Component and Results3.1.Separation of Glucose Contributions from the Baseline and Fat Contributions in the MeasuredBefore introducing an imaginary component, the glucose contribution in the measured at the characteristic wavelength of baseline must be separated to solve the problem stated above. The separation can be conducted by utilizing the differences in the temporal response between the glucose and baseline components. While the probe is attached on the skin by a medical double-sided adhesive tape with a very small contact pressure, the contribution of baseline increases monotonically and slowly during the measurement period of . On the other hand, the blood glucose contents of healthy people increase during the period of after oral glucose intake and then decrease in the following period of to return to the initial values with some variations among individuals. This difference in the temporal response suggests the possibility of a separation of the contributions of glucose and baseline by temporal averaging of at , where the absorption spectra of both glucose and baseline have large values and influence each other. The proposed averaging process is as follows. The time series of are given by measurements every 5 min from to (; ), and the difference between and is denoted as . Then, at each measurement time, , the average, , is given by Eq. (5): Figure 5 shows an example of the time series of and . In this experiment, the measurement started at and oral glucose intake was done at . In the time series of , there exists a rise beginning at and a drop beginning at , which are added to the monotonic increase with time, suggesting the change in the blood glucose content by the oral glucose intake. On the other hand, the time series of does not show the rise and drop after the oral glucose intake, but increases monotonically, suggesting that mainly reflects the temporal change in the baseline component. Thus, the contributions of the glucose and baseline components are considered to be separated to some extent. At the characteristic wavelength of fat, , glucose also has strong absorption, and it is necessary to reduce the contribution of glucose in the measured . This is made by taking the difference in between and , with denoting because glucose has a strong absorption at similar to that at . Again, is averaged in the same manner as Eq. (5) to further reduce the contribution of glucose by Eq. (6): The time series of and are also plotted in Fig. 5, and it is seen that the contribution of glucose is reduced in , which reflects the change in the fat component to some extent, although it is not clearly as seen as . 3.2.Introducing an Imaginary Component with Creation of Its SpectrumDuring the measurement period of , it is reasonable to assume that the fat content in the skin tissue does not change. Therefore, we suppose that the large growth of the peak at appearing in shown in Fig. 3(a), which is assigned as a fat absorption peak, is not due to the increase in the fat content in the skin, but due to the increase in the light intensity propagating in the subcutaneous layer, which contains fat with a larger content than in the skin. The increase in the light intensity in the subcutaneous layer is understood to be caused by the decrease in the scattering coefficient of the stratum corneum and epidermis. Attaching the probe to the skin surface would reduce evaporation of moisture from the skin surface and would increase the water content in the stratum corneum and epidermis. The increase in the water content causes the decrease in the scattering coefficient because the difference in the refractive index between the cells and intercellular liquid decreases. The decrease in the scattering coefficient in the stratum corneum and epidermis makes more light propagate in the subcutaneous layer. From another point of view, because baseline is an expression of wavelength dependency of scattering by the skin with the equivalent absorption, the decrease in the scattering coefficient in the stratum corneum and epidermis causes the decrease in the reflected light intensity, which means the increase in the absorption of baseline. As a result, contributions of both the fat and baseline components, and , to increase with the decrease in scattering in the stratum corneum and epidermis. Now we introduce an imaginary component with a content index of and an absorption spectrum of , respectively. Here, varies with time, and at time , it is created by adding the absorption spectra of baseline and fat, and , to the weights of and , respectively, as in Eq. (7): Equation (7) is more or less heuristically obtained, but there are some rationales. Combining the absorption spectra of baseline and fat comes from the fact that the changes in both the baseline and fat components originate from the changes in scattering in the skin. By combining them, it is possible to consider only one component, which is dependent on scattering in the skin. By weighing them with the averaged quantities of and , it is possible to incorporate the intensity (or significance) of the baseline and fat components in the imaginary component at each measurement time, respectively. Note that the absorption spectra of baseline and fat, and , are independent of time, while the absorption spectrum of the imaginary component, , is dependent on time so that the imaginary component can reflect the gradual change in scattering in the skin after attaching the probe on the skin. Using the imaginary component that combines and replaces the baseline and fat components, Eq. (1) for the characteristic wavelengths of the four components, i.e., water, glucose, protein, and imaginary, are obtained as Eq. (8) and solved for the content indices of the four components as Eq. (9): Here, the subscript of time, , is omitted for simplicity, and the characteristic wavelength of the imaginary component is selected as 1727 nm, which is the same as that of fat. The characteristic wavelength of baseline, 1650 nm, is closer to that of glucose, 1600 nm, and better results are expected with the wavelength of 1727 nm farther from the characteristic wavelength of glucose. 3.3.Results Using the Imaginary ComponentThe changes in the content indices of the four components, , are obtained using Eq. (9) from the measured data used in Sec. 3, and the absorbance difference spectra, , are synthesized by substituting the obtained into Eq. (8), as plotted in Fig. 3(c). The time series of the change in the glucose content index, , is compared with that of the true blood glucose content, , in Fig. 6. Again, the synthesized spectra using the imaginary component in Fig. 3(c) agree well with the measured ones in Fig. 3(a), even if the number of components is reduced from five to four. The change in the glucose content index, , traces the change in the true blood glucose content, , in Fig. 6 showing the rise and fall during the oral glucose intake, while in Fig. 4, did not trace well. Using Eq. (4), in Fig. 6 is converted to the predicted blood glucose contents, , with the conversion factor, , and is compared with , the true blood glucose content, in Fig. 7 after shifting by 5 min to earlier times due to the time delay. The value of was determined from the results of several experiments conducted in advance. The correlation coefficient of the predicted and true blood glucose contents is 0.93 and the standard error of prediction (SEP) is . The synthesized using the imaginary component shown in Fig. 3(c) is only slightly different from those without using the imaginary component shown in Fig. 3(b). But, only a slight difference in the synthesized spectra leads to a significant improvement in the prediction of the blood glucose contents from Fig. 4 to Figs. 6 and 7, thus demonstrating the good performance of the approach using the imaginary component. Fig. 6Time series of the glucose content indices (left ordinate) and the true blood glucose contents (right ordinate) when using the four components including the imaginary component.  Another type of the temporal development of different from that showing the growth at in Fig. 3 is also examined. That type shows a large growth at , which is the characteristic wavelength of water, and 40 measured are plotted in Fig. 8(a). While shows a large increase, at the characteristic wavelength of glucose shows a decrease. Figure 8(b) shows the synthesized calculated from the solutions of Eq. (9) using the four components, and the shapes of the synthesized are very similar to those of the measured in Fig. 8(a). The calculated are converted to with , and Fig. 9 compares with after shifting for compensation of the 5-min time delay. In this case, the true initial blood glucose content, , was , which should have been used in Eq. (4). However, the predicted glucose content, , decreased rapidly from the beginning of the spectral measurement to the time of the oral glucose intake, while the true blood glucose content, , remained constant during that period. As a result, significantly deviated from . In this case, () in Eq. (4) is replaced by () so that is equal to at 11:40, the time of the oral glucose intake. As shown in Fig. 9, agrees well with after the oral glucose intake. The disagreement in the early period has to be investigated and solved in the future. The correlation coefficient and SEP for the whole period are 0.56 and . 4.DiscussionFrom this study, it is found that the difficulty in predicting the blood glucose content from the reflectance measurements mainly originates from the change in baseline (the change in scattering in the skin) and from the similarity of the absorption spectra between glucose and baseline. Their influences are reduced by introducing the imaginary component. In the process of introducing the imaginary component, the difference in the time response between the glucose content and scattering (baseline) is used to separate their contributions to the measured . By creating the absorption spectrum of the imaginary component, the performance of predicting the blood glucose contents is significantly improved. In other words, utilizing temporal information in addition to intensity information in the measured spectra greatly improves the prediction performance. Because the imaginary component is created using the absorbance difference spectra measured at the fixed position on the skin sequentially from the start of measurement to the time of concern, it reflects the gradual changes in scattering in the skin irrespective of the differences in individuals, measurement positions, seasons, etc. Therefore, the method using the imaginary component is appropriate for real-time prediction of blood glucose contents. However, the four components including the imaginary component are not necessarily universal for all cases as demonstrated by the failure shown in Fig. 9. Therefore, other key components must be found by further developments of the approach proposed in this study toward the clinical use of NIR noninvasive blood glucose monitoring. Instead of introducing the imaginary component, which combines and replaces the baseline and fat components, modification of the absorption spectra of baseline and fat by multiplying the temporal averages, such as and , respectively, may be another choice for separating the glucose contributions and for incorporating the scattering changes. In this case, the number of the components is kept at five, and the results of the synthesized and may provide more information for improving the prediction. More appropriate modifications than the method proposed in this study may be possible and developed in future studies. Conventional methods using multivariate analyses, such as principal component regression and PLS, also utilize temporal information. However, in the case where there exist some components that occasionally correlate with the blood glucose content, there is the possibility of a so-called chance temporal correlation,19 because the calibration models are built after the whole measurement data are obtained. On the other hand, the method proposed here calculates the glucose content index from the absorbance difference spectra at every measurement time (every 5 min) and predicts the blood glucose content independent of the measurements after the measurement at that time of concern. So the possibility of chance temporal correlation is very small in the proposed method. Because the temporal averaging used in this study presumes the time response of the blood glucose content for healthy people, it will be necessary to study further for application to diabetes patients, who might have time responses different from healthy people. Better methods other than the temporal averaging used in this study will also be possible because its purpose is to remove the influences of the glucose contributions from the measured and at the characteristic wavelengths of baseline and fat, respectively. It is well known that the influence of baseline can be reduced by pretreatment of the measured spectra such as differentiation and multiplicative scatter correction. Former studies of the quantification of blood glucose content in living bodies20 and in red blood cell products21 reported that the performances of the quantification were improved by the pretreatment. Introducing the imaginary component to replace baseline may be similar to the pretreatment in the former studies. In the two experiments described in this study, we used the conversion factor, , for predicting from . The glucose content index is given as , and the conversion factor, , can be determined from the measured glucose content, , and the standard glucose content, . However, because it is difficult to estimate the value of the standard glucose content, , the conversion factor, , was empirically determined by comparing the change in the true blood glucose content with the change in the glucose content index. Although it is difficult to determine the value of , the value is constant, and it is reasonable to use the same conversion factor consistently. Good results of predicting the blood glucose content after the oral glucose intake in the two experiments using the same conversion factor illustrate the description above. In CLS methods that are similar to our method, it is generally understood that estimation of the number of components for synthesizing spectra is very important, and that correct numbers of the components provide accurate predictions, while incorrect numbers of the components with unexpected disturbances lead to inaccurate predictions. Therefore, the large prediction errors from the beginning of the experiments to the oral glucose intake in Fig. 9 are thought to be caused by unexpected disturbances contained in the measured spectra. By attaching the probe to the skin surface, the increase in the water content and smoothing in the cell shape in the stratum corneum and epidermis drastically and simultaneously take place, especially at the beginning of the probe tip attachment. The large growth of the water absorption peak around in shown in Fig. 8 indicates that some phenomena related to water are attributed to the large prediction errors shown in Fig. 9. In this study, it is assumed that the effective optical path length, , does not depend on the wavelength, , but actually increases with the increase in the wavelength because depends on the scattering coefficient similar to baseline. According to numerical simulation of light propagation in the skin, increases from 1.2 to 2.0 mm as the wavelength increases from 1350 to 1800 nm when the distance between the source and detector fibers is 0.65 mm.22 It will be possible to incorporate this wavelength dependency of in a future study. In contrast to the methods using multivariate analyses, the proposed method based on the modified Beer’s law does not build a calibration model, which needs many premeasurement data in advance, but needs only the absorption spectra of the components in living tissues and baseline. This feature of the proposed method will be very useful for the realization of practical devices for accurate blood glucose prediction although it is necessary to discuss precision, error and detection limit, and so on in comparison with chemometrics methods before the proposed method is really available for clinical use. 5.ConclusionsThe glucose prediction method based on the modified Beer’s law to synthesize the measured absorbance difference spectra from the absorption spectra of the components in living tissues and baseline is investigated. Synthesizing the measured spectra provides clear understanding of the process of blood glucose prediction from the measured spectra. It is found that the main factors of large prediction errors are the gradual changes in scattering in the skin and the similarity in the shapes of the absorption spectra between glucose and baseline. The prediction errors caused by these two factors are found to be improved significantly by introducing the imaginary component combining and replacing the baseline and fat components after separating the glucose contributions from the measured absorbance differences at the characteristic wavelengths of the baseline and fat components. The results using the imaginary component demonstrate the possibility of simple and real-time blood glucose prediction using NIR spectroscopy based on the modified Beer’s law, although there still exist unknown disturbances that affect the prediction accuracy. Because the imaginary components created from the spectra measured at the fixed position on the skin sequentially from the start of measurement to the time of concern are free from the differences in individuals, measurement positions, seasons, etc., the method using the imaginary component is appropriate for real-time prediction of blood glucose contents. Thus, the proposed method will become a useful tool for realizing noninvasive blood glucose prediction using NIR spectroscopy with further development for incorporating unexpected disturbances in addition to the disturbances considered in this study. AppendicesAppendix ARelation Between the Difference Spectra and the Contents of the Components Based on the Modified Beer’s LawThe absorbance difference spectra at time and wavelength , i.e., , is defined by the difference between the measured absorbances at state 2 and state 1, and , respectively: where is the source light intensity, and are the reflected light intensities at a reference time (state 1, ) and an arbitrary time (state 2, ), respectively, and is the reflected light intensity from a standard reflectance target.Theoretically, the absorbances, and , are given by the modified Beer’s law, which is applied to light scattering media as Eqs. (11) and (12), respectively: where subscript indicates the tissue component, such as glucose, water, fat, and protein, subscripts 1 and 2 indicate the states 1 and 2, respectively, is the molar extinction coefficient (), is the content of each component (M), is the effective optical path length (mm), and is the attenuation of light intensity by scattering. As the effective optical path length and the attenuation by scattering essentially depend not only on the wavelength but also on the scattering and absorption coefficients in the skin tissue, they depend on time. From Eqs. (10), (11), and (12), the absorbance difference, , is given as Eq. (13):Here, , and the effective optical path lengths are assumed not to change by the change from state 1 to state 2 and not to depend on the wavelength, i.e., , and the change in the attenuation by scattering is assumed to be expressed in the same manner as the other components in living tissue, as when introducing the equivalent molar extinction coefficient, , and an equivalent content, . Now, the content of each component, , is expressed as a product of each standard content, , and a coefficient, , i.e., , and the standard absorption spectrum of the component , including attenuation by scattering, is defined as . Then, Eq. (13) is simplified to Eq. (14): where , and is called the content index of the component .An additional procedure is performed on the absorbance difference spectrum, , and the standard absorption spectrum, . They are adjusted to be equal to zero at and denoted as and , and expressed by Eqs. (15) and (16), respectively: The idea of adjustment at came from our preliminary experiment using liquid phantoms. The liquid phantoms made of Intralipid solution (Fresenius Kabi) had the reduced scattering coefficients of either 1.35 or and contained glucose with five glucose contents from 100 to simulating the range of the human blood glucose content. The absorbance spectra of the total of 10 phantoms in the wavelength range from 1300 to 1850 nm were measured and analyzed. As a result, when the absorbance spectra were adjusted to be equal to zero at , their values at (a peak wavelength of glucose absorption) for all the phantoms were plotted on one regression line as a function of the glucose content. This means that the values at of the adjusted (at ) standard absorbance are independent of the reduced scattering coefficient of the background medium.23 Therefore, adjustment at was found to reduce the effect of the disturbance by scattering the change of predicting blood glucose contents. So in this study, we also use adjustment at . In the main text of this study, the adjusted absorbance difference, , is simply called the absorbance difference spectrum, and the adjusted standard absorption spectrum, , is also simply called the absorption spectrum. Appendix BDetermination of the Absorption SpectraThe absorption spectra, , of the five components of water, protein, glucose, fat, and baseline are calculated from the standard absorption spectra, , by adjusting at . of the five components are determined as described in the following. of water and glucose were obtained from the transmittance measurements of pure water and an aqueous glucose solution (with the glucose content of ) in cells with a thickness of 1.0 mm. The measured absorbance () of the pure water sample was equal to , and the absorption coefficient, , of water was obtained by dividing by the cell thickness. Note that the absorption coefficient is given as , and in general. of the aqueous glucose solution was also obtained by dividing the measured absorbance by the cell thickness, and of pure glucose was obtained by subtracting of pure water from of the aqueous glucose solution. Then, the extinction coefficient, , of glucose was obtained by dividing of glucose by the concentration of the glucose, i.e., . The samples of protein and fat were collagen and beef tallow, respectively, which are scattering media. Then the absorption coefficients of protein and fat, (subscript represents protein or fat), were obtained by an inverse Monte Carlo calculation from the measured spectra of the transmittance and reflectance using a spectrometer (UV-3100, Shimazu, Japan) equipped with an integrating sphere.24 The cell thicknesses of the samples, , were 0.5 mm for collagen and 1.0 mm for beef tallow, but the concentration of the samples, , were unknown. Therefore, the absorption coefficient of collagen and beef tallow was given as with arbitrary values of . Then the standard absorption spectra were given as . of baseline was estimated from the scattering coefficient of epidermis. As indicated in the papers of Troy and Thennadil25 and Simpson et al.,26 the scattering coefficient of epidermis decreases monotonically with the increase in the wavelength. When the scattering coefficient decreases, the diffuse reflectance also decreases, resulting in the increase in the absorbance. Therefore, of baseline was given to increase monotonically with the wavelength. In general, the absorption spectrum of component , , is expressed by Eq. (17) with the extinction coefficient normalized by an arbitrary factor as : ReferencesG. C. Cote,
“Noninvasive and minimally-invasive optical monitoring technologies,”
J. Nutr., 131
(5), 1596S
–1604S
(2001). JONUAI 0022-3166 Google Scholar
O. S. Khalil,
“Noninvasive glucose measurement technologies: an update from 1999 to the dawn of the new millennium,”
Diabetes Technol. Ther., 6
(5), 660
–697
(2004). http://dx.doi.org/10.1089/dia.2004.6.660 DTTHFH 1520-9156 Google Scholar
S. K. Vashist,
“Non-invasive glucose monitoring technologies in diabetes management: a review,”
Anal. Chim. Acta, 750 16
–27
(2012). http://dx.doi.org/10.1016/j.aca.2012.03.043 ACACAM 0003-2670 Google Scholar
H. M. Heise,
“Near-infrared spectroscopy for in vivo glucose sensing,”
Biosensors in the Body Continuous In Vivo Monitoring, 79
–116 John Wiley and Sons, New York
(1997). Google Scholar
J. Chen, M. A. Arnold and G. W. Small,
“Comparison of combination and first overtone spectral regions for near infrared calibration models for glucose and other biomolecules in aqueous solutions,”
Anal. Chem., 76
(18), 5405
–5413
(2004). http://dx.doi.org/10.1021/ac0498056 ANCHAM 0003-2700 Google Scholar
H. Martens and T. Naes, Multivariate Calibration, John Wiley, New York
(1991). Google Scholar
S. F. Malin et al.,
“Noninvasive prediction of glucose by near-infrared diffuse reflectance spectroscopy,”
Clin. Chem., 45
(9), 1651
–1658
(1999). CLCHAU 0009-9147 Google Scholar
K. Maruo et al.,
“In vivo noninvasive measurement of blood glucose by near-infrared diffuse-reflectance spectroscopy,”
Appl. Spectrosc., 57
(10), 1236
–1244
(2003). http://dx.doi.org/10.1366/000370203769699090 APSPA4 0003-7028 Google Scholar
M. A. Arnold, L. Liu and J. T. Olesberg,
“Selectivity assessment of noninvasive glucose measurements based on analysis of multivariate calibration vectors,”
J. Diabetes Sci. Technol., 1
(4), 454
–462
(2007). http://dx.doi.org/10.1177/193229680700100402 JDSTAV 1932-2968 Google Scholar
N. V. Alexeeva and M. A. Arnold,
“Near-infrared microspectroscopic analysis of rat skin tissue heterogeneity in relation to noninvasive glucose sensing,”
J. Diabetes Sci. Technol., 3
(2), 219
–232
(2009). http://dx.doi.org/10.1177/193229680900300202 JDSTAV 1932-2968 Google Scholar
K. Maruo et al.,
“New methodology to obtain a calibration model for noninvasive near-infrared blood glucose monitoring,”
Appl. Spectrosc., 60
(4), 441
–449
(2006). http://dx.doi.org/10.1366/000370206776593780 APSPA4 0003-7028 Google Scholar
K. Maruo et al.,
“Noninvasive near-infrared blood glucose monitoring using a calibration model built by a numerical simulation method: trial application to patients in an intensive care unit,”
Appl. Spectrosc., 60
(12), 1423
–1431
(2006). http://dx.doi.org/10.1366/000370206779321508 APSPA4 0003-7028 Google Scholar
H. M. Heise and R. Winzen,
“Chemometrics in near-infrared spectroscopy,”
Near-Infrared Spectroscopy: Principles, Instruments, Applications, 125
–162 Wiley-VCH, Weinheim
(2002). Google Scholar
D. T. Delpy et al.,
“Estimation of optical pathlength through tissue from direct time of flight measurement,”
Phys. Med. Biol., 33
(12), 1433
–1442
(1988). http://dx.doi.org/10.1088/0031-9155/33/12/008 PHMBA7 0031-9155 Google Scholar
P. Ritthiruangdej et al.,
“Non-destructive and rapid analysis of chemical compositions in Thai steamed pork sausages by near-infrared spectroscopy,”
Food Chem., 129 684
–692
(2011). http://dx.doi.org/10.1016/j.foodchem.2011.04.110 FOCHDJ 0308-8146 Google Scholar
S. N. Thennadil et al.,
“Comparison of glucose content in interstitial fluid, and capillary and venous blood during rapid change in blood glucose levels,”
Diabetes Technol. Ther., 3
(3), 357
–365
(2001). http://dx.doi.org/10.1089/15209150152607132 DTTHFH 1520-9156 Google Scholar
J. P. Bantle and W. Thomas,
“Glucose measurement in patients with diabetes mellitus with dermal interstitial fluid,”
J. Lab. Clin. Med., 130 436
–441
(1997). http://dx.doi.org/10.1016/S0022-2143(97)90044-5 JLCMAK 0022-2143 Google Scholar
H. Arimoto, M. Tarumi and Y. Yamada,
“Estimation of absorption change in scattering media by glucose concentration for spectroscopic measurements,”
in Proc. of Asian Symp. on Biomedical Optics and Photomedicine,
214
–215
(2002). Google Scholar
M. A. Arnold, J. J. Burmeister and G. W. Small,
“Phantom glucose calibration models from simulated noninvasive human near-infrared spectra,”
Anal. Chem., 70
(9), 1773
–1781
(1998). http://dx.doi.org/10.1021/ac9710801 ANCHAM 0003-2700 Google Scholar
Y. P. Du et al.,
“Improvement of the partial least squares model performance for oral glucose intake experiments by inside mean centering and inside multiplicative signal correction,”
Anal. Sci., 21
(8), 979
–984
(2005). http://dx.doi.org/10.2116/analsci.21.979 ANSCEN 0910-6340 Google Scholar
Y. Suzuki et al.,
“Preliminary evaluation of optical glucose sensing in red cell contents using near-infrared diffuse-reflectance spectroscopy,”
J. Biomed. Opt., 17
(1), 017004
(2012). http://dx.doi.org/10.1117/1.JBO.17.1.017004 JBOPFO 1083-3668 Google Scholar
K. Iino et al.,
“Monte Carlo simulation of NIR reflectance spectroscopy in the wavelength range from 1000 nm to 1900 nm,”
Opt. Rev., 10
(6), 600
–606
(2003). http://dx.doi.org/10.1007/s10043-003-0600-z 1340-6000 Google Scholar
T. Ota et al.,
“Measurement of optical properties of blood components using an inverse Monte Carlo technique,”
in Proc. of Asian Symp. on Biomedical Optics and Photomedicine,
230
–231
(2002). Google Scholar
T. L. Troy and S. N. Thennadil,
“Optical properties of human skin in the near infrared wavelength range of 1000 to 2200 nm,”
J. Biomed. Opt., 6
(2), 167
–176
(2001). http://dx.doi.org/10.1117/1.1344191 JBOPFO 1083-3668 Google Scholar
C. R. Simpson et al.,
“Near-infrared optical properties of ex vivo human skin and subcutaneous tissues measured using the Monte Carlo inversion technique,”
Phys. Med. Biol., 43
(9), 2465
–2478
(1998). http://dx.doi.org/10.1088/0031-9155/43/9/003 PHMBA7 0031-9155 Google Scholar
BiographyKatsuhiko Maruo is a chief engineer at Panasonic Healthcare Co., Ltd. He received his BS and MS degrees in chemical engineering from Kobe University in 1983 and 1985, respectively, and his PhD from the University of Electro-Communications in 2007. His current research interests include near-infrared spectroscopy and fluorescent detection of living materials. Yukio Yamada is a professor of the University of Electro-Communications. He received his BS, MS, and PhD degrees from Tokyo Institute of Technology in 1970, 1973, and 1983, respectively. He joined a national research laboratory (Mechanical Engineering Laboratory, Japan) in 1974, and moved to the University of Electro-Communications in 2001. His research interests include light propagation of near-infrared light in turbid media and its applications to biomedical photonics. |


