
|
|
1.IntroductionWounds represent a prevalent medical condition worldwide, with negative effects on patient quality of life and high costs for treatment. Statistics show that each year hundreds of millions of people suffering from acute and chronic wounds are globally reported. This high incidence makes the accurate assessment, accurate diagnosis, and effective documentation to be essential tasks for the effective treatment of wounds with consequences on patient health and health cost reduction. Currently, there is a wide variety of methods available for measuring physical parameters (surface area, structure, and types of tissues in the wound bed) or some attributes of wounds (color, bleeding, erythema, edema, exudate, odor, temperature, and so on), as well as new approaches for their improvement in terms of accuracy, efficiency, costs, and possibly providing more quantitative information about the characteristics of wounds. The most used methods for measuring physical parameters of wounds are linear methods, tracing methods, planimetry, photography, sterophotogrammetry, etc., while paraclinical evaluation of wound can be done by thermography, laser Doppler imaging, magnetic resonance imaging, ultrasound imaging and so on.1 More recently, multispectral and hyperspectral imaging have proven their ability to provide important information that can help in better documentation of the wound. Hyperspectral imaging (HSI) is an emerging medical technology that offers the possibility of extracting both spectral and spatial information about each pixel from a tissue/organ/body image. This information is very useful in the characterization, identification, and classification of different biological tissues for diagnostic purposes and medical treatment monitoring. The basic idea of this method is to acquire a set of images in many adjacent narrow spectral bands and to reconstruct the reflectance spectrum for every pixel of the image.2 The set of images is a three-dimensional hyperspectral data cube, known as a hypercube, comprising two spatial dimensions (the spatial coordinates of a pixel) and one spectral dimension (the wavelength of a particular spectral band). Therefore, both spatial and spectral information about the object or scene under investigation can be simultaneously obtained from the analysis of the hypercube. The difference between hyper- and multispectral imaging is given by the arbitrary number of bands and/or the type of measurement. While hyperspectral imaging systems collect hundreds of spectral bands of 1–20 nm width, multispectral imaging sensors are systems collecting of tens, generally noncontiguous, of spectral bands. HSI has found its utility in a wide array of applications in numerous fields, such as mining and geology,3 agriculture,4 surveillance,5 astronomy,6 chemistry,7 and environment.8 More recently, some studies have shown that HIS can be considered as a valuable tool in the medical field for noninvasive detection of cancer,9 diabetic foot ulcers,10 peripheral vascular disease,11 or to assess levels of tissue blood oxygenation during surgery.12 The successful use of HSI in any of these areas depends, however, on the hyperspectral image processing techniques used to analyze the large volume of generated data.13 A variety of existing or newly developed techniques for preprocessing, extraction, and classification of specific information contained in hyperspectral data sets have been investigated in recent years. Twelve categories of image classification methods have been identified by Lu and Weng14 depending on the nature of the available information: supervised and unsupervised classification (based on the use of training samples), parametric and nonparametric classification (based on an parametric model), hard and soft (fuzzy) classification (based on class information), perpixel, subpixel, and perfield classification (based on pixel information), and spectral, contextual, and spectral-contextual classification (based on spatial information). In the medical field, with the use of HSI being in its infancy, little work has been done with hyperspectral data classification for wound assessment. Only three classification methods have been mainly tested for chronic skin ulcers diagnosis and wound healing evolution. Thus, Denstedt et al.15 tested and compared the performance of spectral angle mapping and -means clustering as supervised and unsupervised classification methods of hyperspectral data acquired from patients with venous leg ulcers. -nearest neighbors (-NN) is another supervised classification method applied by Nouri et al.16 for the classification of multispectral data in the wound assessment in the context of a preclinical study in apitherapy. This study is designed as an initial investigation into the use of subpixel mixture-tuned matched filtering (MTMF) classification of the hyperspectral data as a method for mapping open wounds. We chose this method based on its ability to map an individual target (endmember) without requiring the knowledge of all the endmembers within an image by combining the linear spectral mixing model with the statistical matched filter (MF) model.17 The main objectives of this work were: (1) identification of all the tissue types in the wound and (2) evaluation of the relative surface area of each identifiable tissue type. The goal of this classification is to produce an image in which each pixel is categorized according to the presence, absence, or relative abundance of the tissue types. 2.Methods2.1.Hyperspectral Image AcquisitionA hyperspectral image of an open wound located on the medial part of the right hind leg of a dog using a line-scan hyperspectral imaging system was acquired 2 days after it was admitted to the medical clinic. The investigation was done with the approval of the Animal Ethics Committee. On clinical examination, the wound consisted of granulating tissue in the center (covering most of the surface) with some marginal necrosis and scattered blood clots and marginal spontaneous epithelialization. The wound was cleansed with a 10% Betadine® solution and gentamicin. There were no signs of wound infection (hyperemia or edema on the surrounding healthy skin). A line-scan HSI system consisting of an imaging spectrograph (ImSpector V8E, Specim, Oulu, Finland) equipped with a 19 deg field-of-view Xenoplan1.4/17 lens (Schneider, Bad Kreuznach, Germany), which allows the simultaneous acquisition of 205 spectral bands from 400 to 800 nm with a spectral resolution of 1.95 nm and a DX4 CCD camera (Kappa, Gleichen, Germany) with a recording speed of 42 fps at a spatial resolution of mounted on a tripod was used for hyperspectral image acquisition (Fig. 1). Fig. 1The schematic illustration of the experimental setup for hyperspectral imaging (HIS) of the wound. 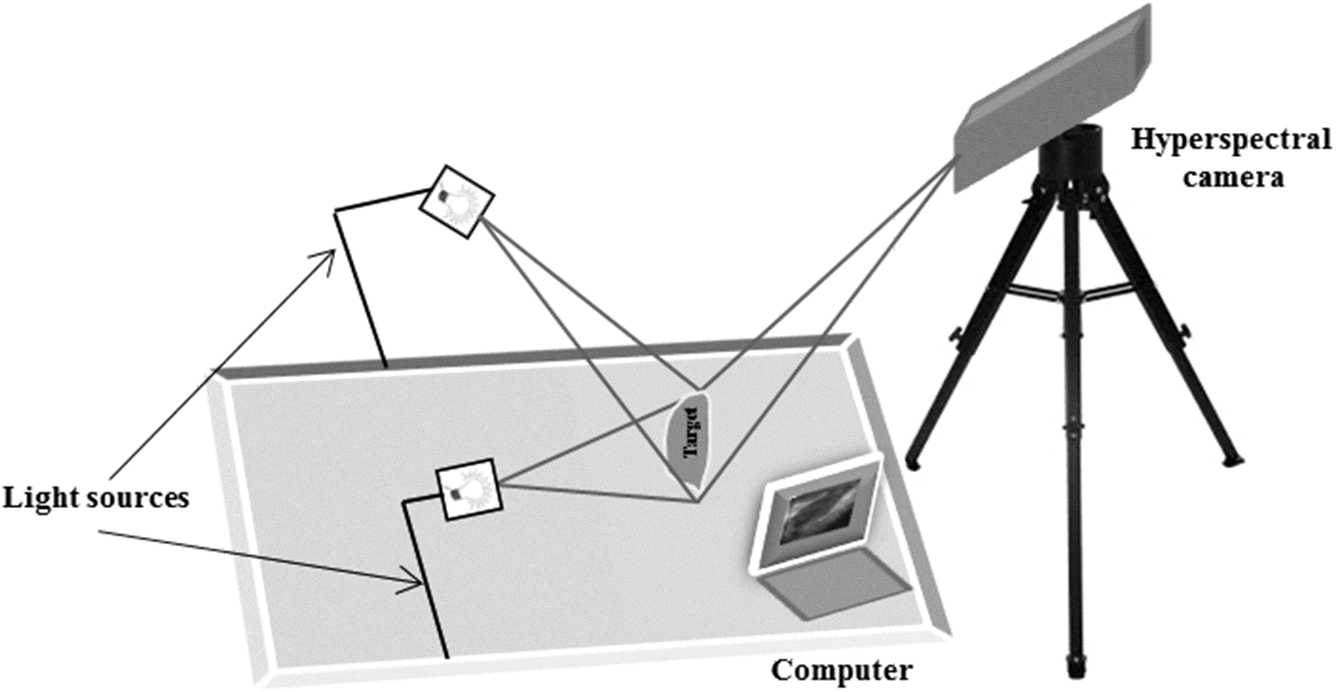 Uniform illumination of the entire investigation area was provided by an illumination unit containing two 300 W halogen lamps (OSRAM, Germany) equipped with diffusion filters (Kaiser Fototechnik GmbH & Co.KG, Buchen, Germany). An image acquisition computer with image acquisition software (SpectralDAQ—Specim, Oulu, Finland) and image processing and analysis software (ENVI v.5.1—Exelis Visual Information Solutions, Boulder, Colorado) was connected to the hyperspectral system. 2.2.Mixture-Tuned Matched Filtering ClassificationThe MTMF method addressed in this study is a supervised method that performs data classification based on a combination of a statistical MF method and linear spectral mixing theory.17 MF method allows the estimation of the subpixel abundance of a single target in mixed pixels by filtration of the hyperspectral data up to a good match to the target spectrum. This is done by maximizing the response of the target spectrum and suppressing the response of other unknown elements from the pixel.18 The output from the MF method is a target abundance image where each pixel has an MF score.17 This MF score represents the fraction of the pixel that contains the target, with values between 0 and 1. A pixel with an MF score of 1 would be considered as a perfect match while a pixel with a value of 0 or less would be interpreted as representing the background. Sometimes, irregularities in MF score values may be encountered (i.e., values greater than 1) because the MF method is not subject to the sum-to-one and non-negative constraints.18 To address the problem of these false results that often appear as MF solutions, a mixture tuning (MT) method is applied as the second component of the MTMF classification.17 The MT method uses a linear spectral mixing model19 to add constraints to the feasibility of MF results by considering the sum-to-one and non-negative requirements, so that the number of false positives is reduced. The output from the MT method is an infeasibility image where each pixel has an infeasibility score (IF score).19 The IF score is a measure of good matches for each MF result. An IF score of zero is the best match, meaning an MF result with zero false positives. Pixels with a high IF score are liable to be regarded as false positives irrespective of their MF score. Therefore, pixels that combine low IF scores with high MF scores can be considered as correctly mapped, because they show the best match to the target spectrum. In this study, the MTMF method, as implemented in ENVI v 5.1 software, was used to generate a map of the injured tissues from the wound and surrounding skin. The MTMF method involves the following processing steps:20,21
This method helps us to characterize the wound by extracting useful spectral/spatial information about the injured tissue type from hyperspectral image without a priori knowledge of all the tissue classes within the image. 3.ResultsFigure 2 shows the RGB image of the examined wound and the hyperspectral image (hypercube) with spatial dimensions pixels, and spectral data of 205 bands from 400 to 800 nm. The RGB image [Fig. 2(a)] shows a granulating defect with some hypertrophic granulations in the center. There is a newly formed marginal epithelium mainly on the left edge and some minor areas of necrosis or hematic crusts (upper left, lower center). A limited area of infiltration can be depicted at the lower wound border. Two linear recent scars can be seen on the right side (the upper one being slightly longer). The surrounding skin is hair-bearing and shaved. The tissue types were mapped by applying the MTMF method to the hyperspectral image [Fig. 2(b)]. First, an MNF transform was run on this input hyperspectral image providing an output of 205 MNF bands. By examining the eigenvalues (EV) and after a careful visual inspection of the spatial information contained in the output MNF bands, we selected the first six MNF bands as being coherent images (Fig. 3). The remaining MNF bands primarily contain noise. Fig. 3First seven minimum noise fraction (MNF) images of hyperspectral image data. The eigenvalues (EV) of MNF images are between 98.527 and 1.768. (a) MNF band 1 EV: 98.527, (b) MNF band 2 EV: 25.558, (c) MNF band 3 EV: 8.942, (d) MNF band 4 EV: 3.557, (e) MNF band 5 EV: 2.514, (f) MNF band 6 EV: 2.183, (g) MNF band 7 EV: 1.768. 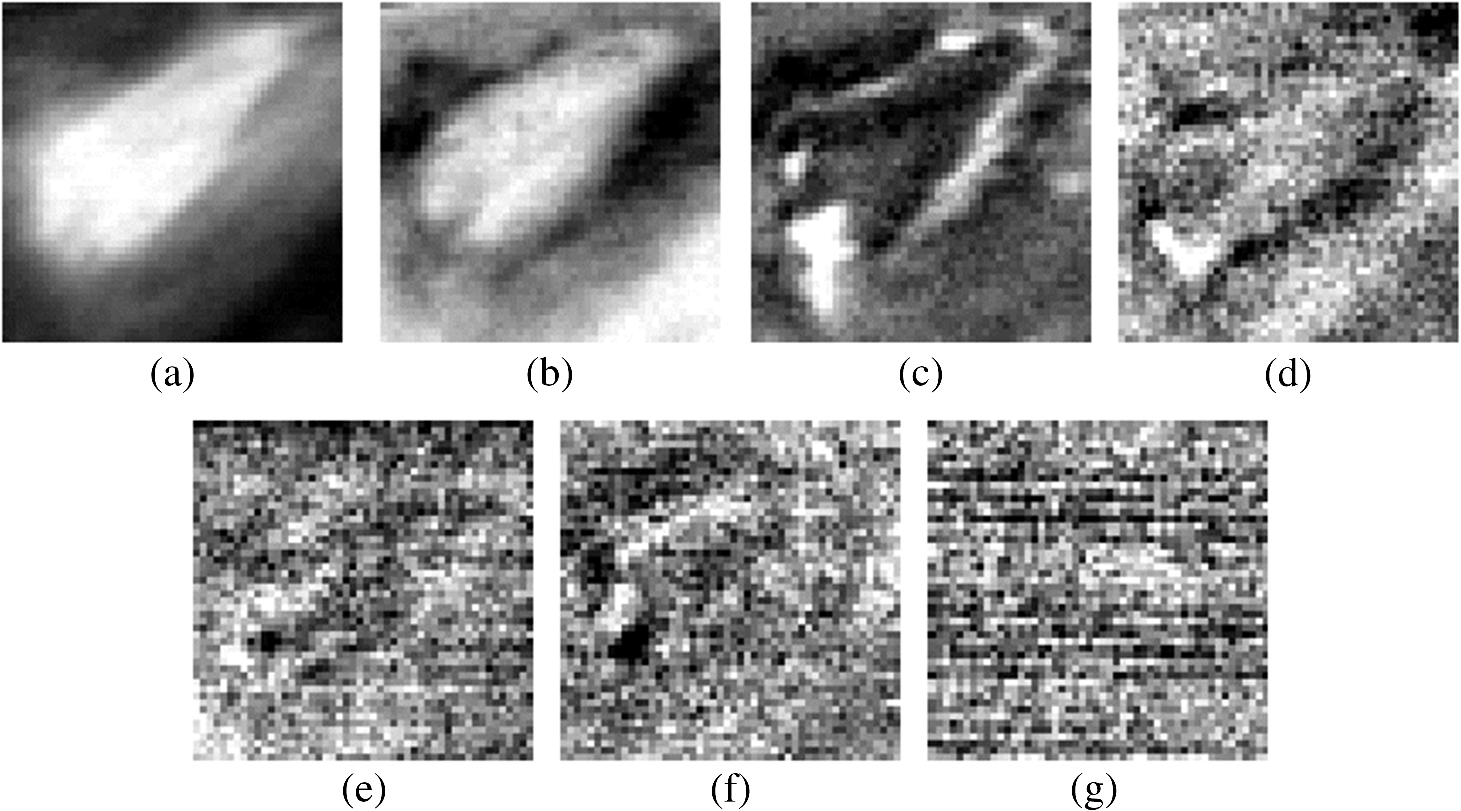 As we can see in Fig. 3, the eigenvalue for each of the first six MNF bands is greater than 2. The eigenvalues for the remaining MNF bands are lower and are all close to 1. We can also notice MNF band 1 mirroring a vague general image of the wound being dominated by some instrument artifacts, while MNF band 2 shows a much better image quality where all types of tissues are present (epithelial tissue, granular tissue, blood crusts, and so on). In MNF band 3, the edges of the wound and all kinds of affected tissues are well represented, but other features of the wound are not well distinguished. MNF band 4 highlights mainly skin with hair, granulation, the line of the infiltrating zone, and the newly formed epithelium, and the noise starts to appear. MNF bands 5 and 6 are dominated by noise, but some features of the wound such as granulating tissue can still be distinguished. Starting with the MNF band 7, the noise increases substantially and a lot of primary information is lost. Based on this analysis, the intrinsic dimensionality of the image was determined to be 6 in this case. We have used a spatial coherence threshold level of 0.12 to set the number of bands at 6. The potential endmembers from the image were then determined by running the PPI procedure on the MNF data using an optimal number of 10,000 iterations established based on the PPI plot and a threshold value of 2.5 to exceed the noise level in our MNF transformed data.25 Figure 4 presents the PPI image thus created. The brighter pixels in PPI image denote the potential endmembers and darker pixels are considered as less spectrally pure. Fig. 4Pixel purity index (PPI) image. This image was created using the first three MNF bands. The white areas show the pixels selected as those that had the greatest occurrence as extreme, and are, thus potential endmembers. 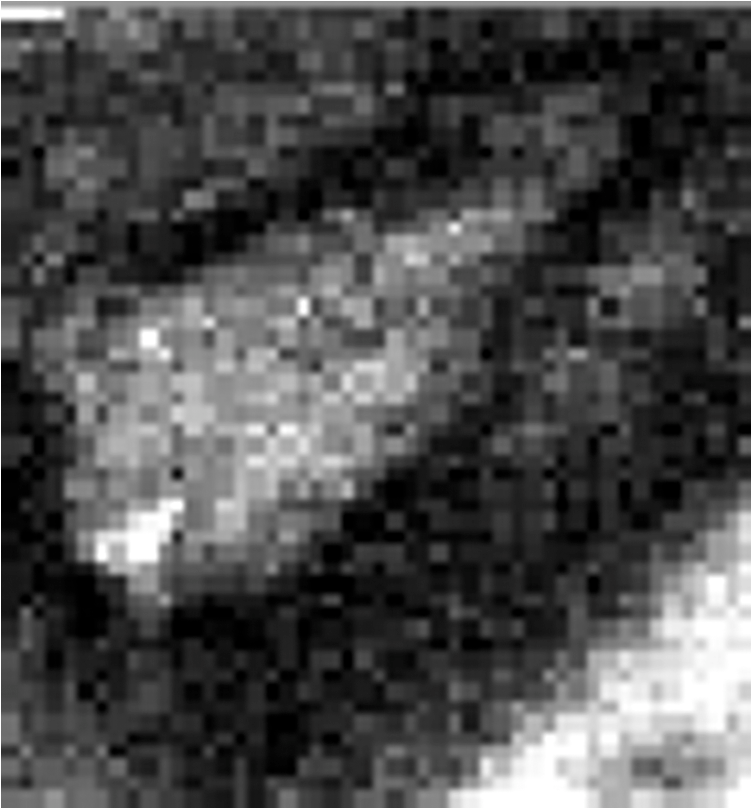 These potential endmembers derived from the PPI procedure were then loaded into an interactive n-dimensional visualizer tool to identify the clusters of pure pixels and to derive the final set of endmember candidates from these clusters. A number of six endmembers were derived for this study. The location of these endmembers in the scene and their spectral profile is shown in Fig. 5. Fig. 5The endmember extracted from an n-dimensional visualizer: (a) spatial location of the endmembers; (b) spectral profile of the endmembers.  By examining the spatial location and spectral profile of each of the endmembers and based on our expertise in wound assessment, we have identified the endmembers as being (Table 1): skin with hair (outside the shaved zone) in green color (endmember 1), its spectrum is so flat probably due to black hair abundance, and in cyan (endmember 4) is a large area with granulations. In the lower part of the cyan zone, there is a zone in magenta (endmember 5) which seems to be necrotic tissue, surrounded by some blue color (endmember 2) which has a similar spectrum as endmember 5, which suggests that it corresponds to necrotic areas (maybe thinner than the one in endmember 5). Both endmembers 3 and 6 (yellow and maroon, respectively) are situated in the area of normal shaved skin and their spectra have the same reflection peaks, with endmember 6 having higher values. They even have the same reflection peak at 550 nm, a feature that does not appear in the spectra of the other members. They do not have the same spatial distribution and there is a large area of normal shaved skin that is not covered by either endmember 3 or 6. Table 1Interpretation of the endmembers based on spectral features and spatial context.
It is interesting that the newly formed epithelial tissue easily identified on clinical examination has no endmember correspondent and it looks in Fig. 5 like normal shaved skin. This set of endmembers was used as input into the MTMF method to derive individual tissue type cover abundances. As a result, an MF image and an infeasibility (IF) image for each endmember were obtained. MF images that allow an estimate of the fractional abundance for each target tissue are presented in Fig. 6. Fig. 6Matched filtering (MF) abundance image for each endmember derived from the mixture-tuned MF (MTMF) classification. Each pixel in the image has an MF score: (a) endmember 1, (b) endmember 2, (c) endmember 3, (d) endmember 4, (e) endmember 5, (f) endmember 6.  The MF images show areas with higher MF scores as brighter pixels, thus highlighting the areas with large abundance where the target tissue likely occurs. However, if we examine these images compared to the RGB image [Fig. 2(a)], we can see that the selected target tissues cannot be found in all areas with brighter pixels. IF images help us to improve the MF results by causing rejection of these false alarms using the mixture feasibility constraints. For this purpose, a scatter plot of IF scores versus MF scores was used in this study to extract pixels with a high MF score and low IF score for each endmember (Fig. 7). Fig. 7Scatter plot of IF scores versus MF scores for each endmember: (a) endmember 1, (b) endmember 2, (c) endmember 3, (d) endmember 4, (e) endmember 5, (f) endmember 6.  In Fig. 7, a great number of pixels present negative MF scores or MF scores greater than 1, both of which are physically meaningless. Therefore, we set MF scores between 0 and 1 to indicate the no match to a perfect match, respectively, for each selected endmember. Pixels having such an MF score and low IF score () were interactively selected from the scatter plot of MF scores versus IF scores to delineate the distribution of each endmember (triangular area of each figure). The selected pixels were exported to a region of interest (ROI) created for each endmember. The ROIs were then converted into a classification image (Fig. 8) showing those pixels in the image that most closely match the spectral signature of each selected endmember. In Fig. 8, the center of the wound granulating tissue (endmember 4) covers 233 pixels. Necrotic tissue (endmembers 2 and 5) covers 37 pixels. Normal shaved skin around the wound is covered by endmembers 3 and 6, with endmember 6 being closer to the wound (maybe edema, which should be present in this area, differentiates normal skin into two different endmembers). The area of normal skin is 196 pixels for endmember 6 (edematous skin) and 139 pixels for endmember 3. This kind of estimation of the surface area covered by the wound with its components (granulating tissue, necrotic tissue) in comparison with normal skin and newly formed epithelium may be of value in monitoring the wound evolution during a certain period of time and in assessing the wound tendency toward spontaneous healing. 4.DiscussionClinical evaluation of open wounds (including ulcers of different etiology) is the usual tool currently used in medical practice. It strongly depends on the experience of the examiner and is hardly objective in terms of assessing wound surface and its tendency toward healing. The HIS method in association with MTMF classification of the image has shown in our study that it can provide measurable information about the relative surface area of the wound and surrounding skin. While the specific spectrum of each endmember generated by this method is difficult to explain [we have seen different spectra for the same type of tissue, such as normal skin or necrotic tissue (see results section)] and needs more detailed studies in which common chromophores such as oxy- and deoxyhemoglobin or melanin must be taken into account, combining HIS/MTMF with clinical examination takes open wound monitoring and evaluation to a new level. Our results show that HIS/MTMF is not enough in the absence of a calibration study, but it can help the clinician in objectification of his observations and in conducting the best possible treatment. It may tell the surgeon if the ulcer is healing at a good pace or even the rhythm in which granulating tissue is eliminating necrotic areas if the method is applied several times during the evolution of the wound (which the authors plan to test in further studies). Few studies have been directed toward HIS assisted wound evaluation so far, but with encouraging results. Denstedt et al.15 showed that -means clustering provides an accurate determination of wound margins when used to analyze hyperspectral images. -NN classification method was proven by Nouri16 to discriminate between granulating tissue and normal skin when used as a supervised classification method for HIS in a preclinical study on apitherapy. In a previous study, we presented a method of burns’ characterization based on HIS and a linear unmixing model with good results (good identification of normal and injured skin) with prospects that this method could be used in determining burn depth.26 In this study, we have proven that the MTMF method can also identify necrotic tissue and it can provide useful information about the relative surface areas of different endmembers. All these studies, including this report, have shown good results using different methods to analyze HIS generated images of open wounds. There is a need for further research in this field because the analyzed wounds are not comparable so there is not any element that can prove which is the most reliable classification method. We have to admit that the method described in this study has its flaws (such as not differentiating between newly formed epithelium or scars and normal skin), but it can show if the wound surface is regressing and at what pace if applied at various moments in its evolution. It is important to maintain the same investigation setup in order to provide reliable data when monitoring the wound evolution. Furthermore, HIS imaging is noninvasive and noncontact, regardless of the method that analyzes it, so its perspectives in open wounds characterization are worth investigating in the future. AcknowledgmentsThis work was financed by the Romanian Ministry of Education and Scientific Research by means of the Research Program No. PN II PCCA 184/2012. ReferencesR. J. Goldman and R. Salcido,
“More than one way to measure a wound: an overview of tools and techniques,”
Adv. Skin Wound Care, 15
(5), 236
–243
(2002). http://dx.doi.org/10.1097/00129334-200209000-00011 1527-7941 Google Scholar
A. F. H. Goetz et al.,
“Imaging spectrometry for earth remote sensing,”
Science, 228
(4704), 1147
–1153
(1985). http://dx.doi.org/10.1126/science.228.4704.1147 SCIEAS 0036-8075 Google Scholar
A. F. H. Goetz,
“Three decades of hyperspectral remote sensing of the Earth: a personal view,”
Remote Sens. Environ., 113 5
–16
(2009). http://dx.doi.org/10.1016/j.rse.2007.12.014 RSEEA7 0034-4257 Google Scholar
D. Liu, X. A. Zeng and D. W. Sun,
“Recent developments and applications of hyperspectral imaging for quality evaluation of agricultural products: a review,”
Crit. Rev. Food Sci. Nutr.,
(2013). http://dx.doi.org/10.1080/10408398.2013.777020 CRFND6 0099-0248 Google Scholar
E. Puckrin,
“Airborne infrared hyperspectral imager for intelligence, surveillance, and reconnaissance applications,”
Proc. SPIE, 8360 836004
(2012). http://dx.doi.org/10.1117/12.918251 PSISDG 0277-786X Google Scholar
S. Bongard et al.,
“3D deconvolution of hyperspectral astronomical data,”
Mon. Not. R. Astron. Soc., 418 258
–270
(2011). http://dx.doi.org/10.1111/mnr.2011.418.issue-1 MNRAA4 0035-8711 Google Scholar
J. M. Amigo,
“Practical issues of hyperspectral imaging analysis of solid dosage forms,”
Anal. Bioanal. Chem., 398 93
–109
(2010). http://dx.doi.org/10.1007/s00216-010-3828-z ABCNBP 1618-2642 Google Scholar
S. Roessner et al.,
“Potential of hyperspectral remote sensing for analyzing the urban environment,”
Urban Remote Sensing: Monitoring, Synthesis and Modeling in the Urban Environment, 49
–51 John Wiley & Sons, Ltd., Chichester, UK
(2011). http://dx.doi.org/10.1002/9780470979563.ch4 Google Scholar
H. Akbari et al.,
“Hyperspectral imaging and quantitative analysis for prostate cancer detection,”
J. Biomed. Opt., 17
(7), 076005
(2012). http://dx.doi.org/10.1117/1.JBO.17.7.076005 JBOPFO 1083-3668 Google Scholar
D. Yudovsky et al.,
“Assessing diabetic foot ulcer development risk with hyperspectral tissue oximetry,”
J. Biomed. Opt., 16
(2), 026009
(2011). http://dx.doi.org/10.1117/1.3535592 JBOPFO 1083-3668 Google Scholar
J. A. Chin, E. C. Wang and M. R. Kibbe,
“Evaluation of hyperspectral technology for assessing the presence and severity of peripheral artery disease,”
J. Vasc. Surg., 4 565
–576
(2011). http://dx.doi.org/10.1016/j.jvs.2011.06.022 0741-5214 Google Scholar
K. J. Zuzak et al.,
“Intraoperative bile duct visualization using near-infrared hyperspectral video imaging,”
Am. J. Surg., 195
(4), 491
–497
(2008). http://dx.doi.org/10.1016/j.amjsurg.2007.05.044 AJOOA7 0096-6347 Google Scholar
M. A. Calin et al.,
“Hyperspectral imaging in the medical field: present and future,”
Appl. Spectrosc. Rev., 49
(6), 435
–447
(2014). http://dx.doi.org/10.1080/05704928.2013.838678 APSRBB 0570-4928 Google Scholar
D. Lu and Q. Weng,
“A survey of image classification methods and techniques for improving classification performance,”
Int. J. Remote Sens., 28
(5), 823
–870
(2007). http://dx.doi.org/10.1080/01431160600746456 IJSEDK 0143-1161 Google Scholar
M. Denstedt et al.,
“Hyperspectral imaging as a diagnostic tool for chronic skin ulcers,”
Proc. SPIE, 8565 85650N
(2013). http://dx.doi.org/10.1117/12.2001087 PSISDG 0277-786X Google Scholar
D. Nouri et al.,
“Colour and multispectral imaging for wound healing evaluation in the context of a comparative preclinical study,”
Proc. SPIE, 8669 866923
(2013). http://dx.doi.org/10.1117/12.2003943 PSISDG 0277-786X Google Scholar
J. W. Boardman,
“Leveraging the high dimensionality of AVIRIS data for improved sub-pixel target unmixing and rejection of false positives: mixture tuned matched filtering,”
in Summaries of the Seventh Annual JPL Airborne Earth Science Workshop,
53
–55
(1998). Google Scholar
J. C. Harsanyi and C. I. Chang,
“Hyperspectral image classification and dimensionality reduction: an orthogonal subspace projection approach,”
IEEE Trans. Geosci. Remote Sens., 32 779
–785
(1994). http://dx.doi.org/10.1109/36.298007 IGRSD2 0196-2892 Google Scholar
J. W. Boardman, F. A. Kruse and R. O. Green,
“Mapping target signatures via partial unmixing of AVIRIS data,”
in Summaries of the Fifth Annual JPL Airborne Earth Science Workshop,
23
–26
(1995). Google Scholar
F. A. Kruse, J. W. Boardman and J. F. Huntington,
“Evaluation and validation of EO-1 Hyperion for mineral mapping,”
IEEE Trans. Geosci. Remote Sens., 41
(6), 1388
–1400
(2003). http://dx.doi.org/10.1109/TGRS.2003.812908 IGRSD2 0196-2892 Google Scholar
A. A. Green et al.,
“A transformation for ordering multispectral data in terms of image quality with implications for noise removal,”
IEEE Trans. Geosci. Remote Sens., 26
(1), 65
–74
(1988). http://dx.doi.org/10.1109/36.3001 IGRSD2 0196-2892 Google Scholar
J. W. Boardman,
“Geometric mixture analysis of imaging spectrometry data,”
in Proc. Geoscience and Remote Sensing Symp.,
2369
–2371
(1994). http://dx.doi.org/10.1109/IGARSS.1994.399740 Google Scholar
J. W. Boardman,
“Automated spectral unmixing of AVIRIS data using convex geometry concepts,”
in Summaries of the Fourth JPL Airborne Geoscience Workshop,
11
–14
(1993). Google Scholar
S. Mahalingam,
“Hyperspectral image processing techniques and advances,”
(2015) , Hyderabad, India ( March ). 2015). Google Scholar
M. A. Calin et al.,
“Characterization of burns using hyperspectral imaging technique: a preliminary study,”
Burns, 41
(1), 118
–124
(2015). http://dx.doi.org/10.1016/j.burns.2014.05.002 BURND8 0305-4179 Google Scholar
BiographyMihaela Antonina Calin is a senior researcher and head of the Optoelectronics Methods for Biomedical Applications Department at the National Institute of Research and Development for Optoelectronics—INOE 2000, Bucharest, Romania. She received her PhD in physics from the University of Bucharest, Faculty of Physics, Romania. Her research activities are mainly focused on the development of new optical diagnostic and therapeutic methods based on the interaction of laser radiation with biological tissues. Toma Coman is a professor and founder of the Faculty of Veterinary Medicine “Spiru Haret,” Bucharest, Romania. He is a member of the European Society of Oncology, specializing in histochemistry, autohistoradiography, and radioisotope application since 1986, and he is author of more than 300 scientific works, over 100 as first author. Sorin Viorel Parasca is an assistant lecturer in plastic surgery at Carol Davila University of Medicine and Pharmacy, Bucharest, Romania, and consulting surgeon (plastic surgery) at the Clinical Emergency Hospital for Plastic Surgery and Burns, Bucharest, Romania. He received his PhD from Ovidius University in Constanta, Romania. Beginning in 2005, he started a close collaboration with researchers from the National Institute of Research and Development for Optoelectronics—INOE 2000 on optical physics’ applications in medicine. Nicolae Bercaru is a PhD DVM assistant professor in the Department of Pathology and Surgical Clinic at Faculty of Veterinary Medicine “Spiru Haret” University, Bucharest, Romania. He received his PhD degree in 2004. Since 2004 he has been an assistant professor at a pathology and surgical clinic. In 2010, he successfully implanted a cardiac pacemaker in a dog for the first time in Romania. In 2012, he received user licenses for x-ray device from Institute of Atomic Physics Magurele. He specializes in orthopedics and soft-tissue surgery in small and large animals. Roxana Savastru is a senior researcher and general director of the National Institute of Research and Development for Optoelectronics, Romania. She received her PhD in technical sciences from Politehnica University of Bucharest, Romania. Her main activities are focused in the field of application, a scientific management for improving research activity; modernization of equipment, technological design, and implementation of optomechanical systems with applications in optoelectronic diagnostic techniques, environment, industry, and art conservation. Dragos Manea graduated in 2012 from the University of Bucharest, Faculty of Physics, Romania. Currently, he is pursuing his master’s degree in the field of medical physics. Since 2011, he has worked at the National Institute of Research and Development for Optoelectronics—INOE 2000 as research assistant in the field of optoelectronic methods with biomedical applications. |


