|
|
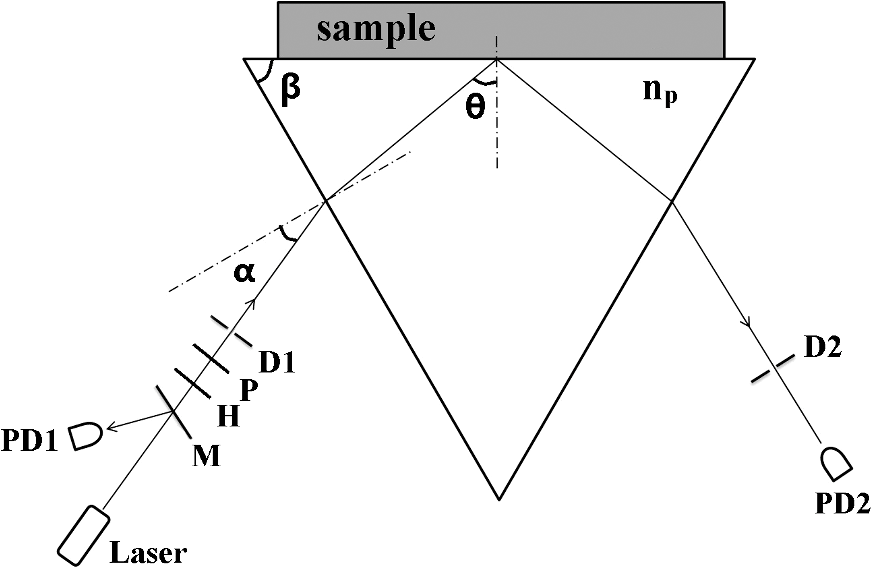
1.IntroductionWith the development of biological optics, optical diagnostics and optical treatments have drawn much attention. Due to the high scattering of tissue, the penetration depth of light in tissue is limited. Tuchin et al.1 proposed the optical clearing (OC) technique to reduce tissue scattering. The OC technique reduces the mismatches of refractive index (RI) in tissue by partly replacing the interstitial or intracellular water with high RI chemical agents. The RI mismatches are mainly due to the different tissue components. For example, the RIs of collagen fibrils, cellular organelles, and tissue fluid are 1.47, 1.39 to 1.42, and 1.35, respectively.2,3 Rylander et al.4 suggest that water transport is also an important mechanism for tissue OC. According to the heuristic particle-interaction model described in Refs. 4 and 5, the tissue scattering can be controlled by changing the volume fraction of the high RI components in tissue. As studied in Refs. 4 and 6, both the evaporation induced and the compression induced dehydration can allow for better tissue optical clarity. Various methods have been applied to evaluate the OC effect, such as photographic imaging technique,4 optical coherent tomography technique,4 transmission electron microscopy,4 optical transmittance and reflectance measurements.4,7–10 These methods mostly evaluate the OC effect by detecting the intensity change of light rather than the change of the optical parameter. The inverse adding-double method is a useful approach with which to deduce the absorption and scattering coefficients.11,12 However, the RI value used in the calculation is a supposedly fixed value, which is actually varies during OC. Among the optical parameters of tissue, the complex refractive index (CRI) is an important one and is defined as .13 Here, is the real RI, and the imaginary RI, , satisfies . The extinction coefficient, , represents the energy loss per unit in certain direction caused by absorption and scattering, and .14 The total internal reflection (TIR) method is widely used to determine the of tissue15–17 and has been improved to measure the CRI of tissue.18–20 However, the TIR method and CRI have not been applied to evaluate the OC effect. In this paper, the TIR method is used to monitor the CRI change of natural dehydrated porcine muscle for the first time. A better tissue optical clarity induced by dehydration is observed. However, the change of CRI during dehydration is not monotonic. The heuristic particle-interaction model is utilized to qualitatively explain the change tendency of . Transmittance measurement of the natural dehydrated tissue is also performed, and the dynamic change of the transmittance is well explained by the change tendency of obtained from the CRI measurement. 2.Materials and Methods2.1.MaterialsPorcine muscle was selected as the sample. The fresh keeping cabinet provides a temperature of to 0°C. The tissue was sealed by preservative film to maintain freshness until it reached room temperature. Before measurement, the tissue was cut into with about a 2-mm thickness. Then the tissue was carefully attached to the prism for CRI measurement and to a slide glass for transmittance measurement. The air gaps between the interfaces should be avoided. 2.2.MethodFigure 1 is the schematic diagram of the CRI measurement setup, which is similar to that in Ref. 19. After passing through a beam splitter , a half-wave plate , a polarizer , and an aperture diaphragm D1, the -polarized He–Ne laser (632.8 nm) propagates into the prism and irradiates on the tissue. D2 is also an aperture diaphragm. is the real RI of the equilateral triangle prism ( at 632.8 nm). ,, and are the incident angle at the air–prism interface, the apex angle of the prism and the incident angle at the prism–sample interface, respectively. A detector PD1 is used to monitor the power shift of the laser. Detector PD2 is used to detect the emergent light from the prism. The prism is mounted on a rotation stage (PI, M-038), which is controlled by a Mercury C-863 servo motor controller. , , , and satisfy Based on the Fresnel equation,13 the reflectance at the prism–sample interface for the -polarized wave is given by where and are the real part and the imaginary parts of the CRI of sample, respectively. and are two intermediate variables that satisfyThen the reflectance at the prism–sample interface can be calculated as where and are the light powers of the emergent light and incident light, respectively, and is the power loss at the air–prism interface or prism–air interface.A nonlinear fitting program based on the Nelder–Mead simplex method21 is used to simultaneously calculate the and . For the tissue sample, the is the average or effective RI of the tissue components. The consistency between the measured data and fitting curve is described by , defined as , where is the ’th measured reflectance calculated by Eq. (5), is the ’th calculated reflectance, and is the mean value of measured reflectance over values of the incident angle. The value of ranges from 0 to 1 and it is closer to 1 when a reliable fitting is obtained. The reflectance curve of porcine muscle was measured at time points of 1, 2, 3, 4, 5, 6, 7, 8, and 10 h during dehydration. Similar measurements were repeated for three times. The schematic diagram of the transmittance measurement setup is shown in Fig. 2. A He-Ne laser is used as the incident light. PD1 is used as a monitor to detect the reflected beam from the beam splitter . The transmitted light vertically passes through the slide glass and the tissue and then is collected by an integrating sphere. PD2 is used to detect the emergent light from the integrating sphere. Transmittance measurement was also performed to investigate the OC effect of natural dehydration. The transmittance of the dehydrated porcine muscle was recorded with a time interval of 1 min for a total of 7 h. Similar measurements were repeated for three times. 3.Results and Discussion3.1.ResultsThe measured reflectance curves of natural dehydrated porcine muscle are shown in Fig. 3. The reflectance curve of the porcine muscle shifts toward the right direction with the increase in dehydration time. Based on the nonlinear fitting program mentioned above, all curves are well fitted with and the CRI values are determined, as demonstrated in Fig. 4. The increases continuously from 1.351 to 1.376 during a 10 h measurement, while does not increase continuously. During the first stage of natural dehydration (from 0 to 4 h), increases from 0.0015 to 0.0018. During the second stage (from 4 to 10 h), decreases to 0.0011. Finally, becomes smaller than the initial value. Fig. 3Reflectance curves of porcine muscle during dehydration. Points: measured reflectance. Line: fitted curves.  From the result of the transmittance measurement in Fig. 5, we find that the transmittance increases from about 0.15 to 0.38 in 7 h with a varied growth rate. The growth rates are about 0.003, 0.007, 0.022, 0.037, 0.061, and 0.077 at each 1-h time interval. 3.2.DiscussionThe increase of of porcine muscle during natural dehydration is observed, as shown in Fig. 4. A similar phenomenon can be found in Refs. 22 and 23. The optical parameters of tissue are known to depend on the water content,24 and both the natural dehydration and compression-induced dehydration can lead to an increase of .25 For the fresh porcine muscle, the measured is 1.351, which is smaller than the value of 1.367 provided in Ref. 19. This might be because the tissue fluid exuded out from the damaged tissue and increased the fraction of fluid at the prism–tissue interface. In our early study, the tissue fluid may lead to a hump in the reflection curve.20 However, the hump is not observed in this study, as shown in Fig. 3. The main reason may be the difference of tissue preparation. In this study, we used fresh porcine muscle without a freezing treatment, and high pressure was avoided when we attached the tissue to the prism. It can be seen from Fig. 5 that the growth rate of transmittance is slow during the first few hours and then becomes faster. A similar phenomenon can be found in Ref. 4. From the Bouguer–Beer–Lambert law, collimation transmittance in tissue can be calculated by , where is the thickness.26 Thus, both the thickness and the extinction coefficient influence the transmittance. The tissue will shrink due to the water loss and internal structure change, and the shrinkage will increase the transmittance. After 7 h, the thickness of the muscle reduced to about 74%. Considering the change tendency of observed in this study, we can deduce that the effects of thickness and on transmittance are opposite during the first stage and then become the same in the second stage. The opposite effects slow down the growth rate of transmittance in the first stage. In order to explain the change tendency of during dehydration, the heuristic particle-interaction model is applied. For a dense distribution of scattering particles, the reduced scattering coefficient () is related to the reduced scattering cross section () by , where is the volume fraction of the scattering particles and is the volume of a single scattering particle. The parabolic relationship between and is demonstrated in Fig. 6. Therefore, the volume fraction of scatters in tissue during dehydration needs to be estimated. Fig. 6Relationship between the reduced scattering coefficient and scattering particle volume fraction.  Five porcine muscle samples were weighed and then put into a temperature humidity chamber at 40°C for 72 h to obtain fully dehydrated samples. The weight fractions with an average of about 28% are calculated, as listed in Table 1. According to Ref. 27, the density of dry matter from bovine muscle is , where is the absolute temperature of the sample (measured in Kelvin). We use the data at 20°C (293 K) to estimate the density of fully dehydrated porcine muscle, and the volume fraction of water is deduced as about 0.788, which is close to the value 0.756 in rat skeletal muscle published in Ref. 28. So, the change of of the tissue should obey the parabolic form to some extent during dehydration. Assuming no change in RI of the ground substance and the size of the scattering particles in muscle, the change of the anisotropy factor is negligible;29 so, is approximately linear with . According to Ref. 26, for muscle tissue, is much larger than in the visual spectral region. We may infer that should obey the same change tendency as , which matches well with the result obtained in this study. After 10 h dehydration, the becomes smaller than the initial value, which reveals that the tissue is optically clarified. Moreover, structural modification or dissociation of collagen can also influence the OC result.30 Therefore, the CRI is a more suitable parameter to evaluate the OC effect. Table 1Weight fraction of fully dehydrated porcine muscle.
3.3.Error AnalysisIt is impossible to obtain two pieces of muscle tissue with exactly the same parameters and dehydration speed, but for different measurements, a similar phenomenon is observed. The time of each CRI measurement is about 1 min, which is much less than the dehydration time, so the change of the tissue can be ignored during each measurement. Therefore, most experimental errors come from the errors of incident angle and the power fluctuation. Error of the incident angle at the prism–tissue interface, , can be calculated by the differential of Eq. (1), which is The high resolution rotation stage has a minimum incremental motion of and a design resolution of ; so the error caused by the rotation stage is negligible. There is an error of about 0.01 deg when we adjust to zero. of the prism is less than 0.0002. . is calculated as 0.018 deg, which corresponds to an error of about 0.001 of . The error of is highly related to the power fluctuation. After being calibrated, the power fluctuation measured by PD2 is less than 0.5%, which corresponds to an error of 0.0001 of . 4.ConclusionOur experiment uses the TIR method as a useful approach to evaluate the OC effect and shows that CRI is an important optical parameter to understand the OC process. The results also indicate that natural dehydration can provide better tissue optical clarity, while the change of CRI is complicated. The real part of the CRI of porcine muscle increases continuously during the dehydration time, but the imaginary RI initially increases and then decreases. After enough time, the imaginary part of the CRI becomes much smaller than the initial value, revealing that a better tissue optical clarity is obtained. Further studies about OC are expected. AcknowledgmentsThe authors thank the Chinese National Key Basic Research Special Fund (Grant No. 2011CB922003), the Natural Science Foundation of China (Grant Nos. 61475078 and 61405097), and the International Science & Technology Cooperation Program of China (Grant No. 2013DFA51430). ReferencesV. V. Tuchin et al.,
“Light propagation in tissues with controlled optical properties,”
J. Biomed. Opt., 2
(4), 401
–417
(1997). http://dx.doi.org/10.1117/12.281502 JBOPFO 1083-3668 Google Scholar
A. Brunsting and P. F. Mullaney,
“Differential light scattering from spherical mammalian cells,”
Biophys. J., 14
(6), 439
–453
(1974). http://dx.doi.org/10.1016/S0006-3495(74)85925-4 BIOJAU 0006-3495 Google Scholar
J. M. Schmitt and G. Kumar,
“Optical scattering properties of soft tissue: a discrete particle model,”
Appl. Opt., 37
(13), 2788
–2797
(1998). http://dx.doi.org/10.1364/AO.37.002788 APOPAI 0003-6935 Google Scholar
C. G. Rylander et al.,
“Dehydration mechanism of optical clearing in tissue,”
J. Biomed. Opt., 11
(4), 041117
(2006). http://dx.doi.org/10.1117/1.2343208 JBOPFO 1083-3668 Google Scholar
H. Liu et al.,
“Dependence of tissue optical properties on solute-induced changes in refractive index and osmolarity,”
J. Biomed. Opt., 1
(2), 200
–211
(1996). http://dx.doi.org/10.1117/12.231370 JBOPFO 1083-3668 Google Scholar
C. G. Rylander et al.,
“Mechanical tissue optical clearing devices: enhancement of light penetration in ex vivo porcine skin and adipose tissue,”
Lasers Surg. Med., 40
(10), 688
–694
(2008). http://dx.doi.org/10.1002/lsm.v40:10 LSMEDI 0196-8092 Google Scholar
D. Zhu et al.,
“Recent progress in tissue optical clearing,”
Laser Photonics Rev., 7
(5), 732
–757
(2013). http://dx.doi.org/10.1002/lpor.2013.7.issue-5 LPRAB8 1863-8880 Google Scholar
A. N. Bashkatov et al.,
“Glucose and mannitol diffusion in human dura mater,”
Biophys. J., 85
(5), 3310
–3318
(2003). http://dx.doi.org/10.1016/S0006-3495(03)74750-X BIOJAU 0006-3495 Google Scholar
V. V. Tuchin, Optical Clearing of Tissues and Blood, SPIE Press, Bellingham, Washington
(2006). Google Scholar
L. Oliveira et al.,
“Optical measurements of rat muscle samples under treatment with ethylene glycol and glucose,”
J. Innovative Opt. Health Sci., 6
(2), 1350012
(2013). http://dx.doi.org/10.1142/S1793545813500120 JIOHAA 1793-7205 Google Scholar
S. C. Gebhart, W. C. Lin and A. Mahadevan-Jansen,
“In vitro determination of normal and neoplastic human brain tissue optical properties using inverse adding-doubling,”
Phys. Med. Biol., 51
(8), 2011
(2006). http://dx.doi.org/10.1088/0031-9155/51/8/004 PHMBA7 0031-9155 Google Scholar
T. Yu et al.,
“Quantitative analysis of dehydration in porcine skin for assessing mechanism of optical clearing,”
J. Biomed. Opt., 16
(9), 095002
(2011). http://dx.doi.org/10.1117/1.3621515 JBOPFO 1083-3668 Google Scholar
M. Bom and E. Wolf, Principles of Optics, Pergamon Oxford, NewYork, Pergamon
(1980). Google Scholar
L. Wang, S. L. Jacques and L. Zheng,
“MCML–Monte Carlo modeling of light transport in multi-layered tissues,”
Comput. Methods Programs Biomed., 47
(2), 131
–146
(1995). http://dx.doi.org/10.1016/0169-2607(95)01640-F CMPBEK 0169-2607 Google Scholar
C. Zhang et al.,
“Determination of the refractive index of a bacteriorhodopsin film,”
Opt. Lett., 19
(18), 1409
–1411
(1994). http://dx.doi.org/10.1364/OL.19.001409 OPLEDP 0146-9592 Google Scholar
Q. W. Song et al.,
“Modified critical angle method for measuring the refractive index of bio-optical materials and its application to bacteriorhodopsin,”
J. Opt. Soc. Am. B, 12
(5), 797
–803
(1995). http://dx.doi.org/10.1364/JOSAB.12.000797 JOBPDE 0740-3224 Google Scholar
J. Wang et al.,
“Study of dynamic pressure-induced refractive index change using derivative total reflection method,”
J. Biomed. Opt., 18
(11), 117005
(2013). http://dx.doi.org/10.1117/1.JBO.18.11.117005 JBOPFO 1083-3668 Google Scholar
H. Ding et al.,
“Refractive indices of human skin tissues at eight wavelengths and estimated dispersion relations between 300 and 1600 nm,”
Phys. Med. Biol., 51
(6), 1479
(2006). http://dx.doi.org/10.1088/0031-9155/51/6/008 PHMBA7 0031-9155 Google Scholar
Q. Ye et al.,
“Measurement of the complex refractive index of tissue-mimicking phantoms and biotissue by extended differential total reflection method,”
J. Biomed. Opt., 16
(9), 097001
(2011). http://dx.doi.org/10.1117/1.3615657 JBOPFO 1083-3668 Google Scholar
J. Wang et al.,
“Effect of tissue fluid on accurate determination of the complex refractive index of animal tissue,”
J. Biomed. Opt., 17
(7), 075011
(2012). http://dx.doi.org/10.1117/1.JBO.17.7.075011 JBOPFO 1083-3668 Google Scholar
J. A. Nelder and R. Mead,
“A simplex method for function minimization,”
Comput. J., 7
(4), 308
(1965). http://dx.doi.org/10.1093/comjnl/7.4.308 CMPJA6 0010-4620 Google Scholar
L. Oliveira et al.,
“Optical characterization and composition of abdominal wall muscle from rat,”
Opt. Lasers Eng., 47
(6), 667
–672
(2009). http://dx.doi.org/10.1016/j.optlaseng.2008.12.005 OLENDN 0143-8166 Google Scholar
S. Patel, J. L. Alió and J. J. Pérez-Santonja,
“Refractive index change in bovine and human corneal stroma before and after LASIK: a study of untreated and re-treated corneas implicating stromal hydration,”
Invest. Ophthalmol. Vis. Sci., 45
(10), 3523
–3530
(2004). http://dx.doi.org/10.1167/iovs.04-0179 IOVSDA 0146-0404 Google Scholar
A. N. Bashkatov, E. A. Genina and V. V. Tuchin,
“Optical properties of skin, subcutaneous, and muscle tissues: a review,”
J. Innovative Opt. Health Sci., 4
(1), 9
–38
(2011). http://dx.doi.org/10.1142/S1793545811001319 JIOHAA 1793-7205 Google Scholar
A. A. Gurjarpadhye et al.,
“Effect of localized mechanical indentation on skin water content evaluated using OCT,”
Int. J. Biomed. Imaging, 2011
(17), 817250
(2011). http://dx.doi.org/10.1155/2011/817250 IJBIBD 1687-4196 Google Scholar
V. V. Tuchin, Tissue Optics: Light Scattering Methods and Instruments for Medical Diagnosis, SPIE Press, Bellingham, Washington
(2007). Google Scholar
V. P. Latyshev, M. N. Gritsyn and N. A. Tsyrulnikova,
“Study of thermophysical properties of food products in the temperature range 77–373 K,”
in Proc. All Union Research Institute of Refrigerating Industry,
119
–33
(1980). Google Scholar
R. F. Reinoso, B. A. Telfer and M. Rowland,
“Tissue water content in rats measured by desiccation,”
J. Pharmacol. Toxicol. Methods, 38
(2), 87
–92
(1997). http://dx.doi.org/10.1016/S1056-8719(97)00053-1 JPTMEZ 1056-8719 Google Scholar
R. Graaff et al.,
“Reduced light-scattering properties for mixtures of spherical particles: a simple approximation derived from Mie calculations,”
Appl. Opt., 31
(10), 1370
–1376
(1992). http://dx.doi.org/10.1364/AO.31.001370 APOPAI 0003-6935 Google Scholar
A. T. Yeh et al.,
“Reversible dissociation of collagen in tissues,”
J. Invest. Dermatol., 121
(6), 1332
–1335
(2003). http://dx.doi.org/10.1046/j.1523-1747.2003.12634.x JIDEAE 0022-202X Google Scholar
BiographyZhichao Deng is a PhD student at Nankai University of Tianjin, China. He graduated in the School of Physics from the same university in 2011. Currently, he is mainly engaged in research on biomedical photonics. He has about five years of experience in the study of tissue refractive index. Jin Wang received her master’s degree in biomedical engineering in 2007 and then joined the School of Physics, Nankai University, China. She received her PhD in optics from Nankai University, China, in 2013. Her research interests include optical clearing, refractive index measurement of biotissue, and optical coherence tomography. Yuanze Liu completed his bachelor’s degree in physics from Jilin University, China, in June 2013. During this time, he completed all his foundation courses and professional courses. Currently, he is studying for his master’s degree in Nankai University. His studies cover the field of the total reflection method and the dispersion spectrum of biological tissue. Qing Ye received his PhD degree in optics from Nankai University, China, in 2008 and then joined the School of Physics, Nankai University. Since 2010, he has been an associate professor of optics at Nankai University specializing in optical coherence tomography, optical clearing, and optical properties measurement of biotissue. Tengqian Sun completed his bachelor’s degree in the School of Physics from Nannkai University, China, in June 2011. Currently, he is studying for a doctor’s degree in the School of Physics from Nankai University. His PhD studies cover the refractive index microimaging of biomedical, waveguides, and nonlinear materials. He has four years of experience in optical imaging. Wenyuan Zhou received his master’s degree and doctoral degree in 1996 and 2002, respectively. From 2003 to 2012, he worked as an associate professor at Nankai University. Since 2012, he has been a professor of optics at Nankai University. His main research includes high sensitive photon detection, photon imaging technology, and application of biological sensor. Jianchun Mei completed his master’s degree in the School of Physics from Nankai University, China, in 2010. The same year, he became an engineer and started to work in the Advanced Technology Institute, Nankai University. He is mainly engaged in the research of photoelectric detection and optical instrument design. Chunping Zhang has been a professor of physics at Nankai University since 1995. His main research includes optical properties and applications of photochromic materials and biomedical photonics. Jianguo Tian received his PhD from Nankai University in 1991 and then started to teach in the same university as an assistant professor. In 1995, he became a professor. Since 2001, he has become a specially appointed professor at Nankai University. He is mainly engaged in condensed matter physics and photonics, involving optical nonlinear mechanism and application of photoelectric material properties. |