|
|
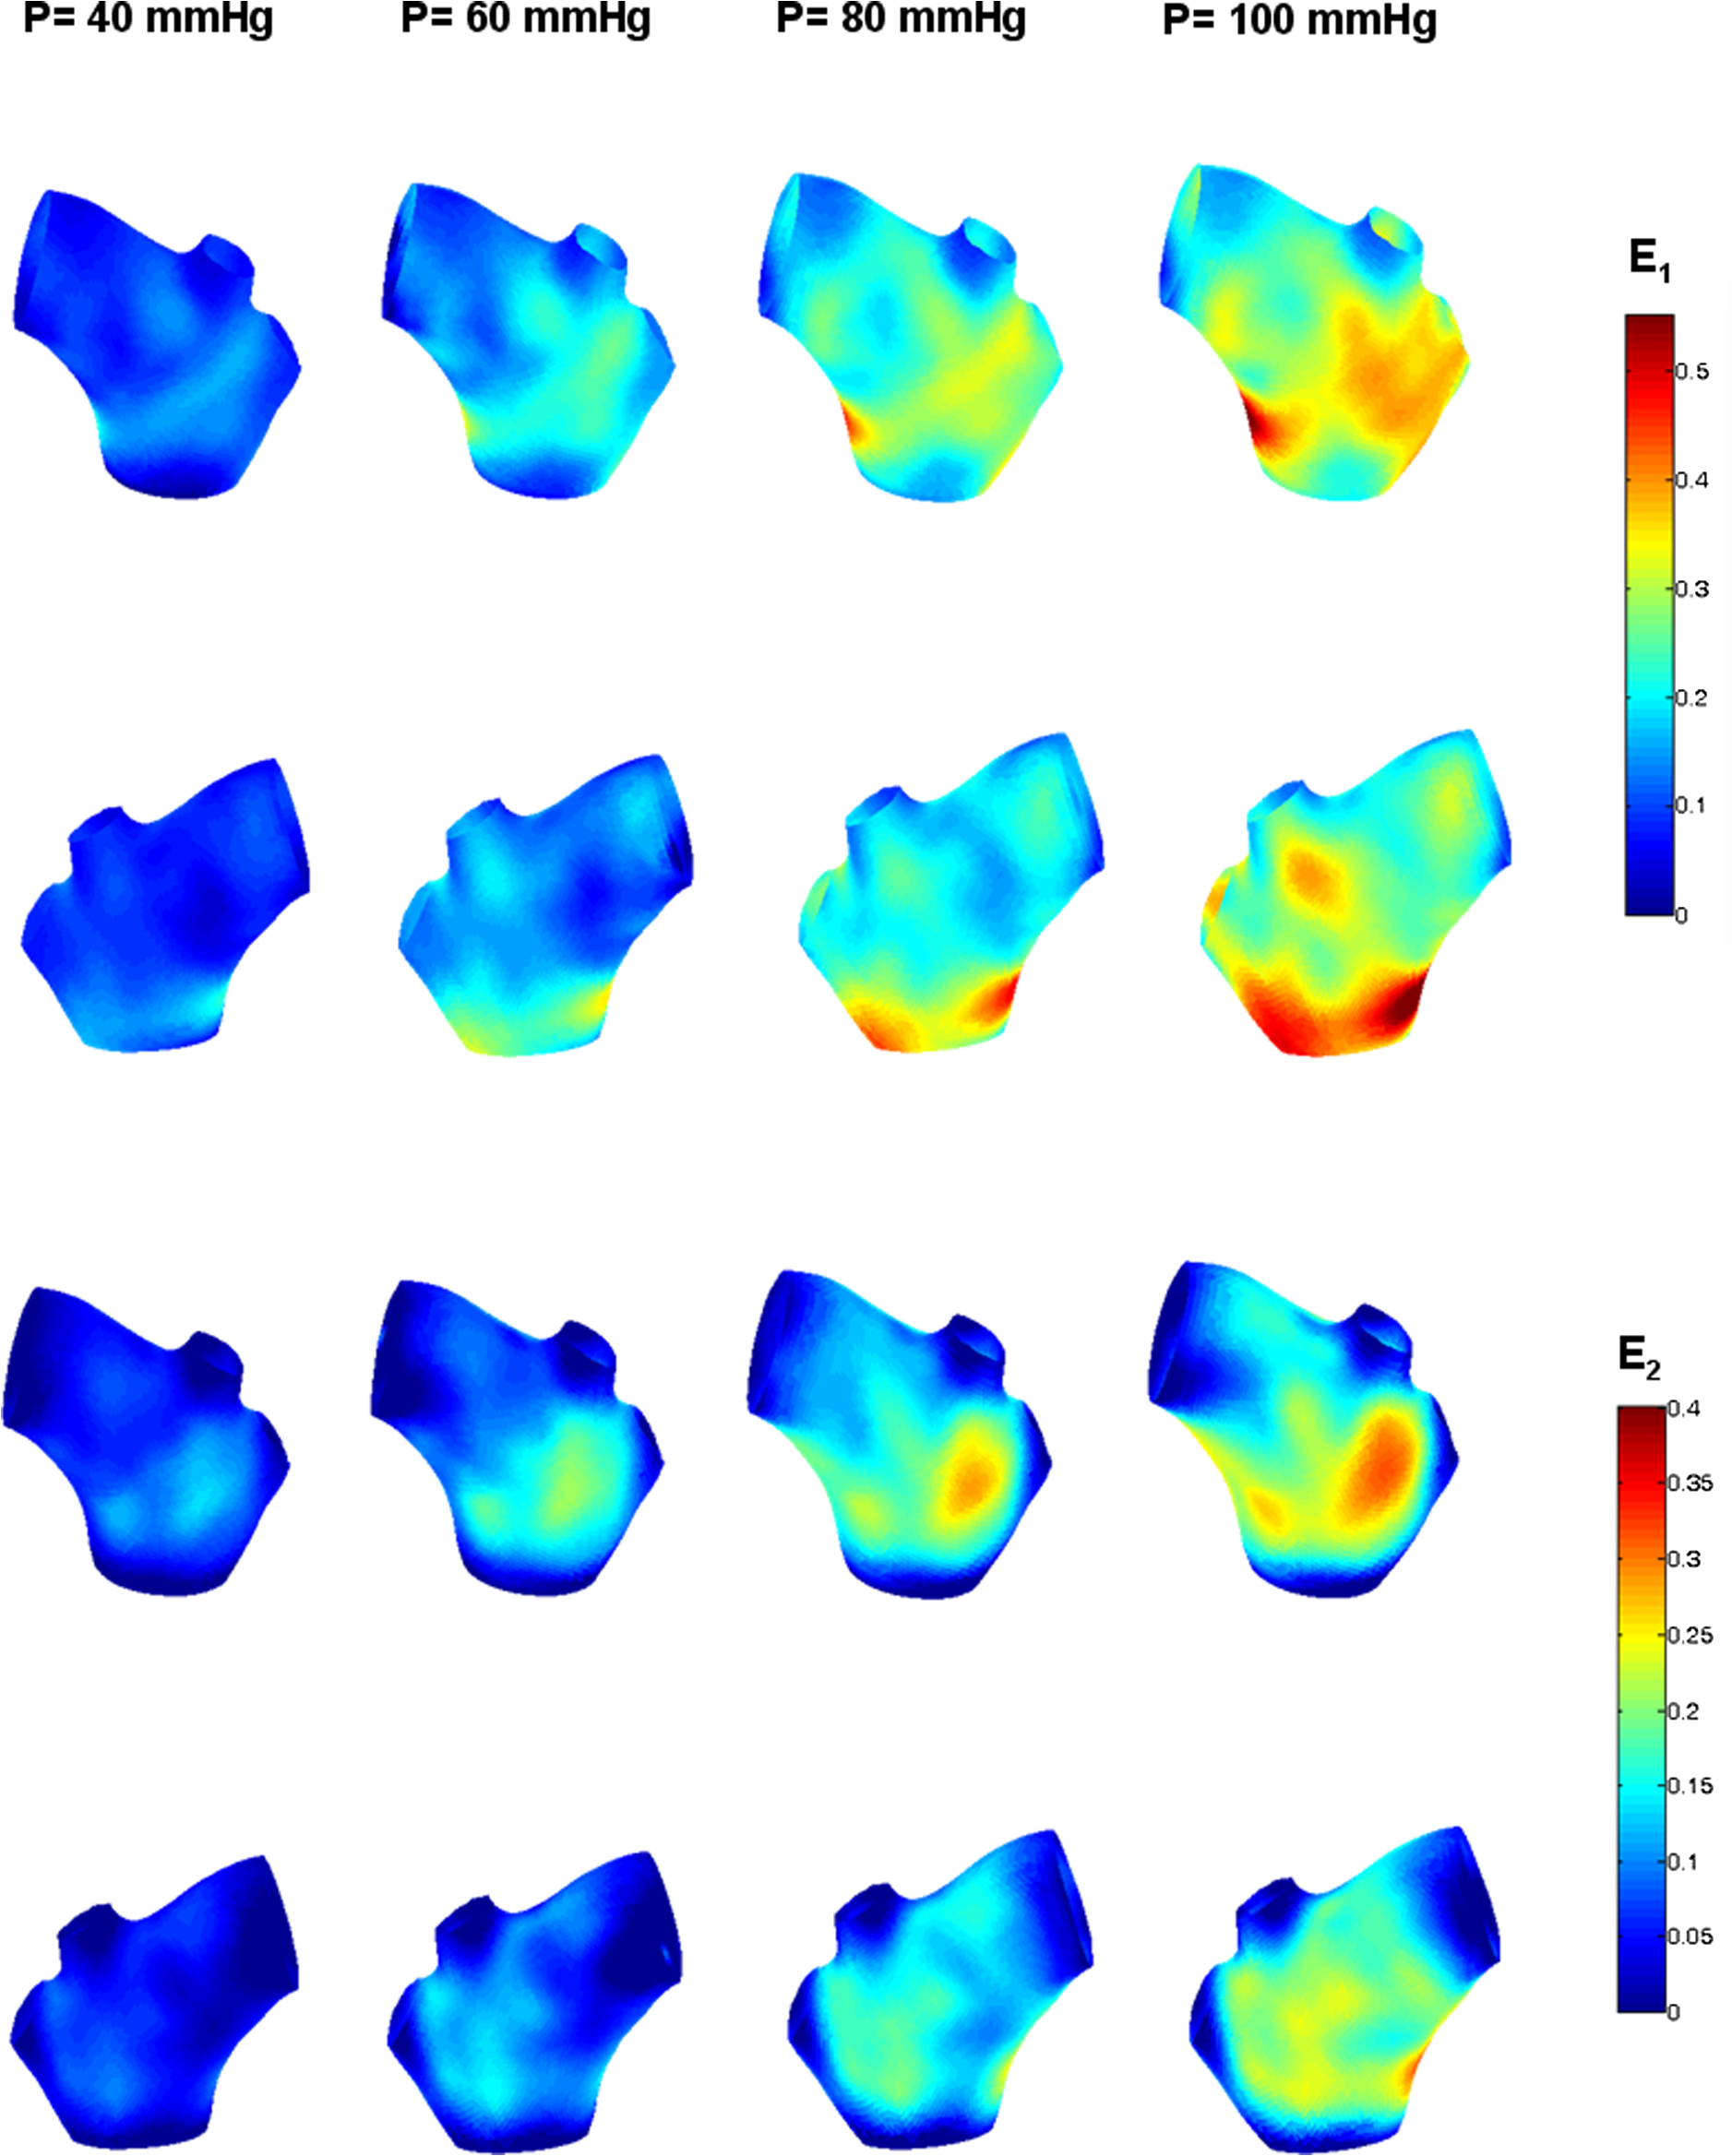
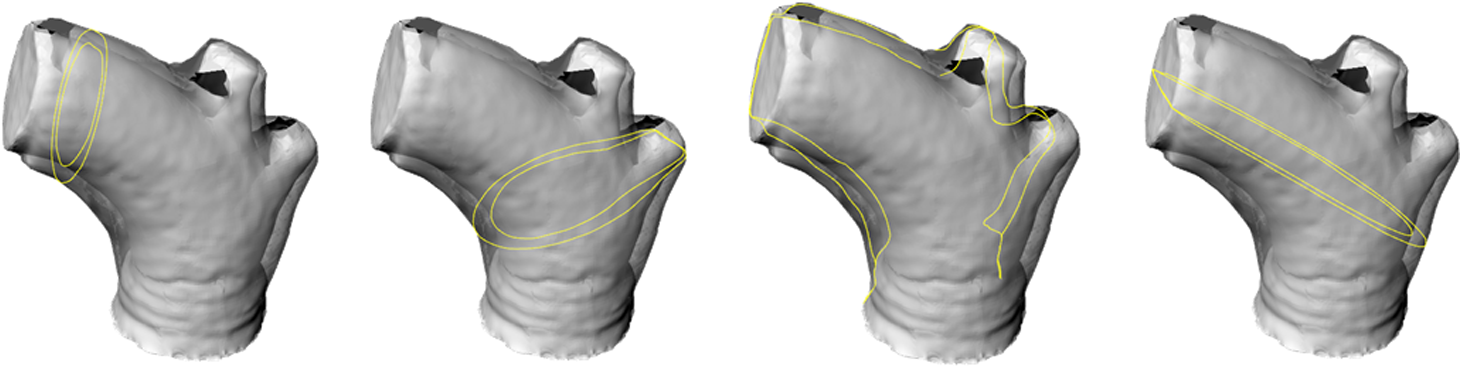
1.IntroductionBiomechanics of the aortic arch has increasingly become the subject of experimental and computational investigations given its important roles in cardiovascular disease.1–9 Computational fluid–structure interaction (FSI) models are among the most effective tools for investigating interactions among the geometry, mechanical properties, and hemodynamics of such a complex vascular structure. In particular, the aortic arch has a nonplanar curvature, it branches and tapers along its long axis, and it undergoes cyclic multiaxial loading resulting in distension, bending, extension, and possibly torsion. Recent advances in medical imaging and computational methods have enabled a shift from rigid-wall (e.g., Ref. 9) to deformable-wall10 models, thus allowing one to consider the effects of the wall mechanics on blood flow and pressure and conversely the effects of the hemodynamics on wall mechanics. Although sophisticated, these models remain limited by the lack of information on regionally varying mechanical properties and wall thickness, which cannot be obtained from standard testing protocols. Experiments designed to characterize the passive mechanical behavior of the thoracic aorta include standard uniaxial,2,11–14 biaxial,13,15–19 and inflation tests.20 In addition, a human arch has been tested in its natural configuration (without branches) to determine its global response to bending, axial stretching, and pressurization within standard test rigs.2 Although biaxial tests remain the most popular, they are not without limitations. Planar biaxial tests require “flattening” the aortic sample, which likely introduces complex stresses given that these thick, anatomically curved specimens do not collapse when cut. Similarly, biaxial inflation and extension tests require “straightening” the specimen, which again likely introduces complex stresses associated with bending. Although both of these standard biaxial tests can capture the anisotropy, common assumptions include material homogeneity and constancy of thickness over the central area of testing (usually not smaller than to limit edge effects). Such low spatial resolution contrasts with modern mechanobiological concepts, in which cells tend to offset complexities in geometry or loading with material heterogeneities, whether induced by changes in material properties or thickness, or both.21 This paper melds multiple advanced optical techniques to address the challenge in vitro of measuring regional variations in surface strain and wall thickness of the aortic arch in its native configuration at high spatial resolution. Growing interest in the potential offered by dense sets of experimental data obtainable with full-field optical methods is revealed by the recent increase in studies using digital image correlation,22 fringe projection (FP),23 or optical coherence elastography24 to quantify regional variations in the mechanical properties of biological tissues.25–29 The purpose of the present work was twofold: first, to combine standard and panoramic-digital image correlation (i.e., DIC and p-DIC) to measure in vitro the geometry and full-surface deformation of a pressurized porcine aortic arch in a near native configuration and second, to use a panoramic-fringe projection (p-FP) method to measure, over 360 deg, any regional variations in wall thickness in the unloaded state. These coupled sets of geometrical and mechanical data promise to enable greater insight into the interplay between structure and function of the aortic arch by providing data sufficient for modern inverse-based methods for nonlinear material characterization. 2.Materials and MethodsFollowing a series of pilot experiments, a representative normal porcine aortic arch (male pig, 8 months of age, and body mass) was obtained fresh from a local abattoir, rinsed with phosphate buffered solution (PBS), and tested within a few hours. Specifically, to preserve the native shape of the arch [Fig. 1(a)], from the sinotubular junction (proximal end) to the ligamentum arteriosum (distal end), custom computer aided design (CAD) designed polyvinyl chloride (PVC) plugs (Young’s modulus and Poisson’s ratio ) were used to occlude the distal lumen and the lumens of the brachiocephalic trunk and left subclavian artery [Fig. 1(b)]; a circumferential slot in the plugs allowed precise positioning of ligatures that held each plug in place during testing [Fig. 1(c)]. The proximal lumen was connected to a steel cannula through a custom-sized polytetrafluoroethylene (PTFE or Teflon) adapter to allow pressurization of the entire arch and branches [Fig. 1(c)]. Just prior to testing, a random pattern was created on the outer (adventitial) surface using a fine-tipped airbrush and black and white Indian ink. The tissue was moistened continually via a saline spray during preparation and it was immersed in PBS for 1 h at room temperature after the random pattern was applied. This equilibration period allowed the specimen to rehydrate prior to data collection. Fig. 1(a) The porcine aortic arch tested in this study in its unloaded configuration and (b) after cannulation and preparation for testing within the panoramic-digital image correlation (p-DIC) apparatus. (c) Also shown is a schematic drawing of the cannulated sample with the distal end and supra-aortic vessels occluded with custom polyvinyl chloride (PVC) plugs, having circumferential slots, and the proximal end connected to a steel cannula via a custom polytetrafluoroethylene (PTFE) adapter. The specimen was pressurized through the steel cannula.  2.1.Full-Surface DIC Measurement of Geometry and DeformationThe combined use of standard DIC and p-DIC to capture the full geometry and surface deformation of noncylindrical samples is described elsewhere, together with a detailed report on its metrological performance.28 Briefly, the p-DIC method uses a 45-deg concave conical mirror to image the lateral surface of a sample that is placed within the mirror and viewed from above with a single camera (Fig. 2). Using a series of translation/tilting and rotation mounts, the camera can be aligned and then moved with high accuracy through a series of evenly spaced angular positions to obtain multiple inclined views of the sample within the mirror. In this way, stereo (i.e., three-dimensional) measurements are obtained via principles of computer vision: on the upper portion of the sample by imaging directly from above via standard DIC and on the lateral surface via reflections from the conical mirror using principles of p-DIC. The requisite random pattern on the surface (Fig. 3, left) allows the matching of image pairs and effectively point-to-point deformation tracking using custom codes written in MATLAB. The two reconstructed portions of the sample (standard and p-DIC) are automatically merged in a single reference system defined by a calibration dot pattern affixed to the upper portion of the conical mirror. Fig. 2Schematic drawing of the panoramic-DIC system. The cannulated aortic arch is placed within a conical mirror and imaged from above with a camera mounted on a four-axis stage. The cannula is connected below to a syringe and a pressure transducer through a three-way stopcock.  Fig. 3(a and b) Illustrative images of the specimen as imaged in the p-DIC system plus three views of the corresponding reconstructed geometries at two pressure levels: top row and bottom row .  Once placed within the conical mirror, the proximal end of the cannulated aortic arch was connected to a syringe and pressure transducer and subjected to eight preconditioning loading/unloading cycles from 0 to 80 mmHg at a rate of . Then, the sample was tested over the physiological range of 0 to 120 mmHg in steps of 20 mmHg, with a pause of 3 min between steps to allow tissue recovery and subsequent image acquisition. Pilot studies revealed that viscoelastic effects were negligible when using this protocol. Data were collected with a spatial resolution of and a measurement accuracy of ,28 which characterized the geometry of the whole aortic arch throughout pressurization (Fig. 3). Figure 4 illustrates the procedure used to reduce the raw data to extract full-field deformation maps. First, an optimization-based procedure coded in MATLAB (using the fmincon function) determined the parameters of the coordinate transformation (components of the rotation matrix and translation vector) that mapped original data points into a “toroidal” coordinate system (), where the geometry best-fit a torus having and as major and minor radii (set as design variables), respectively. Hence, data points were expressed in toroidal coordinates , where Fig. 4Schema of the p-DIC data processing procedure for the aortic arch. An optimization-based procedure finds the coordinate transformation that allows the (a) data to best fit a (b) torus; then, the (c) toroidal coordinates are mapped into (d) a Cartesian coordinate system representation having , and as axes coordinates.  Finally, each data point was mapped onto a “planar” Cartesian coordinate system having the poloidal angle , toroidal angle , and radius as coordinate axes. Such a mapping of a closed surface onto a planar one allows straightforward, robust data fitting using nonuniform rational B-splines (NURBS) in the Rhinoceros CAD environment. Before smoothing, the original data ranging within were considered twice over the domain to avoid border effects (only the original data are shown in Fig. 4 for purposes of clarity). By selecting a proper choice of horizontal and vertical spans and stiffness for the NURBS, it was possible to iteratively exclude effects of outliers and to achieve active control of the fidelity of the final smoothed data. Once the planar shape was smoothed, it was possible to disregard the original evenly spaced data points coming from regular DIC grids and to remesh the NURBS with an optimal mesh generated with standard finite element software. Finally, the invertible relationships [Eq. (1)] allowed the planar mesh to be mapped back to corresponding counterparts in the toroidal and then the original Cartesian coordinate systems. Displacement maps expressed in planar coordinates [e.g., for the component of displacement and similarly for the other components] could be smoothed similarly to obtain each deformed configuration from the undeformed reference. If a fine triangular mesh is used to discretize the overall geometry, the components , , and of the surface Green strain tensor can be obtained easily by assuming a homogenous strain field within each triangular subdomain ( facets, average area) with respect to local () coordinate systems by following a procedure described elsewhere.30 Specifically, if the axes of each local system are defined to be parallel to the toroidal and poloidal directions of the best fitting torus, and roughly correspond to axial and circumferential strains. Finally, by solving the eigenvalue problem for , it is possible to compute the principal strains, and (Fig. 5) and principal directions (Fig. 6) “pointwise” over the entire surface of the sample. This procedure allows one to capture regional deformations with a spatial density consistent with the resolution of the DIC measurement. Fig. 6Dorsal and ventral views of principal directions (thin lines) for strain for the aortic arch at with the primary directions denoted by superimposed thick lines. 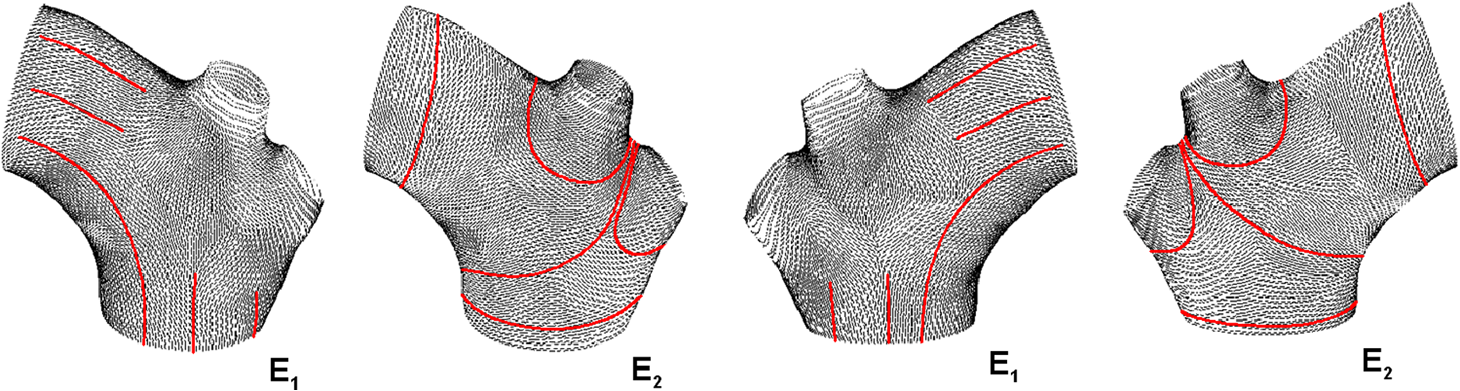 Full-field experimental data can be exploited in many ways. Dense sets of data enable inverse material characterization to extract regionally varying mechanical properties (see Ref. 28). The data can also be averaged over quadrilateral patches at different sites of interest to highlight regional differences in strain magnitude and direction, including principal values and directions. For example, Fig. 7 shows principal strains as a function of pressure for six patches. These patches (each with elements, depending on location) were defined by starting with quadrilateral meshes having sides parallel to the poloidal and toroidal directions, which resemble square patches having borders aligned with the circumferential and axial directions of common biaxial tests. Note the variations in mechanical response along the circumferential direction and with increasing distance from the heart. Figure 8 summarizes these results by clustering patches from Fig. 7 into two groups, proximally and distally located. All differences, if not otherwise indicated, were statistically significant based on a one-parameter analysis of variance (with ) performed using the MATLAB statistical toolbox. Fig. 7Pressure–strain curves at different locations; plotted values are averaged over the region of interest that is shown as a dark patch.  Fig. 8Summary of the principal strain–pressure experimental data. Proximal and distal regions of interest from Fig. 7 were clustered in two groups, averaged, and compared statistically by group (). 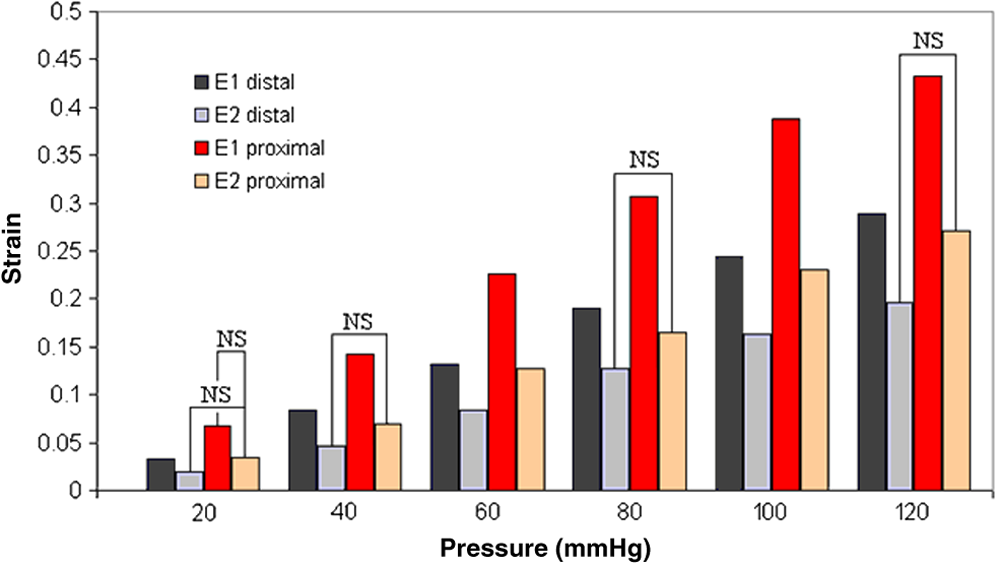 Finally, quantification of the entire geometry at multiple pressures can be used to calculate global metrics of arterial stiffness (e.g., pressure-strain modulus or distensibility ), thus enabling a comparison with in vivo measurements. A recent review of data from uniaxial, biaxial, and extension–distension tests on human aorta shows the utility of extracting the associated values of material stiffness and other relevant clinical metrics to be used in FSI and fluid-solid-growth simulations.31 2.2.360-deg FP Measurement of Wall ThicknessThe complexity of the geometry and composition of the wall for curved and bifurcating vessels have long presented a challenge for experimentalists.30,32 Figure 9 shows the representative aortic arch studied herein cut along the plane of symmetry with wall thickness overlaid as a color map obtained by manually processing the digital images in a two-dimensional CAD software package. Note the thickening of the wall at the flow divider. Common methods of measuring thickness33 would be inadequate in cases of such strong gradients in thickness due to insufficient accuracy and spatial resolution, not to mention reproducibility. Hence, we developed and present a novel p-FP method to measure the distribution of the wall thickness over the entire specimen. FP23 is a well-established optical technique that enables high-resolution, noncontact, full-field (i.e., pixel-by-pixel) reconstructions of complex objects at video frame rates. Fig. 9Contrast-enhanced picture of the specimen cut along the plane of symmetry with overlaid color maps showing the large variability of wall thickness (, ).  A standard FP profilometry system consists of a projection unit [typically a commercial liquid crystal display (LCD) projector], an image acquisition unit, and a data processing unit. When a computer-generated sinusoidal fringe pattern is projected onto the surface of the object at a given angle with respect to the viewing direction (Fig. 10), fringes arise that relate (assuming the projected light is collimated and the diffused light is observed from infinity) the height at a given point with respect to a reference plane (here the plane, with the axis coincident with the camera axis, i.e., ) and the light phase , namely where is the frequency of the sinusoidal fringe pattern and is a calibration factor. The phase of the modulated fringe pattern acquired by the camera can be obtained via different fringe analysis strategies.23 In this work, we utilized a phase-shifting method, where four synthetic sinusoidal fringe patterns with a relative phase shift were sequentially projected onto the object surface. Image processing (see Ref. 23) yielded a wrapped phase distribution (with a sawtooth-like gray-scale pattern; central panel in Fig. 11) and after unwrapping, a continuous phase distribution that was proportional to variations in height over the object surface [see Eq. (2)]. To profile an object over 360 deg, we adopted the common strategy of placing the sample on a turntable and repeating the measurement at evenly spaced angles of revolution.34Fig. 10Picture of the 360-deg fringe projection (FP) system used to retrieve the outer and inner topology of the aortic arch.  Fig. 11Typical image captured at 30-deg steps for the 360-deg FP measurement (a)–(c) before and (d)–(f) after removing the (a, d) aortic wall, with (b, e) corresponding wrapped phase maps and (c, f) reconstructed shapes.  Figure 10 shows our p-FP (i.e., 360 deg) set-up. After completing all mechanical testing in the DIC/p-DIC system (Fig. 2), the PVC caps that occluded the distal outlet and two supra-aortic branches were removed by cutting the sample with a scalpel along the ligatures. The sample was then fixed to a cylindrical calibration post (38.1 mm diameter) and filled with a monocomponent polyurethane (PU) spray foam to cast the inner cavity (Fig. 11). This material was preferred over other commonly used casting resins because it is lightweight, it hardens within 10 minutes with no sensible exothermic reaction, and its excess can be easily removed with a cutter. The sample was protected from dehydration during the curing period by wrapping it in saline-soaked gauze. Next, the surface was gently dried with a cloth to prevent water drops from creating light spikes that could compromise the p-FP measurement. A series of four computer-generated sinusoidal patterns were then projected onto the surface using a commercial LCD projector. Both the sample and a CMOS camera (B/W, 8 bit, , 30 fps equipped with a 28 to 105 mm lens) were mounted on multiaxis stages for fine positioning and adjustment within the light path. The sample was then rotated around a vertical axis at 30 deg steps using an ultraprecision rotation mount (0.001-deg resolution; Fig. 10) and at each angular position, sets of four images were captured to create the phase map (Fig. 11, central panel) and hence the shape [through Eq. (2)] of the imaged portion (Fig. 11, right panel). Following a full rotation, with the sample still in place, the arterial wall was cut with a scalpel into two halves along the plane of symmetry (Fig. 9), thus leaving the inner cast for a second series of measurements (Fig. 11, lower panel). Corresponding portions of the outer and inner geometries (Fig. 11, right column) were thus reconstructed relative to the same reference system. Alignment of the axis of revolution necessary to merge the shape patches into a full 360-deg shape was achieved by matching a dot pattern on a target plane before and after a known rotation (see Ref. 34). The phase-to-height conversion was possible only after the factor [Eq. (2)] was evaluated through a common calibration procedure.35,36 The current p-FP system had a sensitivity of and a nominal height resolution of 0.044 mm. The reconstruction of the calibration cylinder placed at the base of the sample (visible in Figs. 10 and 11) revealed an accuracy in shape reconstruction on the order of (calculated as the standard deviation of the measured radius with respect to the nominal radius of the post). Since p-FP is a full-field technique, its spatial resolution can be chosen down to the camera resolution of . Herein, however, image data were sampled with a 10 pixel spacing to save computational time. Figure 12 shows two reconstructed inner and outer geometries with noteworthy cross-sections highlighted to emphasize the large variability in wall thickness, especially in regions of branching (missing portions of the geometry occur where the surface was covered by a shadow). A full map of the thickness distribution was obtained by pulling each of the over 24,000 measured points of the inner surface toward the outer surface in the normal direction to find the corresponding points. The Euclidean distance between each point-pair is a measure of the local wall thickness (Fig. 13). 3.DiscussionThis study sought to illustrate how three different optical techniques can be combined to obtain a detailed geometrical model of complex regions of the vasculature, such as the aortic arch, together with information on regionally varying strains and thicknesses sufficient for inverse characterizations of the underlying nonlinear and possibly anisotropic material properties. As an illustrative example, a normal porcine aortic arch was tested first in a combined standard and p-DIC device to obtain a full-surface deformation map over a physiological range of pressure. Then, the outer and inner surfaces were quantified with a p-FP system to create a wall thickness map. Regionally varying mechanical and geometrical properties, extracted from the same sample, promise to improve our ability to better quantify regional wall mechanics. Although this work focused primarily on illustrating the combined capabilities offered by multiple optical approaches, some relevant biomechanical information can be extracted from the results. It is important to note, however, that although the entire procedure can be applied to the human aortic arch, the mechanical behavior of the proximal aorta can differ significantly between humans and pigs.17 Thus, the present results should not be extended directly to the human. Nevertheless, because of the paucity of experimental data on porcine aortic arch, data from uniaxial and biaxial tests on the ascending and proximal descending thoracic aortas from pigs and humans were used as references for comparison and discussion. Comparing undeformed and deformed geometries (Fig. 3) and observing the heterogeneous strain maps (Fig. 5) confirmed the expected increase in arterial stiffness with increasing distance from the heart. The maximum registered strain of 50% occurred in the proximal segment of the inner curvature in the axial direction (Fig. 5) where large deformations and rigid body motions have been observed in vivo due to the downward movement of the aortic root during the cardiac cycle.5,37 Plots of strain distributions (Fig. 5) suggested further that the arch tissue exhibited higher stiffness in the circumferential than in the axial direction with an anisotropic ratio, AR (defined as the ratio of the first and the second principal strains) ranging from 1.0 to 2.2, with a mean value of (at 80 mmHg). This value of the degree of anisotropy is consistent with most experimental reports on the human and porcine proximal aorta,12,13,17,19,20 with few exceptions of reported near isotropy [see Ref. 3 for human aortic arch and Ref. 15 for the human ascending aorta]. Strains along the axial and circumferential directions were close to the principal values and , respectively, over most of the surface of the main vessel (data not shown), hence explaining the near absence of shear strains in square specimens subjected to biaxial tests when cut along axial and circumferential directions. Consistently, the direction of principal strain aligned with the axial and circumferential directions away from the branches (Fig. 6). Interestingly, in regions of major branches, the least extensible direction formed concentric lines around the branches, also consistent with prior reports.38,39 In addition, the direction associated with ran along the apical ridge in regions between the supra-aortic branches (Fig. 9), presumably consistent with strongly aligned bundles of collagen fibers [see Refs. 32 and 40 for similar results in other arterial regions] and consistent with results numerically predicted based on either stress- or strain-based remodeling theories.38,39 When the strain data were averaged over quadrilateral patches in different locations (far from the ligatures to exclude effects of a near rigid boundary condition imposed by the PVC plugs and the PTFE adapter—see plots in Fig. 5), the associated results (Fig. 7) suggested that the tissue was stiffer (albeit thinner) on the outer curvature than on the inner curvature [see Refs. 16 and 41 for data on the human ascending aorta] and that the dorsal side was less stiff (albeit thicker) than the ventral side [unlike in Ref. 19 for the porcine ascending aorta]. Further averaging of strains from proximal and distal segments (Fig. 8) again revealed significant anisotropy and marked stiffening with increasing distance from the heart. Interestingly, the pressure-Green strain curves in Fig. 7 were nearly linear over the physiological range of pressure (strain up to 40%), consistent with studies reporting biaxial data on proximal porcine aortas.11,12,17,19 This quasilinear behavior, not observed for aged human ascending aortic tissue,15,17 has been suggested to be due to the relative young age of pigs at the time of slaughter (6 to 9 months, relative to a normal lifespan of 15 to 20 years) and the higher elastin: collagen ratio.14,17 Stephens and Grande-Allen42 suggest that aortic root tissue in a 6-month old pig is comparable to a 17- to 19-year old human. The distensibility and pressure-strain modulus for the proximal and distal portions of the aortic arch tested in this study (, , , ) were indeed comparable with those obtained for human ascending aortas in 10- to 20-year-olds.31 The p-FP method for measuring regional thickness was used here for the first time; although the optical approach is appropriate and robust, the casting protocol for obtaining the inner geometry needs to be refined. For example, the PU foam had a high porosity, and large voids were present at the base of the sample where the resin could not attach to the PTFE adapter (Fig. 11). Possible solutions are: (1) to prevent the rapid expansion of the foam during the first few minutes of the curing process by occluding the openings and (2) to use a different material for the lower cannula adapter. Moreover, the invalid areas reported in grey in Fig. 13 were due to shadows close to and between the supra-aortic vessels. Such “data voids” are not inherent to the technique and can be eliminated by fixing the sample to an adjustable mount that properly orients it with respect to the incoming light to avoid shadows. Nevertheless, Fig. 13 reveals considerable regional variations in the wall thickness ranging from 0.45 to 3.86 mm, with a mean of . Hence, important features were captured, such as the expected thickening at the inner curvature,1,41,43 the curving ridge at the flow divider,32 the nonuniform thickness of the branches along their circumference, and their gradual thinning with increasing distance from the arch (compare Fig. 13 to Fig. 9). The possibility of mapping wall thickness in vessels from large animals or humans (i.e., with thick walls) will enable advances in understanding the interplay among geometry, composition, mechanical behavior, and applied loads as needed to improve our understanding of the mechanobiology.21 In particular, regions of branching are structurally complex, with strong anisotropy and high variability in thickness.32 Although particularly important from the perspectives of both wall mechanics and hemodynamics (because of aneurysms and atherosclerosis often occur at or near branches), prior mechanical studies have typically been oversimplified by assumptions of homogeneous and isotropic material properties and constant thickness (see Ref. 3), which can render the associated results questionable based on our expectations of mechanobiological control. Similar assumptions in other areas of complexity, such as abdominal aortic aneurysms, likely lead to similar concerns.44,45 Our overall approach was illustrated for a porcine aortic arch, but it is suitable in principle for studying the human arch due to similarities in shape and size between the two species. It is possible, however, that specific differences in geometry, size, and location of the branches could affect the extent of the surface measured with DIC resulting from hidden regions, shadows, and undercuts. A proper choice of the size of the conical mirror and the adoption of adjustable custom-designed adapters for sample cannulation should overcome most geometrical limitations. Although the proposed experimental protocol represents a new approach to more realistically reproduce in vivo loading conditions for the aortic arch, particularly relative to common biaxial and inflation tests, some important limitations remain. First, realistic in vivo boundary conditions (e.g., tethering of surrounding tissues) are still challenging to reproduce in an in vitro test-rig30 despite being important for eventual FSI simulations.46 Second, in contrast to common elastographic modalities (e.g., ultrasound, magnetic resonance, or optical coherence tomography based; Ref. 24), our DIC-based approach only allows surface, not volumetric, strain mapping. To address the complete mechanical behavior of such a complex arterial geometry, complementary measurements should be performed to inform 3-D finite element models, including those for inverse material characterization. 4.ConclusionThis work aimed to explore and illustrate the potential offered by a multimodal optical approach to measure regionally varying thickness and surface deformations of the aortic arch in its native geometry in vitro. Such measurements, which to our knowledge have not been reported previously, could enable a new class of high fidelity inverse methods for material characterization that yield regional information. Such information, in turn, could enable a deeper understanding of aortic arch biomechanics via sophisticated fluid–solid interaction and fluid-solid-growth studies, which could help in the design of improved clinical interventions and/or improved biomimetic graft-patches for aortic arch reconstruction. ReferencesP. W. Alford and L. A. Taber,
“Computational study of growth and remodeling in the aortic arch,”
Comput. Methods Biomech. Biomed. Eng., 11
(5), 525
–538
(2008). http://dx.doi.org/10.1080/10255840801930710 1025-5842 Google Scholar
C. M. García-Herrera, D. J. Celentano and M. A. Cruchaga,
“Bending and pressurization test of the human aortic arch: experiments, modelling and simulation of a patient-specific case,”
Comput. Methods Biomech. Biomed. Eng., 16
(8), 830
–839
(2013). http://dx.doi.org/10.1080/10255842.2011.641123 1025-5842 Google Scholar
C. M. García-Herrera and D. J. Celentano,
“Modelling and numerical simulation of the human aortic arch under in vivo conditions,”
Biomech. Model Mechanobiol., 12
(6), 1143
–1154
(2013). http://dx.doi.org/10.1007/s10237-013-0471-6 BMMICD 1617-7959 Google Scholar
S. Jin, J. Oshinski and D. P. Giddens,
“Effects of wall motion and compliance on flow patterns in the ascending aorta,”
J. Biomech. Eng., 125 347
–354
(2003). http://dx.doi.org/10.1115/1.1574332 JBENDY 0148-0731 Google Scholar
T. M. Morrison et al.,
“Circumferential and longitudinal cyclic strain of the human thoracic aorta: age-related changes,”
J. Vasc. Surg., 49
(4), 1029
–1036
(2009). http://dx.doi.org/10.1016/j.jvs.2008.11.056 0741-5214 Google Scholar
S. Pasta et al.,
“Difference in hemodynamic and wall stress of ascending thoracic aortic aneurysms with bicuspid and tricuspid aortic valve,”
J. Biomech., 46 1729
–1738
(2013). http://dx.doi.org/10.1016/j.jbiomech.2013.03.029 JBMCB5 0021-9290 Google Scholar
S. Pittaccio et al.,
“Aortic tissue properties in porcine models: a comparison of ex vivo mechanical test results after simulated aortic arch reconstructions,”
J. Appl. Biomath. Biomech., 3
(3), 147
–156
(2005). Google Scholar
D. Tremblay et al.,
“A comparison of mechanical properties of materials used in aortic arch reconstruction,”
Ann. Thorac. Surg., 88 1484
–1491
(2009). http://dx.doi.org/10.1016/j.athoracsur.2009.07.023 ATHSAK 0003-4975 Google Scholar
P. E. Vincent et al.,
“Blood flow in the rabbit aortic arch and descending thoracic aorta,”
J. R. Soc. Interface, 8 1708
–1719
(2011). http://dx.doi.org/10.1098/rsif.2011.0116 Google Scholar
N. Xiao, J. D. Humphrey and C. A. Figueroa,
“Multi-scale computational model of three-dimensional hemodynamics within a deformable full-body arterial network,”
J. Comput. Phys., 244 22
–40
(2013). http://dx.doi.org/10.1016/j.jcp.2012.09.016 JCTPAH 0021-9991 Google Scholar
C. Ferraresi et al.,
“One-dimensional experimental mechanical characterisation of porcine aortic root wall,”
Med. Biol. Eng. Comput., 37 202
–207
(1999). http://dx.doi.org/10.1007/BF02513288 MBECDY 0140-0118 Google Scholar
M. A. Lillie, R. E. Shadwick and J. M. Gosline,
“Mechanical anisotropy of inflated elastic tissue from the pig aorta,”
J. Biomech., 43 2070
–2078
(2010). http://dx.doi.org/10.1016/j.jbiomech.2010.04.014 JBMCB5 0021-9290 Google Scholar
S. B. Shah et al.,
“Prefailure and failure mechanics of the porcine ascending thoracic aorta: experiments and a multiscale model,”
J. Biomech. Eng., 136
(2), 021028
(2014). http://dx.doi.org/10.1115/1.4026443 JBENDY 0148-0731 Google Scholar
D. P. Sokolis,
“Passive mechanical properties and structure of the aorta: segmental analysis,”
Acta Physiol., 190 277
–289
(2007). http://dx.doi.org/10.1111/aps.2007.190.issue-4 APCHC4 1748-1708 Google Scholar
A. N. Azadani et al.,
“Comparison of mechanical properties of human ascending aorta and aortic sinuses,”
Ann. Thorac. Surg., 93 87
–94
(2012). http://dx.doi.org/10.1016/j.athoracsur.2011.08.002 ATHSAK 0003-4975 Google Scholar
N. Choudhury et al.,
“Local mechanical and structural properties of healthy and diseased human ascending aorta tissue,”
Cardiovasc. Pathol., 18 83
–89
(2009). http://dx.doi.org/10.1016/j.carpath.2008.01.001 CATHE8 1054-8807 Google Scholar
C. Martin, T. Pham and W. Sun,
“Significant differences in the material properties between aged human and porcine aortic tissues,”
Eur. J. Cardiothorac. Surg., 40 28
–34
(2011). http://dx.doi.org/10.1016/j.ejcts.2010.08.056 1010-7940 Google Scholar
P. B. Matthews et al.,
“Comparison of porcine pulmonary and aortic root material properties,”
Ann. Thorac. Surg., 89 1981
–1989
(2010). http://dx.doi.org/10.1016/j.athoracsur.2010.03.002 ATHSAK 0003-4975 Google Scholar
M. A. Nicosia et al.,
“Biaxial mechanical properties of porcine ascending wall tissue,”
J. Heart Valve Dis., 11
(5), 680
–687
(2002). JHVDEU Google Scholar
S. P. Marra et al.,
“Elastic and rupture properties of porcine aortic tissue measured using inflation testing,”
Cardiovasc. Eng., 6 125
–133
(2006). http://dx.doi.org/10.1007/s10558-006-9021-5 1567-8822 Google Scholar
J. D. Humphrey,
“Vascular adaptation and mechanical homeostasis at tissue, cellular, and sub-cellular levels,”
Cell Biochem. Biophys., 50 53
–78
(2008). http://dx.doi.org/10.1007/s12013-007-9002-3 CBBIFV 1085-9195 Google Scholar
M. A. Sutton, J.-J. Orteu and H. Schreier, Image Correlation for Shape, Motion, and Deformation Measurements, Springer, New York
(2009). Google Scholar
“Fringe projection techniques [Special issue],”
Opt. Lasers Eng., 48 133
–256
(2010). http://dx.doi.org/10.1016/j.optlaseng.2009.09.001 OLENDN 0143-8166 Google Scholar
R. K. Wang et al.,
“Special Section Guest Editorial: Optical elastography and measurement of tissue biomechanics,”
J. Biomed. Opt., 18
(12), 121501
(2013). http://dx.doi.org/10.1117/1.JBO.18.12.121501 JBOPFO 1083-3668 Google Scholar
J. A. N. Buytaert, J. E. F. Aernouts and J. J. J. Dirckx,
“Indentation measurements on the eardrum with automated projection moiré profilometry,”
Opt. Lasers Eng., 51 47
–53
(2013). http://dx.doi.org/10.1016/j.optlaseng.2008.01.002 OLENDN 0143-8166 Google Scholar
B. Coudrillier et al.,
“Scleral anisotropy and its effects on the mechanical response of the optic nerve head,”
Biomech. Model Mechanobiol., 12 941
–963
(2013). http://dx.doi.org/10.1007/s10237-012-0455-y BMMICD 1617-7959 Google Scholar
K. Genovese et al.,
“An improved panoramic digital image correlation method for vascular strain analysis and material characterization,”
J. Mech. Behav. Biomed. Mater., 27 132
–142
(2013). http://dx.doi.org/10.1016/j.jmbbm.2012.11.015 Google Scholar
K. Genovese et al.,
“Digital image correlation-based point-wise inverse characterization of heterogeneous material properties of gallbladder in vitro,”
Proc. R. Soc. A, 470 20140152
(2014). http://dx.doi.org/10.1098/rspa.2014.0152 Google Scholar
A. Romo et al.,
“In vitro analysis of localized aneurysm rupture,”
J. Biomech., 47 607
–616
(2014). http://dx.doi.org/10.1016/j.jbiomech.2013.12.012 JBMCB5 0021-9290 Google Scholar
J. D. Humphrey, Cardiovascular Solid Mechanics: Cells, Tissues, and Organs, Springer(2002). Google Scholar
S. Roccabianca et al.,
“Quantification of regional differences in aortic stiffness in the aging human,”
J. Mech. Behav. Biomed. Mater., 29 618
–634
(2014). http://dx.doi.org/10.1016/j.jmbbm.2013.01.026 Google Scholar
H. M. Finlay, P. Wittaker and P. B. Canham,
“Collagen organization in the branching region of human brain arteries,”
Stroke, 29 1595
–1601
(1998). http://dx.doi.org/10.1161/01.STR.29.8.1595 SJCCA7 0039-2499 Google Scholar
J. M. Lee and S. E. Langdon,
“Thickness measurement of soft tissue biomaterials: a comparison of five methods,”
J. Biomech., 29 829
–832
(1996). http://dx.doi.org/10.1016/0021-9290(95)00121-2 JBMCB5 0021-9290 Google Scholar
M. Dai et al.,
“Calibration of revolution axis for 360 deg surface measurement,”
Appl. Opt., 52
(22), 5440
–5448
(2013). http://dx.doi.org/10.1364/AO.52.005440 APOPAI 0003-6935 Google Scholar
R. Rodriguez et al.,
“Vibration analysis at micro-scale by Talbot fringe projection method,”
Strain, 45
(3), 249
–258
(2009). http://dx.doi.org/10.1111/str.2009.45.issue-3 STRABB 0039-2103 Google Scholar
H. Shi et al.,
“Shape and deformation measurement system by combining fringe projection and digital image correlation,”
Opt. Lasers Eng., 47 301
–309
(2009). http://dx.doi.org/10.1016/j.optlaseng.2008.01.002 OLENDN 0143-8166 Google Scholar
C. J. Beller et al.,
“Role of aortic root motion in the pathogenesis of aortic dissection,”
Circulation, 109 763
–769
(2004). http://dx.doi.org/10.1161/01.CIR.0000112569.27151.F7 CIRCAZ 0009-7322 Google Scholar
A. Creane et al.,
“Prediction of fibre architecture and adaptation in diseased carotid bifurcations,”
Biomech. Model Mechanobiol., 10 831
–843
(2011). http://dx.doi.org/10.1007/s10237-010-0277-8 BMMICD 1617-7959 Google Scholar
I. Hariton et al.,
“Stress-modulated collagen fiber remodeling in a human carotid bifurcation,”
J. Theor. Biol., 248 460
–470
(2007). http://dx.doi.org/10.1016/j.jtbi.2007.05.037 JTBIAP 0022-5193 Google Scholar
A. J. Rowe, H. M. Finlay and P. B. Canham,
“Collagen biomechanics in cerebral arteries and bifurcations assessed by polarizing microscopy,”
J. Vasc. Res., 40 406
–415
(2003). http://dx.doi.org/10.1159/000072831 JVREE9 1018-1172 Google Scholar
D. Tremblay and R. L. Leask,
“Remodelling and pathology development associated with aneurismal ascending aortic tissues,”
Can. J. Chem. Eng., 89 13
–22
(2011). http://dx.doi.org/10.1002/cjce.v89.1 CJCEA7 0008-4034 Google Scholar
E. H. Stephens and K. J. Grande-Allen,
“Age-related changes in collagen synthesis and turnover in porcine heart valves,”
J. Heart Valve Dis., 16
(6), 672
–682
(2007). JHVDEU Google Scholar
H. C. Han and Y. C. Fung,
“Species dependence of the zero-stress state of aorta: pig versus rat,”
J. Biomech. Eng., 113
(4), 446
–451
(1991). http://dx.doi.org/10.1115/1.2895425 JBENDY 0148-0731 Google Scholar
J. D. Humphrey and G. A. Holzapfel,
“Mechanics, mechanobiology, and modeling of human abdominal aorta and aneurysms,”
J. Biomech., 45 805
–814
(2012). http://dx.doi.org/10.1016/j.jbiomech.2011.11.021 JBMCB5 0021-9290 Google Scholar
G. Martufi et al.,
“Three-dimensional geometrical characterization of abdominal aortic aneurysms: image-based wall thickness distribution,”
J. Biomech. Eng., 131 061015
(2009). http://dx.doi.org/10.1115/1.3127256 JBENDY 0148-0731 Google Scholar
P. Moireau et al.,
“Sequential identification of boundary support parameters in a fluid-structure vascular model using patient data,”
Biomech. Model Mechanobiol., 12
(3), 475
–496
(2013). http://dx.doi.org/10.1007/s10237-012-0418-3 BMMICD 1617-7959 Google Scholar
|