
|
|
1.IntroductionRaman spectroscopy, a noninvasive, molecular sensitive spectroscopic tool with a significant amount of research done to improve and test its performance for biosensing,1–4 has been widely recognized and assessed, especially for early-stage cancer investigation.2,5,6 The Raman spectrum can identify different biological and tissue components both in vitro and in vivo7 by assigning specific groups within the molecular structures to their corresponding Raman vibrational bands. Unfortunately, this method often fails inside molecularly rich environments such as tissues consisting of varied components due to overlap of Raman bands that mask the useful information and hinder the ability for accurate and precise characterization.8–10 As noted in a recent review paper, vibrational spectroscopic methods have been widely explored for analysis of various pathologies and organ systems, but as yet, “none have entered routine clinical practice.”2 A 2015 review article concludes that if the combination of vibrational spectroscopy and chemometric analysis is to be successfully transferred into clinical practice more extensive studies are needed.11 Clearly, new schemes and approaches to vibrational spectroscopy are required for biological and tissue analysis. Several methods such as surface-enhanced Raman scattering and coherent anti-stokes Raman scattering, which seek to increase Raman signal-to-noise ratios (SNR) and resolve additional peaks,3,12,13 are limited for in vivo applications since they generally require injection of substrates, significant optical complexity and operator expertise, and additionally they are generally incompatible with fiber optic delivery. Regarding biophotonic signal processing, mathematical models are often constructed as linear combinations of multiple chemical components representative of both healthy and diseased tissue in an effort to provide a differential classification.14,15 Still, the applicability outside of the training data and closely related samples is often quite limited and clinically unacceptable, as noted above. Other models based on multivariate statistics including principal component analysis (PCA), hierarchical cluster analysis (HCA), partial least squares (PLS),15–19 and support vector machines,14,20,21 which aid in the interpretation of spectral data, have been used for further discrimination of different sample types. These methods are specifically used for data processing and their success is highly dependent on the quality of the acquisition schemes and may not be effective on all types of spectral noise or with poor signal quality (i.e., low SNR). We present here a method called differential laser-induced perturbation spectroscopy (DLIPS) which combines low intensity ultraviolet (UV) laser-material interactions (nondestructive) with difference Raman spectroscopy for analysis of thin films of biologically relevant materials, namely amino acids and dipeptides, which are considered basic constituents of collagenous tissues. The analysis of the thin films of these biologically relevant materials is a key step to understanding the optimal use of DLIPS for future in vivo diagnostics. Wavelengths at the UV range are well absorbed and photon energies generally exceed all local bond energies.22 Low intensity 193-nm irradiation (i.e., well below sample ablation thresholds) results in peptide bond cleavage for targeted collagen, destruction of molecular structure, and generally in linearity between laser-induced perturbation with laser intensity.23 The coupling of 193-nm laser light specifically into collagen was previously quantified in terms of the absorption cross-section 24 and was later combined with other traditional spectroscopic techniques as the basis for the DLIPS approach for analysis of organic materials.25 Of significance, the DLIPS technique was recently implemented using a 355-nm fluorescence probe for in vivo analysis of skin cancer in an animal model, showing statistically improved discrimination between normal and precancerous tissues as directly compared to a traditional fluorescence probe.26 Here, we take a step back from our earlier in vivo measurements and focus on the fundamental constitutive materials using a Raman probe to gain additional insight into the DLIPS scheme in the context of classification. 2.Materials and Methods2.1.Sample PreparationThe goal of the current study is to investigate basic solutions of molecules representative of collagenous tissues corresponding to the fundamental building-block level; hence, solutions of three basic amino acids and their related dipeptides were selected. Amino acid solutions were created by separately dissolving the three amino acids l-proline (17.3 mM), purchased from Fluka, and glycine (13.3 mM) and l-alanine (5.61 mM), purchased from Sigma Aldrich, in ultra-purified deionized (DI) water (Fisher Scientific). Dipeptide solutions were created by separately dissolving (0.5 to 2 mg solute/ml of DI water) the three dipeptides Gly–Gly (7.57 mM), Ala–Gly (3.42 mM), and Gly–Pro (11.6 mM), purchased from Sigma Aldrich, in DI water. To prepare thin films of samples, the solutions were first stirred for 24 h and deposited onto 50-mm diameter UV-grade quartz flats, then were recrystallized at 35°C, resulting in dry thin films of the desired compounds. Microscopic examination of the resulting films revealed fractal-like structures dispersed over the entire quartz surface. To minimize any background fluorescence from the UV-grade flats, each was thoroughly cleaned in acetone and photobleached with an intense mercury lamp for a minimum of 40 min prior to solution deposition.27 2.2.Experimental SetupThe DLIPS set-up was realized with two lasers, enabling UV laser perturbation and Raman scattering without repositioning the target, as depicted schematically in Fig. 1. A 488-nm Ar-ion laser was used as the excitation source for all Raman scattering measurements. A 488-nm laser line filter was placed at the Ar-ion laser output to provide monochromatic output by eliminating all other Ar-ion laser transitions. The Ar-ion laser beam was directed to a 488-nm dichroic Raman beam splitter (Semrock LPD01-488RU) and focused on the sample with a spot size of using a microscope objective lens (M Plan Apo 50X/0.55, Mitutoyo) at a working distance of . A kinematic mirror was employed to reflect the image directly to a real-time CCD camera to ensure accurate alignment and focus at the desired target spot. The Raman scattered light was collected in backscatter by the same microscope objective lens, collimated, and subsequently passed through the dichroic beamsplitter where it was lens coupled into an optical fiber bundle. A long-pass Raman edge filter (488 nm RazorEdge, Semrock, LP02-488RU) was placed in front of the fiber bundle to reject any 488-nm scattered laser light. The fiber was coupled to a 0.3-m Czerny–Turner spectrometer, dispersed using a grating and recorded with a thermoelectrically cooled CCD array detector (Pixis, Princeton Instruments). Similar custom setups have been reported with various excitation sources.15,17,28,29 The Ar-ion laser beam power was controlled to prevent any damage to the target film and was set to or 1.1 mW, depending on the specific sample. Film stability was assessed by subtracting consecutive Raman spectra acquired for a given film and power setting, reducing the power as necessary such that a difference of zero was repeatedly realized between any two consecutive recorded spectra. Fig. 1Schematic of the experimental setup. L1: 193-nm excimer laser; L2: 488-nm Ar-Ion laser; UVM: ultraviolet mirror; M: mirror; LLF: laser line filter; FB: fiber bundle; F: fiber; EF: edge filter; L: lens; KM: kinematic mirror; CAM: camera; RBS: Raman beam splitter; BD: beam dump; OL: objective lens; S: Czerny–Turner spectrometer; UVL: ultraviolet lens; SH: sample holder, and C: computer.  To create the laser-induced perturbation effect for the DLIPS scheme, a 193-nm ArF laser beam (X5 Excimer laser, GAM Inc., 10.2 ns FWHM pulse width) was directed to the sample holder, focused using a UV-grade planoconvex lens to a diameter size of about 1.4 mm at the target, and projected onto the sample spot surface with a 65 deg angle of incidence. The excimer laser was operated at 50 Hz for all experiments using software control to precisely deliver a preselected number of pulses for each experiment. The centers of the Raman scattering and excimer laser perturbation beams were concentrically superimposed at the same target spot. The large mismatch in Raman and excimer beam focal diameters ensured that the entire Raman probe volume is uniformly exposed to the 193-nm perturbation beam. The 193-nm excimer laser beam energy was set to , providing the desired fluence of at the target focal spot. This magnitude of excimer fluence is sufficiently low to avoid any direct ablation of the samples as presented in previous reports of our laboratory,24,26 noting that the typical ablation threshold of tissue and biological materials for the 193-nm excimer laser is on the order of . It was necessary to deliver the excimer laser at near normal incidence rather than through the microscope due to the microscope objective incompatibility with the deep UV wavelength of 193 nm; however, the long working distance of 15 mm readily allowed beam access of the excimer beam. Because the DLIPS approach is based on “difference spectroscopy,” it is imperative that the preperturbation and postperturbation Raman spectra be recorded from the exact same location; hence, the current static system with fixed probe and perturbation beams aligned to a common probe volume. As noted above, the zero difference of any two consecutive Raman spectra validates the spectrum-to-spectrum stability of a given sample spot in the absence of any perturbation laser. Raman data were collected from multiple spots spread over multiple thin film samples and flats. The 488-nm excitation, as described above, was collected and saved with Winspec/32 software (Princeton Instruments).The resulting Raman spectral window ranged from 497 to . Various thin films were analyzed for a particular amino acid or dipeptide, thereby averaging over multiple films and substrates. For a given sample spot, each final spectrum was an accumulation of 40 images, with a per spectrum acquisition time of 3 s, for a total integration time of 120 s. 2.3.Data InterpretationThe acquired Raman spectra before the perturbation step were considered the “preperturbation” data, and the acquired Raman spectra following excimer laser perturbation were considered the “postperturbation” data for a given sample spot. Specifically, after the preperturbation data were acquired for a given sample site, the shutter of the Raman laser was closed and 800 shots of the 193-nm perturbation beam were immediately delivered to the sample. Following perturbation, a dark signal (i.e., background signal plus dark counts) was then collected while the Raman laser shutter remained closed for the same total accumulation time without moving the sample. The 120 s of dark signal acquisition following perturbation ensured two items. First, that the dark signal was recorded under identical conditions for each sample spot, thereby accounting for any changes in surface reflectivity or film transmission of ambient light. Second, it provided a fixed time period (i.e., repeatable) to ensure that any transient optical effects immediately following 193-nm UV irradiation were dissipated before then acquiring the postperturbation Raman signal. Earlier studies of probe beam transmission through collagen solutions following 193-nm excimer laser perturbation revealed both transient perturbation to optical properties as well as permanent bond cleavage, with transient effects decaying on the order of tens of seconds.30 Following dark signal collection, the Raman laser shutter was opened and postperturbation Raman data were collected and saved using identical signal collection parameters. The DLIPS spectrum was finally obtained by directly calculating in which the numerator represents the absolute difference in postperturbation, , and preperturbation, spectra, noting that a negative signal represents a decrease in signal intensity at a specific wavenumber following laser perturbation, while a positive value likewise represents an increase in signal, and where represents the dark Raman signal as described above. The denominator represents the “absolute” preperturbation Raman signal (i.e., dark-count subtracted), which has the effect of normalizing the difference spectrum, thereby generating a DLIPS signal indicative of the fractional change in Raman spectral intensity at each wavenumber (i.e., each pixel). For example, a value of for a given wavenumber would correspond to a 20% decrease in Raman intensity following excimer laser perturbation. The DLIPS spectra were then normalized to the largest positive value. It is noted that for the peptide and dipeptide films examined in the current study, the observed preperturbation Raman vibrational peaks generally revealed decreases or no changes, while as discussed below, some new peaks were revealed following laser perturbation. In addition, the observed background signal (i.e., continuum baseline), which is attributed to broadband fluorescence as expected for the current biomolecular samples with 488-nm excitation, was always observed to “increase” following excimer laser perturbation. As a result, the overall DLIPS spectra were always positive.In summary, DLIPS data were collected and processed for a total of 45 sample spots for each of the six sample types (l-alanine, glycine, l-proline, Ala–Gly, Gly–Gly, Gly–Pro) in the study. All of the calculations were conducted by Winspec/32 Software as described above prior to using any of the multivariate analysis methods described at the following section. 2.4.Data ProcessingAll of the absolute Raman data, calculated as , and the DLIPS data, per Eq. (1), were processed in an identical manner as follows. Whole data were mean centered, baseline corrected (using a cubic fit), divided by the sample range and normalized to the most intense band. Finally, spectra were smoothed by second-order Savitzky–Golay polynomial filter using 11 points. These preprocessing spectral methods have been widely used.16,18–21 For initial analysis of the data, the Mahalanobis distance15 was estimated and the data falling far away from this distance were considered as outliers. Approximately 10% of the whole dataset (from the original 270 Raman spectra and 270 DLIPS spectra) were dropped based on the outlier test, which is attributed to poor Raman SNR due to thin film regions, instabilities in laser power, film anomalies or impurities, or for the case of DLIPS, slight sample movement/misalignment between the preperturbation and postperturbation Raman spectra, noting the rather high magnification (i.e., ). The remaining data were then used for the multivariate analysis with no further data omission. Common multivariate analysis such as PCA, HCA, and finally PLS methods were used to explore the effects of the DLIPS scheme as compared to traditional Raman spectroscopy and to evaluate the performance of the DLIPS method for spectral classification. Particularly, in HCA, data clusters are formed by linking naturally similar samples based on their multivariate distances, and the resulting dendogram of HCA reveals these groupings visually.19 For dendogram generation, samples were linked and grouped together based on the similarities in their structure, and the resulting tree-shaped structure shows the sample relations where the branch lengths are proportional to cluster distances. The similarity variable in HCA is a scale which is a customary transformation of intersample distances into a comprehensive value. It is inversely proportional with the cluster distances. PCA and PLS models, which can boost the performance of the interpretation of the data by magnifying the natural changes between two different groups by highlighting important variations inside the dataset, reduce the dimensionality of the data into a few components covering most of the variation information inside the data.31 The principal components in PCA are forced to be orthogonal, whereas in PLS, they do not have to be orthogonal.16,17 All the chemometric analysis in the current study was performed using Pirouette (Infometrix, version 4.5). 3.Results and Discussion3.1.Raman and DLIPS SpectraThe Raman and DLIPS spectra recorded from the amino acids and dipeptides were rich in spectral features between the wavenumber range of about 500 to . The Raman shifts of amino acids were compared with the literature, allowing identification of most prominent peaks as discussed below.32 For illustration purposes, three representative spectra from a single sample spot, namely the preperturbation and postperturbation Raman spectra and the corresponding DLIPS spectrum, are shown in Fig. 2 for a l-proline sample. As noted above, the increase in background fluorescence, which has the effect of a “positive offset” in the postperturbation Raman spectra, has the effect of generating overall positive DLIPS spectra. Relative decreases, as compared to the fluorescence background, in the Raman vibrational peaks are, therefore, manifested as downward peaks (i.e., less change than the baseline), which gives the DLIPS spectra an overall inverse appearance with regard to the traditional Raman spectra. This is readily observed in Fig. 2, where vibrational bands appearing in the traditional Raman spectra as positive peaks are seen as downward peaks in the DLIPS spectrum. Fig. 2Representative Raman and differential-laser induced perturbation spectroscopy (DLIPS) spectra of a single l-proline sample spot. (a) Raman spectrum of l-proline acquired before perturbation. (b) Raman spectrum of l-proline acquired after perturbation. (c) Calculated normalized DLIPS spectrum of l-proline based on Eq. (1). The Raman spectra have been baseline corrected. 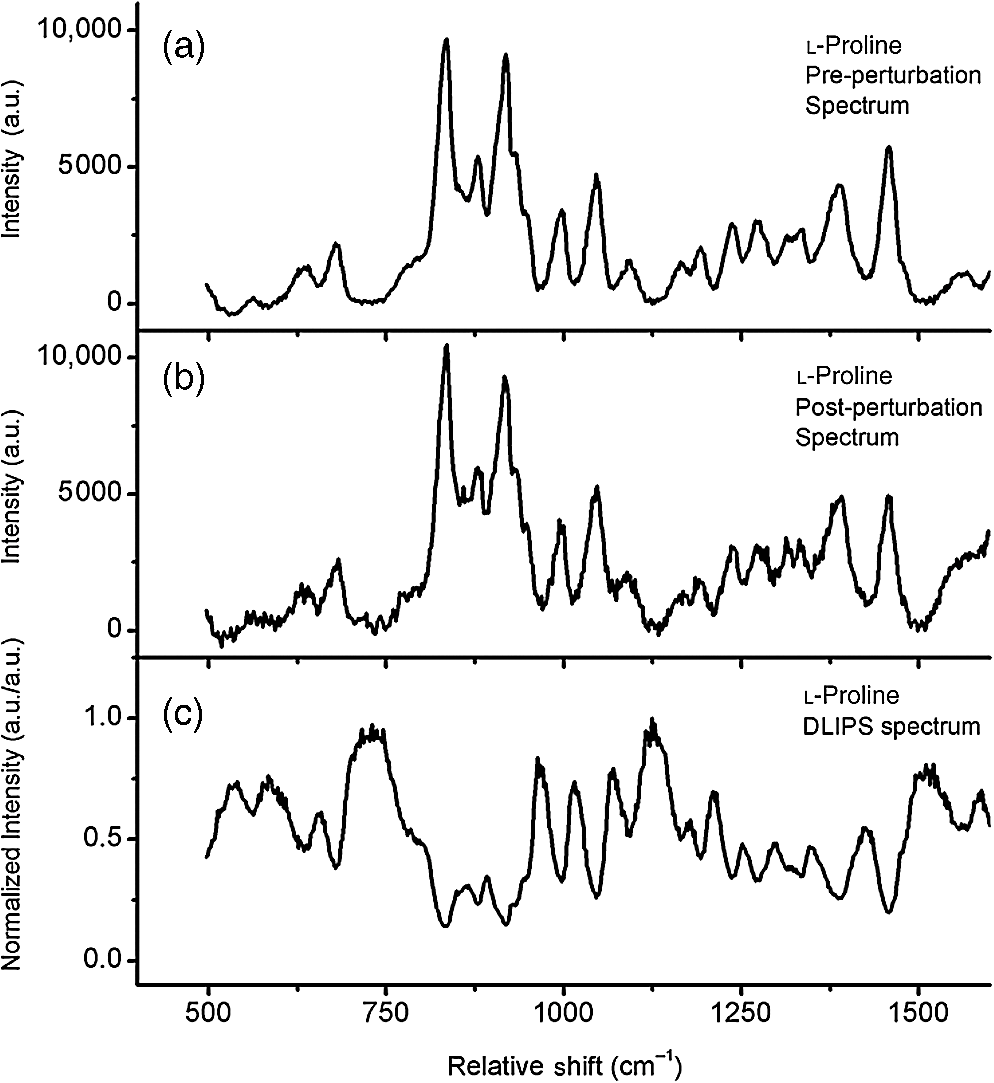 In general, longer wavelengths (especially near IR) are commonly used to excite molecules for Raman systems for biological applications;4 however, in order to increase the Raman signal, shorter wavelengths are often selected, given the inverse fourth-order dependence of Raman scattering cross-section on wavelength.33 Since thin films were used in this study (i.e., low concentration of ), 488-nm excitation was selected to successfully resolve sufficient Raman peaks for classification studies. For all six sample types examined in this study, subtraction of two subsequent Raman spectra in the absence of any excimer laser perturbation revealed no difference (i.e., zero counts), ensuring that the 488-nm beam power was itself nondestructive (i.e., nonperturbative), and thereby promoting stable Raman spectra for the sample films and importantly, that any differences recorded with the DLIPS scheme were a result of only excimer laser perturbation. Representative traditional Raman spectra (i.e., preperturbation Raman spectra) and DLIPS spectra as averaged over all sample spots for each sample type are plotted in Fig. 3. Because both the DLIPS and Raman spectra are normalized between 0 and 1, noting that the maximum peak is generally different between the two spectral methods, they reveal similar spectral features and appear rather like complementary plots, as described above, although there exist key differences in the relative intensity of similar bands, as readily observed in the figures and discussed in detail below. Fig. 3Average Raman and DLIPS spectra of amino acids and dipeptides. (a) l-alanine. (b) Glycine. (c) l-proline. (d) Ala–Gly. (e) Gly–Gly. (f) Gly–Pro. Black (lower) profiles denote average Raman spectra and red (upper) profiles denote average DLIPS spectra for each sample.  For quantitative analysis of the Raman and DLIPS spectra, PCA was employed to detect any differences in relative peak magnitudes by comparing loadings of the sample sets. The three PCA loadings for the total Raman spectral dataset are shown in Figs. 4(a)–4(c) and in Figs. 4(d)–4(f) for the DLIPS spectral datasets, respectively. Accordingly, the most significant vibrational bands identified through the loadings of the PCA analysis of Raman and DLIPS datasets for classification, including their relative intensity in the Raman or DLIPS spectra were tabulated in Table 1 in detail. The vibrational bands ca. 835, 851, 853, 893, 918, 920, 927, 968, 1323, 1362, 1389, 1397, 1404, and were more prominent in the Raman spectra than in the DLIPS spectra, whereas the bands ca. 641, 651, 652, 682, 725, 920, 981, 995, 1020, 1041, 1045, 1048, 1059, 1076, 1101, 1113, 1133, 1141, 1147, 1166, 1173, 1197, 1278, 1316, 1520, 1526, 1543, and were more prominent in their respective DLIPS spectra, noting that the band assignments for these shifts can be readily found in the literature for the amino acids and dipeptides.34–41 Fig. 4Principal component analysis loadings for the various datasets: (a)–(c) are the three loadings of traditional Raman dataset, and (d)–(f) three loadings of DLIPS dataset. A total of of the variation in the data were explained by three loading factors. Prominent loading wavenumbers are labeled for both the Raman and DLIPS data sets, which correspond to vibrational peaks.  Table 1Significant Raman bands of amino acids (l-alanine, glycine, and l-proline) and dipeptides (glycine–glycine, glycine–proline, and glycine–alanine) that are affected by 193-nm irradiation.
The relative intensity differences as well as loading differences of the DLIPS spectral bands as compared to the Raman spectral bands are attributed to differences in the coupling of the excimer laser into various amino acids and dipeptides. It should be highlighted that these intensity differences between DLIPS and Raman spectral bands originated from the perturbative role of the UV light on the molecular bonds with DLIPS, as opposed to traditional vibrational response with Raman. Based on earlier studies, the 193-nm radiation is strongly coupled into and effectively photochemically cleaves peptide bonds.24,25 In general, the high photon energy of 193-nm excimer laser (6.4 eV) is capable of cleaving most bonds in biological molecules; however, the current results (Table 1) reveal a preference for bond perturbation over, for example, and bond perturbation. The effectively cleaved molecular peaks observed in this study are dominated by the many stretching or bending vibrational modes.37 In fact, it is a selective (i.e., preferential) bond perturbation with the excimer laser that is key to the DLIPS scheme, providing “additional” spectral information beyond simple vibrational spectroscopy (e.g., Raman or FTIR). Additionally, as presented in Table 1, increased intensity of several vibrational bands distinctive from vibrations for different samples was recognized in the DLIPS spectral data. Two distinct cases were observed for these changes. First, there were intensity changes at the particular vibrational bands of and groups, as well as some smaller groups, which are attached to the cleaved bonds. It is suggested that once 193-nm light effectively cleaved the bonds, these groups were liberated from their molecules at the sample surface, which results in the recorded difference in their vibrational modes. For the second case, an increase in intensity was observed for different vibrational modes of ions. This is attributed to the electron deficiencies of carbon atoms inducing hydrogen (H) migration from the carboxyl groups that were previously connected to the nitrogen atoms prior to perturbation. The last effect was seen exclusively in amino acids in this study rather than the dipeptides. Such mechanisms most likely play a role in the overall increase in broadband fluorescence observed in the postperturbation Raman spectra. In aggregate, such photochemical mechanisms are hypothesized to account for a portion of the additional spectral information realized with DLIPS. 3.2.Raman and DLIPS Performance in ClassificationThe resulting two-dimensional PCA scatter plots of all six samples using three principal components are shown in Fig. 5, which together account for of the total variance. Visually, it is shown that groups of samples defined by their DLIPS PCA data are more separated than the traditional Raman spectroscopy data. Additionally, comparison of the factors of both DLIPS and Raman datasets reveals that the three PCA factors of the DLIPS dataset are slightly lower than the three factors of the PCA using the Raman dataset, which is an another sign of the separation of these groups. To quantify the PCA performance of the DLIPS and Raman spectra for classification of the amino acids and dipeptides, HCA analysis was employed to the six samples. From Figs. 6(a) and 6(b), the HCA dendrograms of six sample types constructed by the Raman data and the DLIPS data can be seen, respectively. In this case, their features (vibrational bands) in their respective spectra were the recognition elements, and the similarity variable is shown at the top scale. The similarity variable was taken at the significant node of the dendrogram, the first node at which six different groups can be distinguished from each other. The similarity variable was 0.315 for samples defined by their traditional Raman scattering data, whereas the similarity variable was 0.201 for samples defined by their DLIPS data, noting that a smaller similarity variable corresponds to a more successful degree of classification. This demonstrates that the groups of samples defined by their DLIPS data are further away from each other than the groups of samples defined by their Raman data, with the latter data yielding greater similarity variable. In this analysis, the similarity variable is appropriate because all of the samples that are marked with the predefined classes correctly fall into the same HCA-defined classes at the point where all six different groups could be realized (i.e., no single mismatching between predefined and HCA-defined classes). Fig. 6Distributions of the samples and modeling quality: (a) hierarchical cluster analysis (HCA) dendogram of the Raman dataset; (b) HCA dendogram of the DLIPS dataset. Cursor of the similarity variable is placed at the node where all six different groups are first recognized; (c) partial least squares (PLS) model of the Raman dataset; (d) PLS model of the DLIPS dataset. Approximately total of 99% variation in the data were explained by 10 PLS factors.  As noted above, PCA and HCA analysis revealed the DLIPS method as a classification scheme for six biologically relevant samples. In addition, a PLS regression model was developed to further quantify the classification ability of the DLIPS and traditional Raman data sets.17,18,29 For PLS analysis, 10 factors were used to build a model which together accounted for of the total variance. Since the purpose was to directly compare the two datasets on PLS model quality, rather than dividing the data set into two halves for model development and validation, respectively, as is commonly done,15 the entire datasets were used to evaluate the PLS model performance. The PLS models were then used to classify the entire datasets. The predictions of PLS models for both Raman and DLIPS spectral datasets are shown in Figs. 6(c) and 6(d). The solid line represents the values, whereas the nodes are individual predictions of samples, where it is observed that samples described by the DLIPS dataset were tighter. For quantification of the two models, the matrix of residuals of the PLS models was used to calculate error sum squares (ESS). The ESS was calculated as 8.03 for the Raman dataset and was 5.33 for the DLIPS dataset. Similar to the HCA analysis, the RSS value of the Raman data was slightly more than 50% larger than that recorded for the DLIPS data, corroborating the superior classification with the DLIPS approach. 4.ConclusionsIn this study, the comparison between the DLIPS method and the traditional Raman spectroscopy method was demonstrated using several common chemometric data analysis routines. It is shown that the use of low-intensity UV laser light for perturbation of the amino acid and dipeptide molecular structures, as measured with a Raman probe, provides a new and superior spectroscopy-based classification tool, as rooted in the observed permanent UV-induced photochemistry, notably chemistry. In view of earlier work with the DLIPS method using a fluorescence probe for in vivo detection of precancerous tissue,26 the use of DLIPS as a new probe for biological materials, including tissue, is promising. The quantitative improvement of DLIPS for classification analysis in biological applications using multivariate analyses suggests the potential of DLIPS as a stand-alone diagnostic, or in combination with other schemes (i.e., Raman or fluorescence) in an orthogonal sensing methodology. The use of the DLIPS approach in such an orthogonal sensing scheme is advantageous, as the use of the preperturbation spectra (e.g., the preperturbation Raman spectra in the current study) yield the traditional spectral data at no additional cost. Moreover, the nature of the DLIPS method may provide convenience for clinical applications in vivo such as enabling a single-fiber probe, useful to mitigate target movement via contact, to monitor abnormalities. Higher excimer laser repetition rates (e.g., 400 to 500 Hz) can also greatly increase the speed of such clinical applications. Finally, we note that one is not exclusively limited to the 193-nm perturbation wavelength; hence, the opportunity exists for optimization of both perturbation wavelengths as well as resonance probe wavelengths. Future research should explore more complex biological samples, including additional animal models, to further validate the DLIPS approach, either as a stand-alone spectroscopy technique, or in conjunction with Raman and fluorescence spectroscopy. AcknowledgmentsThe research fund was provided in part by the University of Florida, Office of Research through the Opportunity Fund Program (#80869/80870). ReferencesC. Krafft and V. Sergo,
“Biomedical applications of raman and infrared spectroscopy to diagnose tissues,”
Spectroscopy, 20
(5–6), 195
–218
(2006). http://dx.doi.org/10.1155/2006/738186 SPECET 0887-6703 Google Scholar
O.J. Old et al.,
“Vibrational spectroscopy for cancer diagnostics,”
Anal. Methods, 6
(12), 3901
–3917
(2014). http://dx.doi.org/10.1039/C3AY42235F Google Scholar
R. Thomas et al.,
“The use of Raman spectroscopy in cancer diagnostics,”
Spectroscopy, 28
(9), 22
–27
(2014). SPECET 0887-6703 Google Scholar
Q. Tu and C. Chang,
“Diagnostic applications of Raman spectroscopy,”
Nanomed. Nanotechnol. Biol. Med., 8
(5), 545
–558
(2012). http://dx.doi.org/10.1016/j.nano.2011.09.013 1549-9634 Google Scholar
W. K. Jerjes et al.,
“The future of medical diagnostics: review paper,”
Head Neck Oncol., 3
(38),
(2011). http://dx.doi.org/10.1186/1758-3284-3-38 1758-3284 Google Scholar
Q. Liu,
“Role of optical spectroscopy using endogenous contrasts in clinical cancer diagnosis,”
World J. Clin. Oncol., 2
(1), 50
–63
(2011). http://dx.doi.org/10.5306/wjco.v2.i1.50 WJOOAB 1920-4531 Google Scholar
E. Brauchle and K. Schenke-Layland,
“Raman spectroscopy in biomedicine—non-invasive in vitro analysis of cells and extracellular matrix components in tissues,”
Biotechnol. J., 8
(3), 288
–297
(2013). http://dx.doi.org/10.1002/biot.201200163 BJIOAM 1860-6768 Google Scholar
J. J. Baraga, M. S. Feld and R. P. Rava,
“In situ optical histochemistry of human artery using near-infrared Fourier-transform Raman-spectroscopy,”
Proc. Natl Acad. Sci. U. S. A., 89
(8), 3473
–3477
(1992). http://dx.doi.org/10.1073/pnas.89.8.3473 PNASA6 0027-8424 Google Scholar
A. L. Jenkins, R. A. Larsen and T. B. Williams,
“Characterization of amino acids using Raman spectroscopy,”
Spectrochim. Acta A, 61
(7), 1585
–1594
(2005). http://dx.doi.org/10.1016/j.saa.2004.11.055 SAMCAS 1386-1425 Google Scholar
G. Y. Zhu et al.,
“Raman spectra of amino acids and their aqueous solutions,”
Spectrochim. Acta A, 78
(3), 1187
–1195
(2011). http://dx.doi.org/10.1016/j.saa.2010.12.079 SAMCAS 1386-1425 Google Scholar
A. A. Bunaciu, H. Y. Aboul-Enein and S. Fleschin,
“Vibrational spectroscopy in clinical analysis,”
Appl. Spectrosc. Rev., 50
(2), 176
–191
(2015). http://dx.doi.org/10.1080/05704928.2014.955582 APSRBB 0570-4928 Google Scholar
S. Y. Feng et al.,
“Study on gastric cancer blood plasma based on surface-enhanced raman spectroscopy combined with multivariate analysis,”
Sci. China Life Sci., 54
(9), 828
–834
(2011). http://dx.doi.org/10.1007/s11427-011-4212-8 SCLSCJ 1674-7305 Google Scholar
S. Wachsmann-Hogiu, T. Weeks and T. Huser,
“Chemical analysis in vivo and in vitro by raman spectroscopy-from single cells to humans,”
Curr. Opin. Biotechnol., 20
(1), 63
–73
(2009). http://dx.doi.org/10.1016/j.copbio.2009.02.006 CUOBE3 0958-1669 Google Scholar
I. Barman et al.,
“Application of Raman spectroscopy to identify microcalcifications and underlying breast lesions at stereotactic core needle biopsy,”
Cancer Res., 73
(11), 3206
–3215
(2013). http://dx.doi.org/10.1158/0008-5472.CAN-12-2313 CNREA8 0008-5472 Google Scholar
M. B. Peres et al.,
“Classification model based on Raman spectra of selected morphological and biochemical tissue constituents for identification of atherosclerosis in human coronary arteries,”
Lasers Med. Sci., 26
(5), 645
–655
(2011). http://dx.doi.org/10.1007/s10103-011-0908-z 0268-8921 Google Scholar
J. W. Chan et al.,
“Nondestructive identification of individual leukemia cells by laser trapping Raman spectroscopy,”
Anal. Chem., 80
(6), 2180
–2187
(2008). http://dx.doi.org/10.1021/ac7022348 ANCHAM 0003-2700 Google Scholar
N. C. Dingari et al.,
“Raman spectroscopy provides a powerful diagnostic tool for accurate determination of albumin glycation,”
PloS One, 7
(2), e32406
(2012). http://dx.doi.org/10.1371/journal.pone.0032406 1932-6203 Google Scholar
G. E. Menzies et al.,
“Fourier transform infrared for noninvasive optical diagnosis of oral, oropharyngeal, and laryngeal cancer,”
Trans. Res., 163
(1), 19
–26
(2014). http://dx.doi.org/10.1016/j.trsl.2013.09.006 Google Scholar
I. Notingher et al.,
“In situ spectral monitoring of mRNA translation in embryonic stem cells during differentiation in vitro,”
Anal. Chem., 76
(11), 3185
–3193
(2004). http://dx.doi.org/10.1021/ac0498720 ANCHAM 0003-2700 Google Scholar
A. Nijssen et al.,
“Discriminating basal cell carcinoma from its surrounding tissue by Raman spectroscopy,”
J. Investig. Dermatol., 119
(1), 64
–69
(2002). http://dx.doi.org/10.1046/j.1523-1747.2002.01807.x JIDEAE 0022-202X Google Scholar
P. Rosch et al.,
“Chemotaxonomic identification of single bacteria by micro-Raman spectroscopy: application to clean-room-relevant biological contaminations,”
Appl. Environ. Microbiol., 71
(3), 1626
–1637
(2005). http://dx.doi.org/10.1128/AEM.71.3.1626-1637.2005 AEMIDF 0099-2240 Google Scholar
J. L. Boulnois,
“Photophysical processes in recent medical laser developments a review,”
Lasers Med. Sci., 1
(1), 47
–66
(1986). http://dx.doi.org/10.1007/BF02030737 0268-8921 Google Scholar
D. N. Nikogosyan and H. Gorner,
“Towards the laser photochemistry of the cornea: studies of the most common and highly absorbing aliphatic amino acids in collagen,”
J. Photochem. Photobiol. B, 47
(1), 63
–67
(1998). http://dx.doi.org/10.1016/S1011-1344(98)00204-8 JPPBEG 1011-1344 Google Scholar
B. T. Fisher and D. W. Hahn,
“Measurement of small-signal absorption coefficient and absorption cross section of collagen for 193-nm excimer laser light and the role of collagen in tissue ablation,”
Appl. Opt., 43
(29), 5443
–5451
(2004). http://dx.doi.org/10.1364/AO.43.005443 APOPAI 0003-6935 Google Scholar
S. E. Smith et al.,
“Differential laser-induced perturbation spectroscopy using a deep-ultraviolet excimer laser,”
Opt. Lett., 36
(11), 2116
–2118
(2011). http://dx.doi.org/10.1364/OL.36.002116 OPLEDP 0146-9592 Google Scholar
R. T. Kozikowski et al.,
“Comparative evaluation of differential laser-induced perturbation spectroscopy as a technique to discriminate emerging skin pathology,”
J. Biomed. Opt., 17
(6), 067002
(2012). http://dx.doi.org/10.1117/1.JBO.17.6.067002 JBOPFO 1083-3668 Google Scholar
N. B. Vicente et al.,
“Photobleaching correction in fluorescence microscopy images,”
J. Phys., 90
(1), 012068
(2007). http://dx.doi.org/10.1088/1742-6596/90/1/012068 2165-5286 Google Scholar
Z. W. Huang et al.,
“In vivo detection of epithelial neoplasia in the stomach using image-guided Raman endoscopy,”
Biosensors Bioelectron., 26
(2), 383
–389
(2010). http://dx.doi.org/10.1016/j.bios.2010.07.125 BBIOE4 0956-5663 Google Scholar
C. Ortiz et al.,
“Identification of insulin variants using Raman spectroscopy,”
Anal. Biochem., 332
(2), 245
–252
(2004). http://dx.doi.org/10.1016/j.ab.2004.06.013 ANBCA2 0003-2697 Google Scholar
L. M. Shanyfelt, Arf Excimer Laser Corneal Ablation Effects of Laser Repetition Rate and Fundamental Laser-Tissue Coupling, University of Florida, Gainesville, Florida
(2008). Google Scholar
K. R. Beebe, R. J. Pell and M. B. Seasholtz, Chemometrics: A Practical Guide, Wiley, New York
(1998). Google Scholar
J. De Gelder et al.,
“Reference database of Raman spectra of biological molecules,”
J. Raman Spectrosc., 38
(9), 1133
–1147
(2007). http://dx.doi.org/10.1002/(ISSN)1097-4555 JRSPAF 0377-0486 Google Scholar
J. D. Ingle and S. R. Crouch, Spectrochemical Analysis, Prentice Hall PTR, Upper Saddle River, New Jersey
(1988). Google Scholar
J. J. Carcamo et al.,
“Proline and hydroxyproline deposited on silver nanoparticles. A Raman, SERS and theoretical study,”
J. Raman Spectrosc., 43
(6), 750
–755
(2012). http://dx.doi.org/10.1002/jrs.v43.6 JRSPAF 0377-0486 Google Scholar
V. V. Ghazaryan, M. Fleck and A. M. Petrosyan,
“Structure and vibrational spectra of l-alanine l-alaninium picrate monohydrate,”
J. Mol. Struct., 1015 51
–55
(2012). http://dx.doi.org/10.1016/j.molstruc.2012.02.007 JMOSB4 0022-2860 Google Scholar
P. Lagant et al.,
“Raman-spectra and normal vibrations of dipeptides. 2. Glycyl-l-proline,”
Biopolymers, 22
(5), 1285
–1300
(1983). http://dx.doi.org/10.1002/(ISSN)1097-0282 BIPMAA 0006-3525 Google Scholar
P. Lagant et al.,
“Raman-spectroscopy and normal vibrations of peptides—characteristic normal-modes of a type-II beta-turn,”
Eur. J. Biochem., 139
(1), 137
–148
(1984). http://dx.doi.org/10.1111/ejb.1984.139.issue-1 EJBCAI 0014-2956 Google Scholar
A. P. Mendham et al.,
“Vibrational spectroscopy and DFT calculations of Di-amino acid cyclic peptides. Part I: Cyclo(Gly-Gly), Cyclo(l-Ala-l-Ala) and Cyclo(l-Ala-Gly) in the solid state and in aqueous solution,”
J. Raman Spectrosc., 40
(11), 1478
–1497
(2009). http://dx.doi.org/10.1002/jrs.v40:11 JRSPAF 0377-0486 Google Scholar
E. Podstawka, Y. Ozaki and L. M. Proniewicz,
“Part III: Surface-enhanced Raman scattering of amino acids and their homodipeptide monolayers deposited onto colloidal gold surface,”
Appl. Spectrosc., 59
(12), 1516
–1526
(2005). http://dx.doi.org/10.1366/000370205775142520 APSPA4 0003-7028 Google Scholar
M. T. Rosado, M. Duarte and R. Fausto,
“Vibrational spectra of acid and alkaline glycine salts,”
Vib. Spectrosc., 16
(1), 35
–54
(1998). http://dx.doi.org/10.1016/S0924-2031(97)00050-7 VISPEK 0924-2031 Google Scholar
S. Stewart and P. M. Fredericks,
“Surface-enhanced Raman spectroscopy of amino acids adsorbed on an electrochemically prepared silver surface,”
Spectrochim. Acta A, 55
(7–8), 1641
–1660
(1999). http://dx.doi.org/10.1016/S1386-1425(98)00294-7 SAMCAS 1386-1425 Google Scholar
BiographyErman K. Oztekin is a PhD student at the University of Florida. He received his BS degree in mechanical engineering from Istanbul University in Turkey in 2008 and his MS degree from the University of Florida in 2012. He is currently working in the Laser Based Diagnostics Laboratory in UF’s Mechanical and Aerospace Engineering Department. His research interests are the effects of the UV lasers on biological materials, fiber optic applications, and developments in laser-based diagnostics. Sarah E. Smith graduated from Morehead State University in Morehead, Kentucky, in May of 2007 with a Bachelor of Science in physics. Upon completion, she attended West Virginia University and graduated with a Master of Science in aerospace engineering with thesis in 2009. She received her PhD in 2012 from the University of Florida under the supervision of D. W. Hahn, where the focus of her work was laser-tissue interactions. David W. Hahn received his BSME and PhD (1992) degrees from LSU in Baton Rouge. Following graduation, he was an NRC associate at the US FDA CDRH (1992 to 1994) and then a member of the technical staff at Sandia National Laboratories (1994 to 1998). He joined the University of Florida (Gainesville, Florida) in 1998. He is currently a professor and department chair in the Department of Mechanical and Aerospace Engineering. He is a fellow of the Society for Applied Spectroscopy and of ASME. |


