|
|
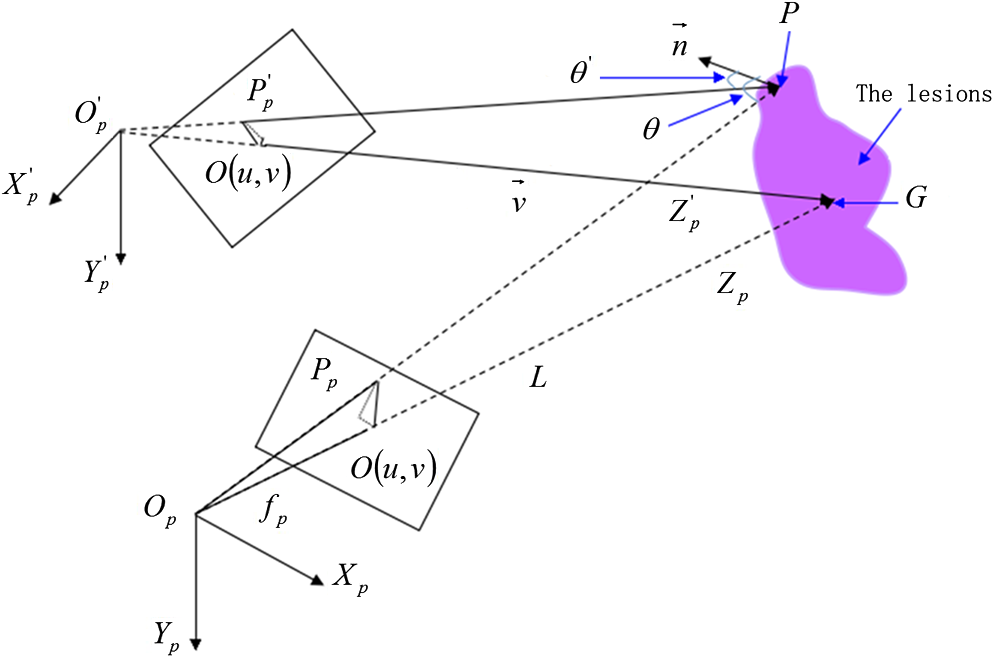
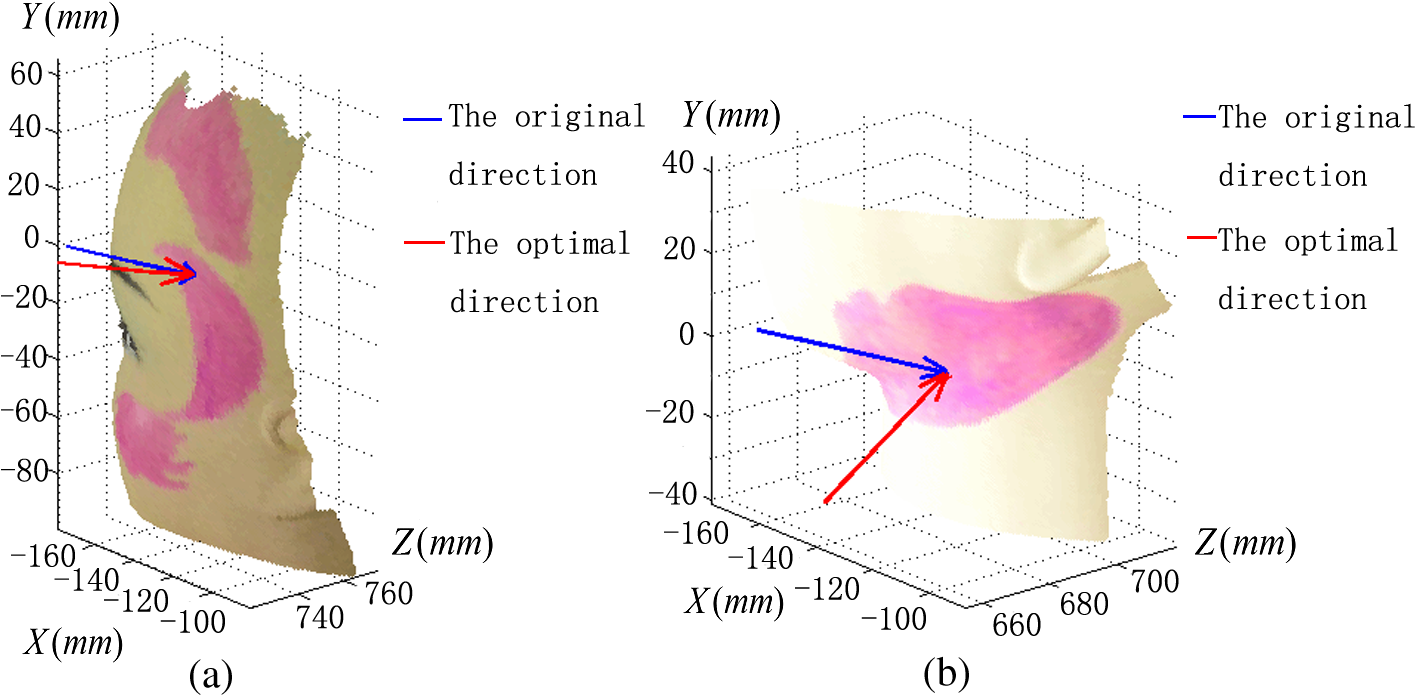
1.IntroductionPort-wine stain (PWS) is a congenital disease caused by hyperplasia and dilatation of skin capillaries.1–3 Pathological changes caused by PWS commonly occur in face and neck, where lesions gradually become darker and thicker as the patient ages. PWS affects people worldwide, and its lesions will not regress without medical intervention.4,5 This disease not only affects the appearance of an individual, but also his/her psychological and physical health. Many therapeutic methods (surgical excision, cryosurgery, and dermabrasion) can be used to treat PWS, but they are outmoded because of their ineffectiveness and adverse secondary effects (e.g., scarring). The use of a pulsed dye laser (PDL) with wavelengths of 585 or 595 nm is the current gold standard for PWS treatment,6–8 but only a few lesions are completely lightened in this method. Approximately 20 to 30% of patients who underwent PDL are considered “poor responders,” and up to 20% of the lesions are not lightened.9 Clinical studies suggested that photodynamic therapy (PDT) is a promising alternative treatment for PDL-resistant PWS lesions.10,11 The General Hospital of the People’s Liberation Army in China uses PDT to treat PWS. This treatment presented more significant improvements in the long-term outcomes with no recurrence. Another clinical study retrospectively reviewed 642 Chinese patients who received PDT therapy (a total of 3066 treatment sessions) within a five-year period from March 2004 to February 2009; 70% of the patients exhibited clearing, presented clearing of , and the patient satisfaction score increased to 7.8.12 In 2014, a long-term follow-up (after 18 years) showed that PDT provided stable results in treating PWS and the lesions did not recur after their complete removal.13 The safety and efficiency of PDT were proven by several clinical tests;14–16 nevertheless, large-scale prospective, comparative, and controlled clinical studies must be conducted to elucidate the complex relationship between treatment outcomes and light parameters, as well as standardize PDT procedures. Complete clearance of severe lesions remains poor despite multiple PDT treatments as indicated in several clinical trials. Gu et al.17 reported a total clearance of only 128 (6.6%) among 1942 lesions in 1385 patients. Xiao et al.12 also revealed that of the patients exhibited complete clearance. As inferred from these studies, the outcomes of PDT for the treatment of PWS remain restricted by inadequate information on lesions11 and unavailable optimal control systems. Light is among the primary factors that affect the efficacy of PDT,18,19 which is strongly influenced by the wavelength and the treatment dosage. Light sources with wavelengths of 532, 510, and 578 nm are currently used in PDT for treatment of PWS; similarly, 457 nm may be potentially applied in PDT for treatment of pink or flat red PWS among infants.20 Treatment dosage is proportional to the irradiance of light sources, illumination time, and the cosine value of the irradiation angle; by contrast, the dosage is inversely proportional to the square of the irradiation distance from a plane light source. The effectiveness of the treatment is constrained by personal experience because light devices are usually controlled through manual operation; hence, comparison and optimization are difficult, particularly in cases with Gauss-shaped irradiance distribution of the laser source. In current research and clinical therapy,20 the common light irradiances used for adults and infants are 100 and , respectively, which are simply achieved by dividing the total power by the illumination area; nevertheless, determining the actual irradiance on the lesions remains a challenge because of their curved shape. Moreover, a local light dose that is higher or lower than the required dosage will induce inconsistent changes in blood flow, oxygen concentration, photosensitizer consumption within local areas, and various degrees of pain; these changes may increase the risks of adverse effects or ineffective treatment.21 Additional parameters must be established to accurately control illumination and develop individualized single treatment plans, thus reducing the incidence of adverse effects and improving the efficacy of PDT for treatment of PWS.21–25 Precise control of the light dose is dependent on the performance of a control system rather than subjective experiences and assessments. So an intelligent irradiation system with a large coverage and flexible conformity should be designed to increase the reliability and consistency of PDT. Zhu et al.22 evaluated the laser source position and patient contour by using an infrared navigation system to calculate a real-time light dose.22 In their investigation, the light dose was monitored using seven detectors to guide light source motion and achieve a uniform light dose distribution. Wang et al.23 solved the spatial relationship between the locations of light sources and lesions by introducing a robotic system, in which the irradiation position and movement speed of the laser source are controlled by simulating hand movements to ensure a uniform distribution of light.23 In this research, an optimization method is proposed to determine the optimal irradiation direction and establish a digital treatment system, which can record, evaluate, and compare treatment dosages and must be effective in one treatment session. First, the point cloud of lesions was reconstructed and preprocessed and their feature parameters were determined. Second, an iterative optimization method with weight coefficients was presented. Finally, two phantom experiments were conducted to verify the feasibility and validity of the proposed method. 2.Materials and Methods2.1.System Configuration and Optimization RoadmapA treatment system consisting of a binocular vision system and an image progress unit was used for three-dimensional (3-D) reconstruction of lesion areas; this reconstructed model will serve as the objective basis to optimize the direction of the irradiation treatment.24,25 As shown in Fig. 1(a), the proposed model for binocular digital illumination comprised a camera, digital projector, and computing unit. A camera (Nikon D3200, Tokyo, Japan) with was used to capture images during the process. A projector (Sony VPL-DX120, KōnanMinato, Tokyo, Japan) with was applied as a space modulator in 3-D reconstruction and as a light device in the treatment. In the experiment, two head models painted with red color were used to represent the patient with PWS lesions. The majority of lesions should receive the required irradiance dosage during treatment. The distribution of light irradiance was optimized by dividing the lesions into small patches and mapping them to the corresponding pixels on the projector. This map was used to control the irradiance on the lesion by adjusting the gray value of the video signals to the projector. The software for optimization included preprocessing of the point cloud of lesions, calculating the irradiance angle, incorporating weight coefficients in the optimization function, and evaluating irradiation [Fig. 1(b)]. The flow path is introduced in detail in the following sections. 2.2.Parameters for OptimizationAfter the camera-projector vision system was calibrated, 3-D modeling of the head was conducted through a gray-coded structured light method based on ray-plane triangulation. The pixels in the camera image and the 3-D points share one-to-one mapping. Digital color images of the skin were used to segment the lesions, and 3-D lesion coordinates were indexed from the two-dimensional projector image.24,25 Although previous studies specified that the point clouds obtained using structured light measurements with MeshLab exhibited high reconstructive accuracy,24 error points may still exist because of incorrect lesion extraction. Processing the point clouds and calculating the characteristic parameters of the lesion surface are important in optimization to accurately characterize the surface features of lesions. 2.2.1.Preprocessing of point cloudsMoving least squares (MLS) was used as a mesh-free method for effective smoothing, error point removal, and approximation and interpolation of the point cloud of lesions.26–29 The moving region around the test point in the 3-D space was determined using the search radius. Supposing that points were located in the moving region and , the point was considered the error point and was removed from the point cloud of lesions. The moving region with points more than three was marked as the region of interest in which smoothing was performed. In MLS, the local function in the moving region of interest with points around is defined in terms of function and several coefficients26,27 as shown in Eq. (1): where refers to the selected complete polynomial bases, and the linear bases are expressed as . coefficients are determined using a weighted least squares method, which minimizes the objective function . is then expressed as where the weighting function is defined to ensure as where and is the spacing parameter. A low value may cause the function to decay faster and the approximation to be more local; the assigned weight is used to control the influence of the local feature on the approximation, which forces the MLS fitting function to interpolate the prescribed function values in these points within the moving region and avoid outliers.29–312.2.2.Normal vectorsIrradiance is proportional to the cosine value of the irradiation angle, which is defined as the angle between the normal and illumination direction vectors. The normal vectors of the lesion surface were calculated to characterize their features. The surface normal of each patch was measured using a conventional method. Normal vectors were calculated using a classical -nearest neighbor algorithm in the moving region in MLS. The points surrounding the point were listed as an array . In addition, the covariance matrix for the sample point can be obtained using the following equation: where is the center of the neighborhood points.Consider the eigenvector equation where is the eigenvalue and is the eigenvector. Assuming , the plane through minimizes the sum of the squared distances to the neighbors of .The eigenvector that corresponds to the minimum eigenvalue can be considered as the normal vector of the point .32 2.2.3.Triangularization of lesionsThe Delaunay method was applied to triangulate the point cloud of lesions and acquire the statistic of the illumination area. The area of each triangle patch was individually calculated and totaled to approximate the area of lesions. When the projector was used as the treatment light source, the corresponding pixel in the projector image that matched the parameters of the binocular system was used to control irradiation. The difference in the irradiance received by the small triangle patches can be identified based on the irradiation angle. In the method described in Sec. 2.2.2, the normal vector for each point in the lesions can be calculated. The surface normal vector of the triangle patch was also set according to the fitting of the corresponding normal vectors of the triangle’s vertices. As shown in Fig. 2, the irradiation angle is the angle between the incident ray and the surface normal of the patch. represents the coordinates of the projector, and is the control pixel in the projector image for the irradiance of the patch. The cosine of is defined in Eq. (7): 2.3.OptimizationAn iterative optimization method with weight coefficients is proposed to optimize the irradiation and achieve the maximum lesion area in a single session. The weight coefficients were established according to the distribution area of irradiation. The optimization function was defined in terms of the weight coefficients and normal vectors of the lesions. The location of the light source was updated based on the optimized vector. 2.3.1.Evaluating irradiationWhen the light source treated the lesions in a specific direction, the merit value in Eq. (8) was used to evaluate the irradiance received by the lesions; this value is the sum of the product of the cosine values of the irradiation angles and the area of each triangle patch. Given that irradiance is proportional to the cosine value, this research posited that more light energy can be utilized during treatment with a higher irradiation value. Hence, where is the irradiation angle of the ’th patch, is the area of the patch, and is the number of triangle patches. During optimization, the assessed value of the initial irradiation is set as . This value can characterize the optimization results to determine the optimal irradiation direction.2.3.2.Determination of optimization functionThe proposed method aimed to expand the area that receives adequate irradiance in a single therapy session when the power of the light source is constant. As discussed in Sec. 2.2.3, the illumination area with different irradiances can be divided according to the cosine value of the irradiation angle. Therefore, the triangle patches were classified by dividing the cosine scope into intervals. Area statistics were established in the same cosine interval to estimate the distribution of the illumination area with different irradiances. The areas of the regions with high cosine values may be increased by selecting the optimal irradiation direction. Thus, the weight coefficients were incorporated in the optimization function according to the percentage of the area. The weight coefficient is defined as where is the total area of the lesions and is the area of the triangle patches with cosine values in the ’th interval.The irradiation direction vector was optimized with weight coefficients on the basis of the normal directions of the triangle patches, as shown in Eq. (10): where is the fitted vector based on the normal directions of the triangle patches. The unit vector is the updated irradiation direction vector.2.3.3.Updating the position of the light sourceThe projector was located at a specific distance from the patient. Suppose the point set of lesions is At the beginning of optimization, the projector was translated to enable its optic axis to pass through the initial point for the direction optimization with whereIn optimization, the optic axis of the projector passed through the initial point. In iteration, the position of the light source was updated according to the optimization results to irradiate the lesions in a new irradiation direction as shown in Fig. 3. and represent the original and updated positions of the projector, respectively. is the optical center of the projector, and is the focal length of the projector that remains constant to avoid recalibration and reduce complexity. The distance between and the optical axis is , and is the optimized vector. The irradiation angles are and when the projector irradiated the lesions at the original and updated positions, respectively. The updated position can be calculated using Eq. (13): where .3.Results3.1.Reconstruction of LesionsPWS lesions were represented by the two head models painted on the face and neck, where PWS frequently occurs. The regions of interest in the head models are shown in Figs. 4(a) and 4(b).The point clouds of lesions were also extracted and shown in Figs. 4(c) and 4(d). 3.2.Processing Point CloudsThe point clouds processed with filtering and smoothing are shown in Fig. 5. In smoothing, the order of the basis function was 4 and the Gaussian function was used as the weighting function. Comparison of the processed and original data in experiments I [Figs. 4(c) and 5(a)] and II [Figs. 4(d) and 5(b)] revealed that the error points were removed. The smoothing degrees of the model data were also significantly improved. Fig. 5Preprocessed point clouds in experiments (a) I and (b) II, and the triangle mesh model of lesions in experiments (c) I and (d) II.  The point clouds were triangulated as discussed in Sec. 2.2 and shown in Figs. 5(c) and 5(d). The numbers of triangles in the two experimental lesions were 69,756 and 44,442, with total lesion areas of 105.7 and , respectively. The area, normal vector, and location of the center of gravity of each triangle were stored and used as basic parameters for optimizing the irradiation direction. 3.3.Optimizing Irradiation DirectionIn each iterative process, the cosine value of the irradiation angle of each triangle irradiated in the previous direction was calculated. This value may be negative because the curvature radii varied in different patches of the complex curved lesion surface. The cosine values were then divided into 11 intervals, and data with non-negative numbers were classified into one interval. The optimized vector was calculated using Eqs. (9) and (10), and the irradiation angle for each patch irradiated in the optimized direction was determined. The sum of the products of the cosine values and area were calculated to assess irradiation and reveal the optimization result. When is closer to the area of the lesions, the optimization is more effective and the lesions can receive more irradiance. The values of during the five iterations in experiments I and II are shown in Fig. 6. Statistical analysis of indicated that the optimization result can achieve a steady state after five iterations despite the occurrence of a slight fluctuation. The value of was evaluated at the original irradiation, and the second value of was calculated by adjusting the optical axis of the projector to pass through the initial point and thus optimize the original irradiation direction. Although this value may be lower than as shown in Fig. 6(b), it can also reach its best value in the following optimization steps. The optimized vectors in the fifth and fourth optimization represented the optimal irradiation direction vectors for experiments I and II, respectively. 3.4.Contrast AnalysisThe irradiance received by a small patch is proportional to the cosine value of the irradiation angle when the optical power is constant. Given this relationship, this study used the area of the lesion patches within the same interval to estimate the distribution of the illumination area. The areas were compared before and after optimization to determine the effect of the proposed optimization method. The directions of the original and optimized irradiation are shown in Fig. 7. The sum of the area of the triangles within the same interval before and after optimization is shown in Fig. 8. Fig. 8Illumination area with different cosines before and after optimization in experiments (a) I and (b) II.  As indicated in Figs. 8(a) and 8(b), the majority of the irradiation angle of the lesions decreased and the area with higher irradiance was improved, which revealed that the projector can effectively irradiate lesions in the optimal direction in each treatment session. 4.Discussion4.1.Optical Parameters of the Human SkinThis study aimed to decrease the irradiation angle of lesions and improve light irradiance in each patch. Optical parameters (e.g., absorption coefficient, scattering coefficient, and photosensitizer absorption) of the human skin were not considered because of the limitations in the experimental conditions and clinical trials. The light absorbed by the photosensitizer was regarded as the effective light dose for PDT. This dose was unequal to the product of the optical density and irradiation time because of the varied complex light propagation in tissues and the optical coefficients of various tissues in different individuals.33–35 The effective absorbed dose of lesions should be compensated when the individual optical properties of the tissue can be measured to improve the efficacy of irradiation. Thus, the optimization results can be evaluated in succeeding treatment sessions. 4.2.Light Source RequirementThe required irradiance was for general PWS treatment. The power requirement of a light source can be estimated using Eq. (14) without considering the optical parameters of the lesion tissue.24 As indicated in Figs. 9(a) and 9(b), the required power of each patch was equal to the standard when the light source irradiated the lesions at the optimal direction in both experiments; as a result, the patches would receive the standard irradiance value. The 3-D irradiance map can be used by doctors to adjust the power of the light source and achieve uniform light distribution on lesions. In the two experiments, the projector also irradiated the lesions by using different powers and revealed the illumination area with an irradiance satisfying the required dosage (Fig. 10). At a power of , the ratio of the effective area to the entire lesion for treatment could reach 98% in experiment I. At 5.7 W, the ratio could reach 99% in experiment II. Uniform light distribution can be achieved by modifying the gray value of the projection pixel that corresponds to the small patches on the lesions. 4.3.Severities of LesionsPWS typically progresses from light pink to dark purple as the patient ages. These colors have been used as clinical indicators of PWS severity. The areas with different colors in the head model can be separately clustered via a superpixel method.24 The severity of lesions in a patch can also be considered as another weight coefficient in the proposed optimization function. Severely affected regions can receive increased irradiance when the irradiation distribution is improved in the optimized direction within a specific power. After the expected light dosimetry of different lesions was established based on severities, and the required power was estimated using Eq. (14), a 3-D power map can guide doctors in adjusting the power of the light source to enable lesions with varying severities to receive optimum irradiance. 4.4.Factors Influencing OptimizationControl of irradiation direction is a complex optimization process affected by several factors. In the proposed optimization method, holes may exist in triangle mesh models because of defective data on the 3-D scanning point cloud. The defect area in the entire area of lesions was in both experiments, so the holes minimally affected the optimization. Thus, the hole-fitting process was omitted to simplify the proposed method and reduce calculation requirements. 4.5.Feasibility Analysis of the Optimization MethodThe point cloud processing was written in C++, and the optimization processing was written in MATLAB® on Microsoft Windows 7 32-bit platform. The execution performances of the two experiments are illustrated in Table 1. In terms of iterations and run-time, the proposed method can be applied in a treatment device to guide irradiation. A novel therapy device combined with the proposed digital illumination via a binocular treatment system incorporated with a robot arm could be an object of further research. The intelligent device that can perform individual therapy exhibits a significant potential in both research and clinical applications. Table 1Execution performance of the optimization algorithm.
5.ConclusionAn optimization method to achieve the optimal irradiation direction in the PDT treatment is proposed in this research. The 3-D morphology and features of lesions provided objective and individualized information to set the weight coefficients, optimize the direction, and evaluate the effectiveness of the optimization. The proposed algorithm demonstrated the improvement and implementability with two experiments, which can be used to accurately set the irradiation direction and improve the efficiency of a single PDT treatment. AcknowledgmentsThis work is supported by the Science Foundation of Beijing Institute of Technology (20131642009) and National Science Foundation of China (30900385). ReferencesS. H. Barsky et al.,
“The nature and evolution of port-wine stains: a computer-assisted study,”
J. Invest. Dermatol., 74
(3), 154
–157
(1980). http://dx.doi.org/10.1111/jid.1980.74.issue-3 JIDEAE 0022-202X Google Scholar
I. S. Carpintero et al.,
“Epithelial and mesenchymal hamartomatous changes in a mature port-wine stain: morphologic evidence for a multiple germ layer field defect,”
J. Am. Acad. Dermatol., 50
(4), 608
–612
(2004). http://dx.doi.org/10.1016/j.jaad.2003.04.002 JAADDB 0190-9622 Google Scholar
W. Wang et al.,
“The pathological characteristics and clinical significances of maturational change of port wine stain,”
Chin. J. Plast. Surg., 26
(2), 103
–106
(2010). http://dx.doi.org/10.3760/cma.j.issn.1009-4598.2010.02.007 Google Scholar
T. S. Lister, P. A. Wright and P. H. Chappell,
“Spectrophotometers for the clinical assessment of port wine stain skin lesions: a review,”
Lasers Med. Sci., 25
(3), 449
(2010). http://dx.doi.org/10.1007/s10103-009-0726-8 LMSCEZ 1435-604X Google Scholar
T. S. Lister, P. A. Wright and P. H. Chappell,
“Simulating light transport through skin for color prediction of port wine stain lesions: a review,”
J. Biomed. Opt., 17
(11), 110901
(2012). http://dx.doi.org/10.1117/1.JBO.17.11.110901 JBOPFO 1083-3668 Google Scholar
S. W. Lanigan and S. M. Taibjee,
“Recent advances in laser treatment of port-wine stains,”
Br. J. Dermatol., 151
(3), 527
–533
(2004). http://dx.doi.org/10.1111/bjd.2004.151.issue-3 BJDEAZ 1365-2133 Google Scholar
C. J. Chang et al.,
“Comparing the effectiveness of 585-nm vs. 595-nm wavelength pulsed dye laser treatment of port wine stains in conjunction with cryogen spray cooling,”
Lasers Surg. Med., 31
(5), 352
–358
(2002). http://dx.doi.org/10.1002/(ISSN)1096-9101 LSMEDI 0196-8092 Google Scholar
S. H. Woo et al.,
“Treatment of vascular skin lesions with the variable-pulse 595 nm pulsed dye laser,”
Dermatol. Surg., 32
(1), 41
–48
(2006). http://dx.doi.org/10.1097/00042728-200601000-00007 DESUFE 1076-0512 Google Scholar
Z. F. Jasim and J. M. Handley,
“Treatment of pulsed dye laser-resistant port wine stain birthmarks,”
J. Am. Acad. Dermatol., 57
(4), 677
–682
(2007). http://dx.doi.org/10.1016/j.jaad.2007.01.019 JAADDB 0190-9622 Google Scholar
K. H. Yuan et al.,
“Photodynamic therapy in treatment of port wine stain birthmarks: recent progress,”
Photodiagnosis Photodyn. Ther., 6
(3-4), 189
–194
(2009). http://dx.doi.org/10.1016/j.pdpdt.2009.08.001 PPTHBF 1572-1000 Google Scholar
H. X. Qiu et al.,
“Twenty years of clinical experience with a new modality of vascular-targeted photodynamic therapy for port wine stains,”
Dermatol. Surg., 37
(11), 1603
–1610
(2011). http://dx.doi.org/10.1111/j.1524-4725.2011.02129.x DESUFE 1076-0512 Google Scholar
Q. Xiao et al.,
“Photodynamic therapy of port-wine stains: long-term efficacy and complication in Chinese patients,”
J. Dermatol., 38
(12), 1146
–1152
(2011). http://dx.doi.org/10.1111/jde.2011.38.issue-12 JDMYAG 0385-2407 Google Scholar
W. X. Yu et al.,
“18 years long-term results of facial port-wine stain (PWS) after photodynamic therapy (PDT): a case report,”
Photodiagnosis Photodyn. Ther., 12
(1), 143
–145
(2015). http://dx.doi.org/10.1016/j.pdpdt.2014.09.004 PPTHBF 1572-1000 Google Scholar
K. H. Yuan et al.,
“Comparison of photodynamic therapy and pulsed dye laser in patients with port wine stain birthmarks: a retrospective analysis,”
Photodiagnosis Photodyn. Ther., 5
(1), 50
–57
(2008). http://dx.doi.org/10.1016/j.pdpdt.2007.12.001 PPTHBF 1572-1000 Google Scholar
K. Gao et al.,
“Side-by-side comparison of photodynamic therapy and pulsed-dye laser treatment of port-wine stain birthmarks,”
Br. J. Dermatol., 168
(5), 1040
–1046
(2013). http://dx.doi.org/10.1111/bjd.2013.168.issue-5 BJDEAZ 1365-2133 Google Scholar
B. Zhang et al.,
“Comparison of pulsed dye laser (PDL) and photodynamic therapy (PDT) for treatment of facial port-wine stain (PWS) birthmarks in pediatric patients,”
Photodiagnosis Photodyn. Ther., 11
(4), 491
–497
(2014). http://dx.doi.org/10.1016/j.pdpdt.2014.06.004 PPTHBF 1572-1000 Google Scholar
Y. Gu et al.,
“Clinical study of 1949 cases of port wine stains treated with vascular photodynamic therapy,”
Ann. Dermatol. Venereol., 134
(3), 241
–244
(2007). http://dx.doi.org/10.1016/S0151-9638(07)91816-5 ADVED7 Google Scholar
T. C. Zhu, J. C. Finlay and S. M. Hahn,
“Determination of the distribution of light, optical properties, drug concentration, and tissue oxygenation in-vivo in human prostate during motexafin lutetium-mediated photodynamic therapy,”
J. Photochem. Photobiol. B, 79
(3), 231
–241
(2005). http://dx.doi.org/10.1016/j.jphotobiol.2004.09.013 JPPBEG 1011-1344 Google Scholar
S. B. Brown,
“The role of light in the treatment of non-melanoma skin cancer using methyl aminolevulinate,”
J. Dermatol. Treat., 14
(s3), 11
–14
(2003). http://dx.doi.org/10.1080/jdt.14.s3.11.14 JDTREY 0954-6634 Google Scholar
Y. Wang et al.,
“New optional photodynamic therapy laser wavelength for infantile port wine stains: 457 nm,”
J. Biomed. Opt., 17
(6), 068003
(2012). http://dx.doi.org/10.1117/1.JBO.17.6.068003 JBOPFO 1083-3668 Google Scholar
L. O. Svaasand et al.,
“Dosimetry model for photodynamic therapy with topically administered photosensitizers,”
Lasers Med. Sci., 11
(4), 261
–265
(1996). http://dx.doi.org/10.1007/BF02134917 LMSCEZ 1435-604X Google Scholar
T. C. Zhu et al.,
“Real-time treatment feedback guidance of pleural PDT,”
Proc. SPIE, 8568 85680O
(2013). http://dx.doi.org/10.1117/12.2005603 PSISDG 0277-786X Google Scholar
X. T. Wang et al.,
“Development and clinical evaluation of medical robot assisted photodynamic therapy of port wine stains,”
Int. J. Med. Robot., 7
(1), 107
–117
(2011). http://dx.doi.org/10.1002/rcs.v7.1 1478-596X Google Scholar
X. M. Hu et al.,
“Three-dimensional illumination procedure for photodynamic therapy of dermatology,”
J. Biomed. Opt., 19
(9), 098003
(2014). http://dx.doi.org/10.1117/1.JBO.19.9.098003 JBOPFO 1083-3668 Google Scholar
F. J. Zhang, X. M. Hu and Q. S. Zhang,
“The evaluation and planning of light dose in photodynamic therapy for port wine stains,”
Proc. SPIE, 9268 926806
(2014). http://dx.doi.org/10.1117/12.2071307 PSISDG 0277-786X Google Scholar
D. Levin,
“The approximation power of moving least-squares,”
Math. Comput., 67
(224), 1517
–1531
(1998). http://dx.doi.org/10.1090/S0025-5718-98-00974-0 MCMPAF 0025-5718 Google Scholar
H. Zhang et al.,
“Consolidation of unorganized point clouds for surface reconstruction,”
ACM Trans. Graph., 28
(5), 176
(2009). http://dx.doi.org/10.1145/1661412.1618522 ATGRDF 0730-0301 Google Scholar
P. Breitkopf et al.,
“Moving least squares response surface approximation: formulation and metal forming applications,”
Comput. Struct., 83
(17), 1411
–1428
(2005). http://dx.doi.org/10.1016/j.compstruc.2004.07.011 CMSTCJ 0045-7949 Google Scholar
M. Alexa et al.,
“Computing and rendering point set surfaces,”
IEEE Trans. Vis. Comput. Graph., 9
(1), 3
–15
(2003). http://dx.doi.org/10.1109/TVCG.2003.1175093 TVCG 1077-2626 Google Scholar
A. Nealen,
“An as-short-as-possible introduction to the least squares, weighted least squares and moving least squares methods for scattered data approximation and interpolation,”
(2015) http://www.nealen.net/projects/mls/asapmls.pdf April ). 2015). Google Scholar
D. Levin,
“Mesh-independent surface interpolation,”
Geometric Modeling for Scientific Visualization, 37
–49 Springer, Berlin, Heidelberg
(2004). http://dx.doi.org/10.1007/978-3-662-07443-5_3 Google Scholar
M. Pauly,
“Point primitives for interactive modeling and processing of 3D geometry,”
Federal Institute of Technology (ETH) of Zurich,
(2003). Google Scholar
Y. Wang, F. G. Liu and Y. Gu,
“The effective absorbed light dose in photodynamic therapy and its measurement,”
Acta Laser Biol. Sin., 13
(2), 91
–96
(2004). http://dx.doi.org/10.3969/j.issn.1007-7146.2004.02.005 1007-7146 Google Scholar
S. L. Jacques,
“How tissue optics affect dosimetry of photodynamic therapy,”
J. Biomed. Opt., 15
(5), 051608
(2010). http://dx.doi.org/10.1117/1.3494561 JBOPFO 1083-3668 Google Scholar
T. S. Lister, P. A. Wright and P. H. Chappell,
“Optical properties of human skin,”
J. Biomed. Opt., 17
(9), 090901
(2012). http://dx.doi.org/10.1117/1.JBO.17.9.090901 JBOPFO 1083-3668 Google Scholar
BiographyFeng-juan Zhang received her BS degree in automation from Zhengzhou University in 2013 and is a candidate for the MS degree in biomedical engineering at Beijing Institute of Technology (BIT). Xiao-ming Hu received his BS degree in physical electronics from BIT in 2001 and received his PhD in optical engineering from BIT in 2006. He has been working at the School of Life Science in BIT since then. His research interests include biomedical photonics, piezosurgery, and optical detection in microfluidics. Ya Zhou received her PhD in optical engineering from BIT in 2000. After two years of postdoctoral research at School of Earth and Space Sciences, Peking University, she joined BIT as an associate professor in 2002. Her research interests include biometrics technology, medical image analysis, and computer vision. |