|
|
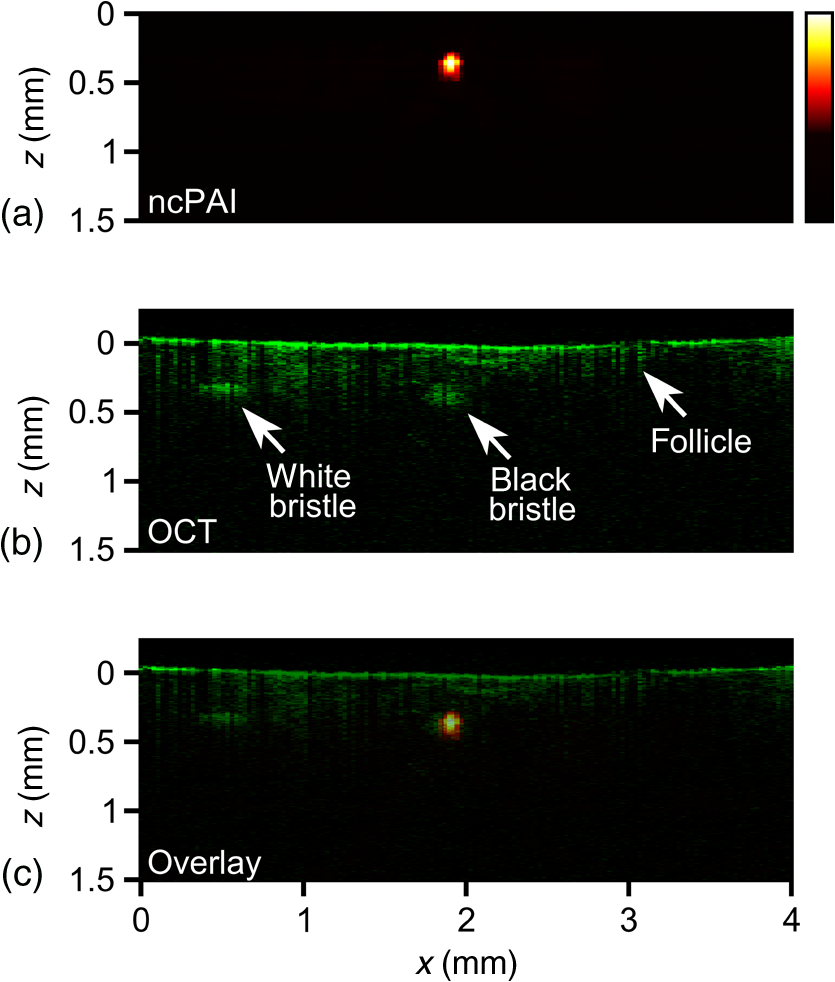
1.IntroductionOptical coherence tomography (OCT) is a high-resolution and contactless imaging method.1,2 It allows acquisition of one-dimensional, two-dimensional (2-D), and three-dimensional (3-D) depth-resolved image data of (sub)surface features in turbid media. OCT employs the partial coherence properties of a broadband light source and interferometry to locate the positions of reflective and backscattering interfaces. This technique was originally developed for ophthalmology, and is currently pursued worldwide intensively for further medical diagnostics of biological tissues. OCT has meanwhile found various applications in biomedical imaging, as well as in imaging of materials.3 OCT allows remote imaging of refractive index changes, thus making it ideal as an interoperative imaging tool. For example, OCT has been used as a monitoring tool during laser surgery of laryngeal carcinoma4 and also to localize tumor margins during neurosurgery of the human cortex.5 Photoacoustic imaging (PAI) is a noninvasive imaging modality which allows structural, functional, and molecular imaging.6 Imaging relies on the PA effect, which describes conversion between light and acoustic waves due to absorption of electromagnetic waves and localized thermal expansion. In practice, short pulses of electromagnetic radiation, mostly short laser pulses, are used to illuminate a sample. The local absorption of the light is followed by rapid heating, which subsequently leads to thermal expansion and generation of broadband acoustic waves. By recording the generated ultrasonic waves the initial distribution of absorbed energy can be assessed. Thus, PAI is a hybrid technique making use of optical absorption and ultrasonic wave propagation. For recording the ultrasonic waves in PAI, usually, contacting piezoelectric transducers are used. These detectors have to be coupled to the sample by a coupling agent. Although this is no major limitation for many applications, there are cases where contact should be avoided, e.g., in burn diagnostics7 or for inline material inspection. For interoperative imaging, contact transducers hinder the operation. Also, for some kinds of surgeries, contact is prohibited, e.g., in brain surgery.8 As an alternative to piezoelectric transducers, interferometric detection schemes have been reported as a means to acquire the PA signals.9–22 These techniques, however, still demand direct contact with the tissue, immersion in water, or at least a liquid layer on top of the sample. Noncontact 3-D imaging, without the need for a coupling agent, was demonstrated in Refs. 7 and 2324.25.26.–27. In these works, the motion of a surface is measured remotely by means of interferometry. Regarding the visualization of blood, spectral-domain OCT (SD-OCT) systems28,29 are fast and, therefore, capable of dynamic observation of blood flow to visualize subsurface vessels at high resolution.30 In contrast, PAI directly images the optical absorption of blood. High contrast is achieved by using a wavelength where blood shows strong optical absorption in contrast to the surrounding tissue. Therefore, PAI is expected to deliver better imaging contrast compared to OCT when imaging static blood as, e.g., found in hemorrhages, vascular occlusions, or in certain microvascular pathologies such as tumors where flow stasis can occur.30 For deep vessels and static blood, OCT mainly delivers information by visualizing the overlying or surrounding subsurface tissue at high resolution.31 Combinations of OCT with PAI have been recently demonstrated.18,31–36 However, with the exception of Ref. 18, these methods rely on contacting transducers. The technique demonstrated in Ref. 18 uses the same low-coherence light source for OCT and noncontact PAI (ncPAI). However, an oil film is needed for coherence gating and for providing a smooth surface. Thus, these approaches do not make full use of the remote nature of OCT, which may limit their applicability. This limitation could be overcome by combining OCT with ncPAI. Recently, we demonstrated ncPAI using a fiber-based interferometer.26 The realization of the detection optics in a fiber-optic network allows straightforward extension with OCT. The present paper is dedicated to this combination. The paper is organized as follows. In Sec. 2, we describe the setup. To enhance readability, the PA part, the OCT part, and the combination of both systems are described separately. In Sec. 3, we demonstrate multimodal ncPAI and OCT imaging on a skeleton leaf phantom and chicken skin phantom. Section 4 is dedicated to the discussion of the results and to an outlook. 2.Setup2.1.Overview–Combined SetupFigure 1 shows a simplified schematic of the combined setup: in a fiber-optic network, noncontact PA detection, and SD-OCT are implemented. For ncPAI, a fiber-optic interferometer based on Ref. 26 is used. Light from the ncPAI sample arm, at a wavelength 1550 nm, is combined with broadband light from the OCT sample arm, with a wavelength between 1200 and 1900 nm, using a coarse wavelength-division multiplexer (CWDM). The CWDM allows bidirectional operation; the bandwidths for the 1310 and 1550 nm spectral bands are 100 and 40 nm, respectively. The output of CWDM is coupled into a collimator (Co1) and focused to a sample surface using an achromatic lens L1. The collimated beam diameter after the fiber collimator is 7 mm; L1 has a focal distance of 75 mm. Light that is reflected from the sample is collected by L1 and Co1, and is directed to CWDM. At the CWDM, the two spectral bands, i.e., 1550 and 1310 nm, are separated and directed back to the respective imaging systems. The output of the ncPAI system is sampled using an 8-bit digital scope (LeCroy WaveRunner 44Xi-A); the output of the OCT camera, i.e., the spectrometer, is read out by a standard personal computer (PC) using Camera Link. To allow 2-D or 3-D measurements, the detector head, formed by Co1 and L1, is mounted on a 2-D translation stage (Physik Instrumente M-413.22S). A program, executed on the scope, is used to control the stages and the scope, and to store the acquired ultrasonic data to a hard disk. Data of the OCT measurement are saved on the PC. To synchronize the scope and PC, the client-server connection is established using an internal network and transmission control protocol/internet protocol (TCPIP). Ultrasonic waves within the sample are excited using pulses from an optical parametric oscillator (OPO, Continuum Surelite OPO Plus). The OPO is pumped at a wavelength of 532 nm, provided by a frequency-doubled Nd:YAG laser with a center wavelength of 1064 nm (Continuum Surelite SL I-20) at 20 Hz repetition rate. The OPO can deliver pulses in the wavelengths region between 680 and 900 nm. The maximum pulse energy after the OPO is 70 mJ, depending on the used wavelength. The pulse length is 3 to 5 ns and the beam diameter is 12 mm. 2.2.Noncontact Photoacoustic ImagingFigure 2 shows a schematic of the ncPAI part. A detailed presentation and discussion of the setup can be found in Ref. 26. In brief, a low-bandwidth cw-detection laser (Koheras AdjustiK) with a wavelength of approximately 1550 nm and a maximum output power of 25 mW is coupled into a single-mode optical fiber. The laser light is split into a reference and a sample arm using a fiber-optic coupler with a coupling ration of 80:20 (S1). Light in the sample arm is directed to the sample via circulator C1, CWDM, Co1, and lens L1. The collected light power, i.e., light that is reflected from the sample surface, collected, and directed back to the PAI system, is typically 1‰ of the incident radiant flux. To increase the power level of the collected light, it is amplified my means of optical amplification in an erbium-doped fiber amplifier (EDFA, Ericsson PGE-608-30-PA) by 30 dB. EDFAs exhibit broadband noise due to amplified spontaneous emission (ASE). To reduce ASE, a small bandwidth filter (Fi, C2) in a reflection configuration is used. Light from the reference path and sample path are brought to inference (via fiber-optic coupler S2) on a self-built balanced photodetector (BD) with a bandwidth of 45 MHz.37 The high-frequency (HF) output of the detector is sampled using the digital scope; the low-frequency (LF) output is used to stabilize the working point of the interferometer using a self-built analog controller (AC) and an electro-optic phase-shifter (, Thorlabs LN68S-FC) without termination to allow phase-shifts of . To match the polarization state between reference and sample path, a three-paddle polarization controller (Pc) is used; to minimize the phase noise, the path lengths of the sample and reference arms are matched. Fig. 2Schematic of the noncontact photoacoustic imaging part with the component labels given as: S1,2, splitter; L1, lens; C1,2, circulators; CWDM, coarse wavelength-division multiplexer; EDFA, erbium-doped fiber amplifier; Pc, polarization controller; AC, analog controller; , phase-shifter; Co1, collimator; BD, balanced photodetector; LF, low-frequency output; HF, high-frequency output; and Fi, filter.  2.3.Optical Coherence TomographyA schematic of the SD-OCT is shown in Fig. 3. As the light source the high-wavelength output of a pulsed supercontinuum laser source (SCS, NKT Koheras SuperK Versa), covering a wavelength region between 1200 and 1900 nm, is used. Due to the CWDM, the effective optical bandwidth is reduced to about 100 nm, leading to a calculated limit for the achievable axial resolution of . The spectrometer consists of a high-speed InGaAs line scan camera (CCD, Sensors Unlimited GL2048), a volume phase holographic transmission grating with , and a lens with a focal distance of 62 mm (L3). The sensor of the InGaAs camera features 2048 pixels with a pitch of and an aperture of . The 12-bit data are transmitted to the PC via Camera Link, allowing a maximum rate of . Fig. 3Schematic of the spectral-domain optical coherence tomography (OCT) part with the component labels given as: SCS, supercontinuum source; CWDM, coarse wavelength-division multiplexer; S3, splitter; Co1–3, collimators; L1–3, lenses; Mi, mirror; Gr, grating; CCD, charge-coupled device line scan camera; and Spec, spectrometer.  Light from the supercontinuum source is divided into sample and reference paths using a coupler (S3). To match the path lengths of the sample and reference arm, a free beam path, consisting of collimator Co2 and a mirror Mi, is used. In the reference arm, a CWDM of the same model as in the sample arm and a lens (L2) are included to compensate for dispersion. Reflected light from sample and mirror is directed to the spectrometer via the two CWDMs and the coupler. Dispersion caused by production-related tolerances of the CWDMs is compensated numerically during data processing. 3.Experiments3.1.Three-Dimensional Imaging on a Skeleton Leaf Phantom3-D imaging is demonstrated on a skeleton leaf/agarose phantom. A bleached skeleton leaf of a Ficus religiosa was obtained at a local flower shop. To permit PA wave generation, the bleached leaf was stained with ink (Pelikan 4001 brillant black) and sealed with clear lacquer to avoid bleeding into the agarose. Excessive ink was removed by rinsing the stained leaf in water. The skeleton leaf was then embedded into agarose. Agarose gel was prepared by dissolving agarose in water with a content of 1 g agarose per 50 mL water. First, a layer of agarose gel with a thickness of 3 mm was filled into a Petri dish and cooled in a refrigerator. The skeleton leaf was then placed onto the agarose layer and embedded with an additional layer of agarose gel with a thickness of 1.5 mm. PA signals were generated with the OPO at a wavelength of 710 nm and a radiant exposure of ; the power of the ncPAI interrogation beam on the sample surface was 5 mW. Ultrasonic and OCT data were acquired by raster scanning the detector head by points with a step size of , leading to a total imaging area of . In ncPAI, the signal-to-noise ratio depends on the returned light intensity. To maximize the returned light intensity, the focus was placed onto the specimen’s surface. For OCT, the point of zero path difference between sample and reference arms was put inside the sample to allow measurement of the whole sample thickness. The OCT data were acquired simultaneously with the PA data; the PA signals were averaged two times, the OCT signals 200 times. After data acquisition, a 3-D PA image was reconstructed by a 3-D k-space pseudospectral time-domain algorithm using the k-wave toolbox.38,39 Figure 4(a) shows the respective maximum intensity plot (MIP) of the PA reconstruction; no image processing was applied in the figure. The MIP for the OCT measurement is shown in Fig. 4(b). An overlay of the PAI and OCT images is displayed in Fig. 4(c). The images are intrinsically coregistered. The intensity of the structures, however, differs in the PAI and the OCT images, as finer vessel structures produce lower PA signals than thicker ones. Furthermore, some of the finer structures are not well-resolved in the PAI images. This could be due to two different reasons: one reason may be that staining, rinsing, and sealing did not work well on all of the small vessels. Second, while PAI shows the stained structure, OCT shows every point where a particle/void/area exhibits a sudden change in the refractive index. Thus, OCT also shows defibrated structures joined by lacquer, or any air chamber that has formed nearby the structure during embedding. Fig. 4Noncontact photoacoustic imaging (ncPAI) and OCT measurement of a skeleton leaf/agarose phantom: (a) maximum intensity plot (MIP) of the photoacoustic reconstruction; (b) MIP of the OCT measurement; (c) the overlay of OCT and PAI measurement shows perfect matching; and (d) volume rendering of OCT data (leaf in red and agarose surface in cyan) and of PAI data (gray). Only half of the volume rendered PAI data are presented for illustrative reasons. 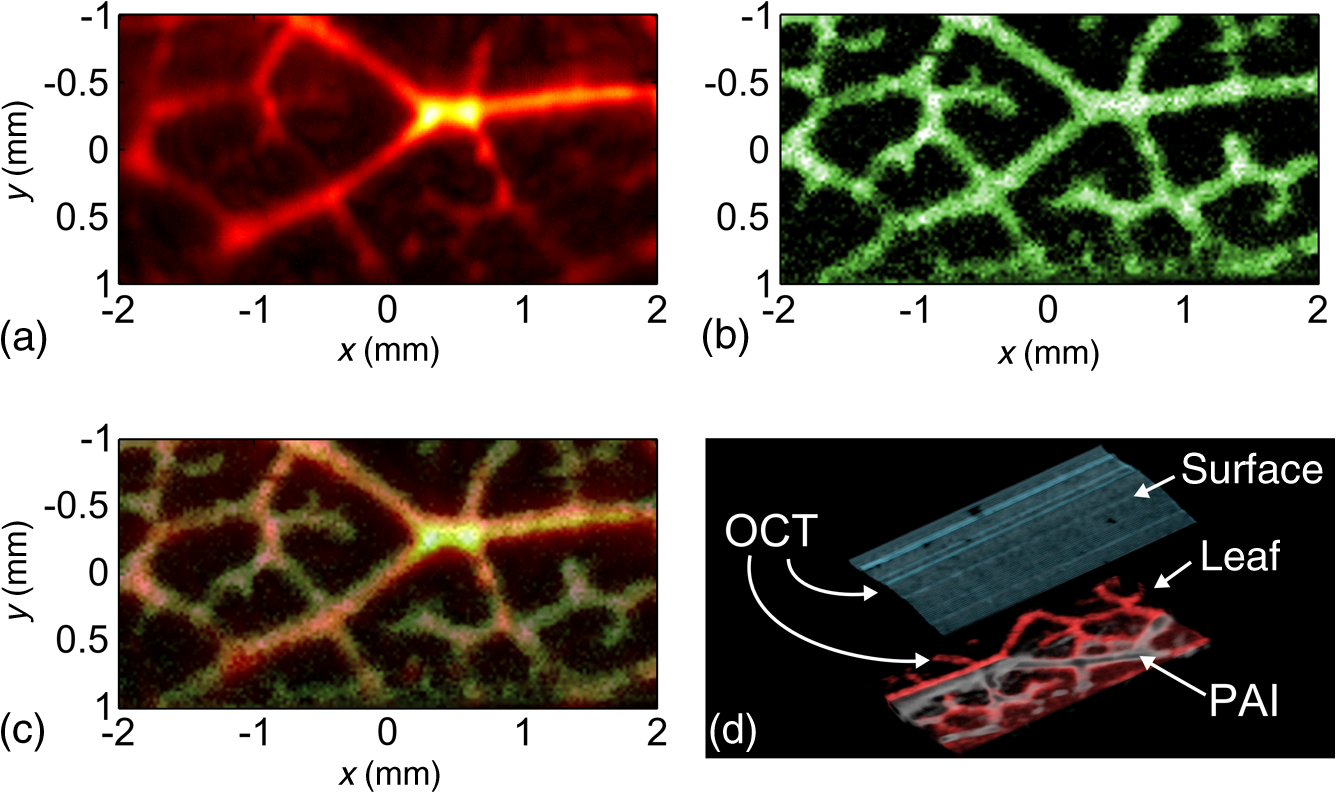 Volume-rendered 3-D data are shown in Fig. 4(d). For OCT, the agarose surface is presented in cyan, and the skeleton leaf in red. Half of the leaf region is overlaid with the volume rendering data of the PAI measurement (gray) and confirms the perfect coregistration. Dark spots on the surface in Fig. 4(d) are due to imperfections of the agarose layer. 3.2.Two-Dimensional Imaging on a Chicken Skin PhantomThe current implementation of the setup with scanning stages leads to long measurement times, presumably impeding many real-life applications. However, for some applications a B-scan may be sufficient to estimate the depths of features, e.g., blood vessels, from 2-D images. Such 2-D imaging is demonstrated on a chicken skin phantom. One white bristle and one black bristle were inserted into the tissue beneath the skin of a chicken thigh to mimic blood vessels. The diameter was for both bristles. PA signals were generated at a wavelength of 760 nm with a radiant exposure of ; the power of the PAI detection beam was 11 mW. PA signals and OCT data were acquired simultaneously on a length of 4 mm with a step size of , i.e., on 161 points. The PA signals were recorded without averaging. A 2-D image was reconstructed from the PA data using a Fourier domain synthetic aperture focusing technique.23,40 In the photoacoustic reconstruction in Fig. 5(a), the black bristle can be identified. The white bristle is not visible, as no (or little) PA signals had been generated due to low absorption. In Fig. 5(b), the OCT measurement is shown. Because of their different specific scattering properties, the white bristle only facilitates visualization of the upper surface, while for the black bristle almost the complete cross section is detectable. Besides both bristles, the surface of the chicken skin and a hair follicle (at can also be identified. The overlay of the OCT and the ncPAI measurement in Fig. 5(c) matches perfectly. 4.Discussion and OutlookIn Sec. 3, multimodal ncPAI and OCT imaging were discussed. As the PA signals are received at the same positions as the OCT A-scans, the PA reconstruction and the OCT image are intrinsically coregistered. This is, of course, only the case if the correct sound velocity and refractive index are used for the PA reconstruction and the OCT image, respectively. An incorrect sound velocity leads to displaced features in the PA reconstruction. However, application of a wrong sound velocity also leads to blurred images, and is thus usually apparent. On the other hand, an incorrect “first guess” of the refractive index just leads to displacements along the -axis in OCT, and is not that easy to recognize. This characteristic, however, also offers the possibility of determining unknown refractive indices: if the refractive index of a specimen is not known, the index can be varied until the OCT image matches with the PA reconstruction. The measurements in Sec. 3 were performed on samples with relatively flat surfaces. We therefore assumed the surfaces to be flat planes in the PA reconstructions. If samples exhibit strong surface modulations, i.e., if the surface modulation is of the same order as the smallest feature to be resolved, this assumption leads to blurred images. In this case, the information of the surface topology can be extracted from the OCT images and can be incorporated in dedicated reconstruction algorithms.41 For the measurements, the detection head was scanned using two translation stages and the OCT and PAI data were simultaneously acquired. After each step of the translation stages, the measurements were paused for a short time period to reduce mechanical vibrations, before the next measurements were started. This lead to increased scanning times, and was one of the reasons why we simultaneously acquired OCT and PAI data, i.e., to speed up the measurement. The long measurement times lead to drying of the samples. Consequently, their shape changed slightly during the measurement. By measuring OCT and PAI simultaneously, perfect coregistration of both modalities could be achieved for 3-D imaging of the agarose phantom and for 2-D imaging of the chicken skin phantom. However, even with simultaneous scanning, the measurement times and the resulting changes in the chicken skin phantom were too high to allow for a 3-D measurement. Simultaneous measurement, however, comes at a cost. To maximize light collection for ncPAI, the focus was placed onto the specimen’s surface. As the same focusing lens was used for OCT and ncPAI, it was not possible to choose the focus for OCT independently. Usually, in case of highly reflecting surfaces, the focus of OCT is either set significantly beyond the surface inside the sample or the sample surface is tilted. Thereby, local reflections of high intensity at the surface are avoided in favor of reflections at inner structures. Tilting was not an option because it would have significantly reduced light collection for ncPAI and, in the presented setup, the chromatic focal shift of the achromatic objective lens fixed the focus for OCT above the sample surface, at the cost of a degradation of the lateral resolution and low signal intensity. The latter has been compensated by averaging over 200 A-scans. In the presented setup, the spot diameter at the sample surface of the interrogation beam was about , which was also the lateral resolution of OCT on the sample surface. Deeper inside the structure, the lateral resolution degraded. For example, in a depth of 0.5 mm, the beam diameter broadened to about . This resulted in lateral blurring of the structures, as can be seen, e.g., in Fig. 5. The nominal diameter of the structure of could be reproduced in the axial direction, while in lateral direction a size of was obtained by OCT. In the PA image, a diameter of can be reproduced in the lateral and axial directions. No serious broadening was expected for PAI, as the system parameters were chosen to allow for a resolution of about : the spot diameter of permits acquisition of acoustic waves of frequencies up to 50 MHz. This frequency is matched to the bandwidth of the photodetector of 45 MHz; in the measurement, the step size was chosen to be , fitting the aforementioned parameters. In future, the translation stages will be replaced by galvanometer mirror scanners, as typically used in OCT systems. Thereby, the imaging times in ncPAI could be significantly reduced. For example, 2-D PA section imaging using 100 detection points would require 5 s, when using an excitation laser with 20 Hz. For higher repetition rates, the measurement times are accordingly reduced. OCT measurement times could be reduced even further to the millisecond region. Thus, instead of simultaneous data acquisition, the OCT and PAI data could be acquired sequentially, without requiring significantly more measurement time. Subsequent scanning allows for using different focal positions for the ncPAI and the OCT scan, i.e., the focal point could be positioned on the sample surface and inside the sample for ncPAI and OCT imaging, respectively. 5.ConclusionIn conclusion, we presented multimodal ncPAI and OCT imaging: ncPAI was realized using an interferometric technique to acquire ultrasonic displacements on the surfaces of samples. The interferometer was realized in a fiber-optic network. In the same fiber-optic network, a SD-OCT system was implemented. The light sources for ncPAI and OCT were multiplexed into one fiber using a wavelength-division multiplexer. Light reflected or scattered from the sample was collected, spectrally demultiplexed, and guided to the respective OCT and ncPAI detection units. We presented 3-D imaging of a skeleton leaf/agarose phantom and 2-D imaging on a chicken skin phantom. As the same objective was used for ncPAI and OCT, and as the ncPAI and OCT data were simultaneously acquired, the acquired images are intrinsically coregistered. AcknowledgmentsThis work has been supported by the Austrian Science Fund (FWF), Project No. P25584-N20, the European Regional Development Fund (EFRE) in the framework of the EU-program Region 13, and the Federal State Upper Austria. ReferencesD. Huang et al.,
“Optical coherence tomography,”
Science, 254 1178
–1181
(1991). http://dx.doi.org/10.1126/science.1957169 SCIEAS 0036-8075 Google Scholar
Handbook of Optical Coherence Tomography, Marcel Dekker, New York
(2002). Google Scholar
D. Stifter,
“Beyond biomedicine: a review of alternative applications and developments for optical coherence tomography,”
Appl. Phys. B, 88 337
–357
(2007). http://dx.doi.org/10.1007/s00340-007-2743-2 APBOEM 0946-2171 Google Scholar
A. V. Shakhov et al.,
“Optical coherence tomography monitoring for laser surgery of laryngeal carcinoma,”
J. Surg. Oncol., 77 253
–258
(2001). http://dx.doi.org/10.1002/(ISSN)1096-9098 JSONAU 0022-4790 Google Scholar
S. A. Boppart et al.,
“Optical coherence tomography for neurosurgical imaging of human intracortical melanoma,”
Neurosurgery, 43 834
–841
(1998). http://dx.doi.org/10.1097/00006123-199810000-00068 NEQUEB Google Scholar
L. V. Wang,
“Multiscale photoacoustic microscopy and computed tomography,”
Nat. Photonics, 3 503
–509
(2009). http://dx.doi.org/10.1038/nphoton.2009.157 1749-4885 Google Scholar
G. Rousseau et al.,
“Non-contact biomedical photoacoustic and ultrasound imaging,”
J. Biomed. Opt., 17 061217
(2012). http://dx.doi.org/10.1117/1.JBO.17.6.061217 JBOPFO 1083-3668 Google Scholar
V. Ntziachristos, J. S. Yoo and G. M. van Dam,
“Current concepts and future perspectives on surgical optical imaging in cancer,”
J. Biomed. Opt., 15 066024
(2010). http://dx.doi.org/10.1117/1.3523364 JBOPFO 1083-3668 Google Scholar
J. D. Hamilton and M. O’Donnell,
“High frequency ultrasound imaging with optical arrays,”
IEEE Trans. Ultrason. Ferroelectr. Freq. Control, 45 216
–235
(1998). http://dx.doi.org/10.1109/58.646927 ITUCER 0885-3010 Google Scholar
B. P. Payne et al.,
“Optoacoustic tomography using time-resolved interferometric detection of surface displacement,”
J. Biomed. Opt., 8 273
–280
(2003). http://dx.doi.org/10.1117/1.1559727 JBOPFO 1083-3668 Google Scholar
S. A. Carp et al.,
“Optoacoustic imaging using interferometric measurement of surface displacement,”
Appl. Phys. Lett., 85 5772
–5774
(2004). http://dx.doi.org/10.1063/1.1831569 APPLAB 0003-6951 Google Scholar
S. A. Carp and V. Venugopalan,
“Optoacoustic imaging based on the interferometric measurement of surface displacement,”
J. Biomed. Opt., 12 064001
(2007). http://dx.doi.org/10.1117/1.2812665 JBOPFO 1083-3668 Google Scholar
Y. Hou et al.,
“Thin polymer etalon arrays for high-resolution photoacoustic imaging,”
J. Biomed. Opt., 13 064033
(2008). http://dx.doi.org/10.1117/1.3042260 JBOPFO 1083-3668 Google Scholar
E. Zhang, J. Laufer and P. Beard,
“Backward-mode multiwavelength photoacoustic scanner using a planar Fabry-Perot polymer film ultrasound sensor for high-resolution three-dimensional imaging of biological tissues,”
Appl. Opt., 47 561
–577
(2008). http://dx.doi.org/10.1364/AO.47.000561 APOPAI 0003-6935 Google Scholar
E. Z. Zhang et al.,
“In vivo high-resolution 3D photoacoustic imaging of superficial vascular anatomy,”
Phys. Med. Biol., 54 1035
–1046
(2009). http://dx.doi.org/10.1088/0031-9155/54/4/014 PHMBA7 0031-9155 Google Scholar
H. Grün et al.,
“Three-dimensional photoacoustic imaging using fiber-based line detectors,”
J. Biomed. Opt., 15 021306
(2010). http://dx.doi.org/10.1117/1.3381186 JBOPFO 1083-3668 Google Scholar
R. Nuster et al.,
“Photoacoustic microtomography using optical interferometric detection,”
J. Biomed. Opt., 15 021307
(2010). http://dx.doi.org/10.1117/1.3333547 JBOPFO 1083-3668 Google Scholar
Y. Wang, C. Li and R. K. Wang,
“Noncontact photoacoustic imaging achieved by using a low-coherence interferometer as the acoustic detector,”
Opt. Lett., 36 3975
–3977
(2011). http://dx.doi.org/10.1364/OL.36.003975 OPLEDP 0146-9592 Google Scholar
R. Nuster et al.,
“Downstream Fabry-Perot interferometer for acoustic wave monitoring in photoacoustic tomography,”
Opt. Lett., 36 981
(2011). http://dx.doi.org/10.1364/OL.36.000981 OPLEDP 0146-9592 Google Scholar
T. Berer et al.,
“Characterization of broadband fiber optic line detectors for photoacoustic tomography,”
J. Biophotonics, 5 518
–528
(2012). http://dx.doi.org/10.1002/jbio.201100110 JBOIBX 1864-063X Google Scholar
A. Rosenthal, D. Razansky and V. Ntziachristos,
“Wideband optical sensing using pulse interferometry,”
Opt. Express, 20 19016
(2012). http://dx.doi.org/10.1364/OE.20.019016 OPEXFF 1094-4087 Google Scholar
R. Nuster, P. Slezak and G. Paltauf,
“High resolution three-dimensional photoacoutic tomography with CCD-camera based ultrasound detection,”
Biomed. Opt. Express, 5 2635
–2647
(2014). http://dx.doi.org/10.1364/BOE.5.002635 BOEICL 2156-7085 Google Scholar
T. Berer et al.,
“Remote photoacoustic imaging on solid material using a two-wave mixing interferometer,”
Opt. Lett., 35 4151
–4153
(2010). http://dx.doi.org/10.1364/OL.35.004151 OPLEDP 0146-9592 Google Scholar
A. Hochreiner et al.,
“Photoacoustic imaging using an adaptive interferometer with a photorefractive crystal,”
J. Biophotonics, 5 508
–517
(2012). http://dx.doi.org/10.1002/jbio.201100111 JBOIBX 1864-063X Google Scholar
G. Rousseau, A. Blouin and J.-P. Monchalin,
“Non-contact photoacoustic tomography and ultrasonography for tissue imaging,”
Biomed. Opt. Express, 3 16
–25
(2012). http://dx.doi.org/10.1364/BOE.3.000016 BOEICL 2156-7085 Google Scholar
A. Hochreiner et al.,
“Non-contact photoacoustic imaging using a fiber based interferometer with optical amplification,”
Biomed. Opt. Express, 4 2322
–2331
(2013). http://dx.doi.org/10.1364/BOE.4.002322 BOEICL 2156-7085 Google Scholar
S. J. Park et al.,
“Noncontact photoacoustic imaging based on all-fiber heterodyne interferometer,”
Opt. Lett., 39 4903
(2014). http://dx.doi.org/10.1364/OL.39.004903 OPLEDP 0146-9592 Google Scholar
R. Leitgeb, C. Hitzenberger and A. Fercher,
“Performance of Fourier domain vs. time domain optical coherence tomography,”
Opt. Express, 11 889
–894
(2003). http://dx.doi.org/10.1364/OE.11.000889 OPEXFF 1094-4087 Google Scholar
J. F. de Boer et al.,
“Improved signal-to-noise ratio in spectral-domain compared with time-domain optical coherence tomography,”
Opt. Lett., 28 2067
–2069
(2003). http://dx.doi.org/10.1364/OL.28.002067 OPLEDP 0146-9592 Google Scholar
R. K. Wang et al.,
“Depth-resolved imaging of capillary networks in retina and choroid using ultrahigh sensitive optical microangiography,”
Opt. Lett., 35 1467
–1469
(2010). http://dx.doi.org/10.1364/OL.35.001467 OPLEDP 0146-9592 Google Scholar
E. Z. Zhang et al.,
“Multimodal photoacoustic and optical coherence tomography scanner using an all optical detection scheme for 3D morphological skin imaging,”
Biomed. Opt. Express, 2 2202
–2215
(2011). http://dx.doi.org/10.1364/BOE.2.002202 BOEICL 2156-7085 Google Scholar
L. Li et al.,
“Three-dimensional combined photoacoustic and optical coherence microscopy for in vivo microcirculation studies,”
Opt. Express, 17 16450
–16455
(2009). http://dx.doi.org/10.1364/OE.17.016450 OPEXFF 1094-4087 Google Scholar
S. Jiao et al.,
“Photoacoustic ophthalmoscopy for in vivo retinal imaging,”
Opt. Express, 18 3967
–3972
(2010). http://dx.doi.org/10.1364/OE.18.003967 OPEXFF 1094-4087 Google Scholar
T. Liu et al.,
“Combined photoacoustic microscopy and optical coherence tomography can measure metabolic rate of oxygen,”
Biomed. Opt. Express, 2 1359
–1365
(2011). http://dx.doi.org/10.1364/BOE.2.001359 BOEICL 2156-7085 Google Scholar
Y. Yang et al.,
“Integrated optical coherence tomography, ultrasound and photoacoustic imaging for ovarian tissue characterization,”
Biomed. Opt. Express, 2 2551
–2561
(2011). http://dx.doi.org/10.1364/BOE.2.002551 BOEICL 2156-7085 Google Scholar
X. Zhang, H. F. Zhang and S. Jiao,
“Optical coherence photoacoustic microscopy: accomplishing optical coherence tomography and photoacoustic microscopy with a single light source,”
J. Biomed. Opt., 17 030502
(2012). http://dx.doi.org/10.1117/1.JBO.17.3.030502 JBOPFO 1083-3668 Google Scholar
J. Bauer-Marschallinger et al.,
“Low-cost parallelization of optical fiber based detectors for photoacoustic imaging,”
Proc. SPIE, 8581 85812M
(2013). http://dx.doi.org/10.1117/12.2002034 PSISDG 0277-786X Google Scholar
B. E. Treeby and B. T. Cox,
“k-Wave: MATLAB toolbox for the simulation and reconstruction of photoacoustic wave fields,”
J. Biomed. Opt., 15 021314
(2010). http://dx.doi.org/10.1117/1.3360308 JBOPFO 1083-3668 Google Scholar
B. E. Treeby et al.,
“Modeling nonlinear ultrasound propagation in heterogeneous media with power law absorption using a k-space pseudospectral method,”
J. Acoust. Soc. Am., 131 4324
(2012). http://dx.doi.org/10.1121/1.4712021 JASMAN 0001-4966 Google Scholar
L. J. Busse,
“Three-dimensional imaging using a frequency-domain synthetic aperture focusing technique,”
IEEE Trans. Ultrason. Ferroelectr. Freq. Control, 39 174
–179
(1992). http://dx.doi.org/10.1109/58.139112 ITUCER 0885-3010 Google Scholar
T. Berer et al.,
“Remote photoacoustic imaging on non-flat surfaces and appropriate reconstruction algorithms,”
Proc. SPIE, 8581 858134
(2013). http://dx.doi.org/10.1117/12.2003566 PSISDG 0277-786X Google Scholar
BiographyThomas Berer received his PhD degree in technical science from the Department of Semiconductor Physics of the Johannes Kepler University of Linz, Austria, in 2007. Since 2007, he has been working for the Sensor Department of the Upper Austrian Research GmbH, which became the Research Center for Non-Destructive Testing (RECENDT) GmbH in 2009. Since 2010, he has been the head of the photoacoustic imaging group. His research interests include photoacoustic imaging and laser ultrasound. Elisabeth Leiss-Holzinger started her research career at the Vienna University of Technology at the Institute of Fundamentals and Theory in electrical engineering, in the field of ferromagnetism and magnetomechanical coupling. Since 2008, she has been working for the Sensor Department of the Upper Austrian Research GmbH, which became the RECENDT GmbH in 2009. Since then, she has focused her research interests on optical coherence tomography and, lately, photoacoustic imaging. Armin Hochreiner received his MSc degree in automation engineering/sensor and microsystems from the Upper Austrian University of Applied Sciences, Wels, Austria, in 2008. Since 2009, he has been with the RECENDT GmbH, mainly working in the field of photoacoustic imaging. In 2013, he completed his PhD thesis on noncontact photoacoustic imaging. Johannes Bauer-Marschallinger received his MSc degree in mechatronics from the Johannes Kepler University of Linz, Austria, in 2007. He then joined the Sensor Technology Department of the Upper Austrian Research GmbH, which became the RECENDT GmbH in 2009. His main research interests are photoacoustic imaging and laser ultrasound. Since 2008, he has been studying time-based media and interactive media at the Art University of Linz. Currently, he is working on his PhD thesis on fiber-based photoacoustic tomography. Andreas Buchsbaum received his PhD degree in applied physics from Technical University of Vienna, Austria, where he worked on scanning tunneling microscopy, x-ray diffraction, and x-ray magnetic circular dichroism on magnetic nanoparticles. He joined RECENDT in November 2012 and was promoted to be the head of the optical coherence tomography group in September 2013. His current research interests include optical coherence tomography and optical methods in nondestructive testing. |