
|
|
1.IntroductionIt is estimated that global cancer incidence and mortality will approximately double during the next two decades.1 The increase is particularly notable in low-income and middle-income countries, where population growth, aging, and reduced mortality from infectious diseases have led to a steadily increasing cancer burden.2 Low-income countries often lack effective cancer screening and prevention services. In these settings, conventional diagnostic methods, such as biopsy and histopathology, are limited by the lack of laboratory infrastructure, the lack of trained personnel,3 and the difficulty of ensuring patient follow-up when test results are not immediately available at the point-of-care. As a result, most cancer patients in low-income countries are diagnosed with advanced-stage disease. There is a widespread need for rapid, effective methods for early detection of cancer at the point-of-care in low-resource settings. Optical imaging technologies have the potential to aid in early detection of cancer in real time at the point-of-care. High-resolution fiber-optic microendoscopy is an imaging technology that has emerged as a cost-effective and noninvasive method for point-of-care diagnosis of precancer and cancer in organ sites including the oral cavity and esophagus.4 This method enables direct visualization of neoplastic indicators such as elevated nuclear-to-cytoplasmic area ratio (N/C ratio), nuclear crowding, and nuclear pleomorphism with similar resolution to confocal microendoscopy but with significantly reduced system complexity and cost.5 These indicators are conventionally only observed during cytologic or histologic analysis following an invasive biopsy. Recent clinical studies of high-resolution fiber-optic microendoscopy have demonstrated that this method can be used to detect neoplastic lesions in patients with oral squamous cell carcinoma6 and Barrett’s esophagus.7 In high-resolution microendoscopy a coherent fiber optic bundle is placed in contact with the tissue, providing a real-time video display showing the size, shape, and distribution of cell nuclei in the epithelium. The field of view is typically 0.5 to 1.0 mm in diameter with a lateral resolution of about . The images may be subjectively interpreted by trained personnel or they may be quantitatively analyzed using image analysis algorithms to diagnostically assess relevant parameters, such as N/C ratio and nuclear size. In vivo clinical data are typically collected in the form of short video sequences, to ensure that a high-quality individual frame free of motion artifact can subsequently be selected for quantitative image analysis.8 The selection of a representative and informative key frame for quantitative image analysis is typically performed manually at some time after the imaging session has been completed, based on a subjective evaluation of image quality and motion artifact by an observer blinded to clinical impression and pathology diagnosis. An algorithm that automates the frame selection procedure is needed to enable real-time quantitative image analysis for high-resolution microendoscopy at the point-of-care. Automated selection of key frames is important in other types of medical imaging as well. Automated frame selection algorithms and procedures have been reported for laparoscopic videos,9 colonoscopy videos,10 capsule endoscopy videos,11–15 cystoscopy videos,16 angiography videos,17 bronchoscopic videos,18 larynx endoscopy videos,19 and retinal videos.20 These algorithms are generally designed to remove redundant video frames and/or identify key frames in order to spare clinicians the need to spend time viewing and selecting individual images, thus enhancing diagnostic efficiency. However, frame selection algorithms previously reported in the literature cannot easily be applied to high-resolution microendoscopy because they are matched to specific features seen in a particular class of videos, as in the case of retinal imaging20 in which key frames are identified through automated recognition of vessel structure. Also, most key frame selection algorithms are intended to summarize the video or automatically detect boundaries between shots in order to structure the video.21 Thus, key frames are identified whenever a significant content change between a frame and its preceding frame can be observed.22,23 These algorithms are not well suited to high-resolution microendoscopy videos, which contain features different from those of most other imaging modalities. High-resolution microendoscopy videos typically show bright nuclei on a dark background, with the nuclear size, shape, and distribution related to the disease state of the tissue. Some frames in each video are expected to contain motion artifact because the field of view is small and the microendoscope is manually held in place by the clinician or inserted through the working channel of an endoscope during in vivo imaging. For these reasons, a key frame selection algorithm specific for high-resolution microendoscopy is required. Here, we present an algorithm that automates the frame selection procedure, which is an important step that is needed to enable real-time quantitative image analysis at the point-of-care. The goal of the present study was to develop an algorithm that automatically selects a high-quality, representative frame free of motion artifact from each video sequence. 2.Automated Frame Selection AlgorithmThe automated frame selection algorithm aims to select a frame that is free of motion artifact, that has sufficient intensity for meaningful analysis but is not saturated, and that is representative. Motion artifact can be minimized by identifying segments within the video sequence with minimal frame-to-frame variation, but this method alone cannot account for image quality, pixel saturation, and low-light levels. Images of optimal quality can be selected by calculating the entropy of the image and identifying feature points in the image, but these methods alone can result in a bias against images that have less distinctly representative features such as neoplastic tissue (in which the nuclei have a more crowded and disordered appearance) or keratinized tissue (in which nuclei are not visible). We, therefore, developed a hybrid frame selection algorithm that uses a combination of these methods. Part 1 of the algorithm identifies a subset of images within the video sequence with minimal frame-to-frame variation. Part 2 selects images within that subset which meet certain criteria related to the entropy of the image. Part 3 uses feature point analysis to select the final frame. Each step is described in further detail below. 3.Part 1: Frame SubtractionSimple subtraction of images can be used to characterize frame-to-frame variation. If the intensity difference between two successive images is low, the two images are similar to each other. The difference between two successive images can be calculated by Eqs. (1) and (2): The steps to select frames which are least affected by motion artifact are described below.
4.Part 2: EntropyEntropy is a statistical feature which represents the diversity of intensity values in an image; it is a measure of information content.24,25 The entropy of an image can be determined from a histogram of the gray level values represented in the image. The entropy is defined as Eq. (3), where is the number of gray levels and is the probability associated with gray level . Images containing pixels with similar intensity values (low pixel-to-pixel contrast) have low entropy values, whereas images with high pixel-to-pixel contrast have high entropy values. Entropy can, therefore, be used to help evaluate whether an image is properly focused, since an in-focus image tends to contain higher pixel-to-pixel contrast and higher information content than an out-of-focus image.26 The steps to select frames which are minimally affected by motion artifact and have sufficient entropy are described below.
5.Part 3: Feature Point DetectionThe third part of the algorithm is based on the detection of points of interest, called feature points, within the image. We adapted a feature-based registration technique known as Speeded Up Robust Features (SURF) for this purpose.27 SURF is widely used in computer vision technologies. The frame selection algorithm utilizes feature points calculated by the SURF algorithm on the assumption that a high-quality representative frame (in focus, no motion blur) possesses, in general, a larger number of feature points than other frames that are lower in quality or less suitable to represent the site. We also tested this assumption experimentally (see Sec. 8). The SURF algorithm is described in detail in the literature.27 It is a scale- and rotation-invariant detector and descriptor of feature points in an image. Its important characteristics are speed, robustness, accuracy, and performance repeatability. In our algorithm, we utilized the feature point detection component of the SURF algorithm. The steps to select a final single frame to represent the video sequence are described below. 6.ExperimentsThe automated frame selection algorithm was implemented using MATLAB software (MathWorks, Inc., Natick, Massachusetts). The algorithm was applied to select a single representative frame from each video in a series of videos acquired in two clinical studies. Results of the automated process were compared to manual frame selection by a trained observer. The purpose of the evaluation was to investigate the similarity of manually and automatically selected frames from the video sequences in the data set. We compared the values of features extracted from frames selected manually and automatically and compared the performance of diagnostic classification algorithms based on these features. 6.1.Patient DataThe performance of the automated frame selection algorithm was evaluated using two high-resolution microendoscopy data sets that have been previously analyzed and reported using manual frame selection.8,28 In these studies, a representative frame from a given video sequence was selected by an observer blinded to clinical impression and pathologic diagnosis, based on subjective evaluation of image quality and the presence/absence of motion artifact. The first data set consists of video sequences collected in vivo from 100 oral sites in 30 patients under an institutional review board (IRB)-approved protocol at the University of Texas M. D. Anderson Cancer Center.28 The second data set consists of video sequences collected in vivo from 167 esophageal sites in 78 patients under an IRB-approved protocol at the Cancer Institute at the Chinese Academy of Medical Sciences.8 Within each data set, the image features and classification results obtained using the new automated frame selection algorithm were compared to the image features and classification results obtained previously using manual frame selection. The composition of the oral data set is summarized in Table 1. Of the 100 oral sites, 45 were non-neoplastic and 55 were neoplastic by histopathology (the gold standard). Mild dysplasia was grouped in the neoplastic category in accordance with the convention used in the original analysis.28 Table 1Composition of the oral data set and pathology diagnosis.
The composition of the esophageal data set is summarized in Table 2. Of the 167 esophageal sites, 148 were non-neoplastic and 19 were neoplastic by histopathology (the gold standard). Low-grade dysplasia was grouped in the non-neoplastic category in accordance with the convention used in the original analysis.8 Table 2Composition of the esophageal data set and pathology diagnosis.
6.2.Quantitative Parameter AnalysisIn order to determine the similarity between automatically selected frames and manually selected frames, diagnostically relevant quantitative parameters were calculated from each set of images. In the oral data set, the N/C ratio was found to be the most diagnostically relevant parameter in the original analysis.28 In the esophageal data set, nuclear size (mean nuclear area) was found to be the most diagnostically relevant parameter in the original analysis.8 N/C ratio and mean nuclear area were calculated using a previously developed image analysis code.8 The same code was used to calculate parameters from manually selected frames and automatically selected frames. Parameter values obtained using manual frame selection were plotted against parameter values obtained using automated frame selection. The linear regression line and value were calculated for each scatter plot. 6.3.Quantitative Image ClassificationThe receiver operator characteristic (ROC) curve was plotted for each data set using the calculated N/C ratio (for oral sites) or mean nuclear area (for esophageal sites). The optimal threshold was set at the Q-point of the ROC curve (the point closest to the upper left corner of the ROC plot). Sensitivity and specificity were calculated using this optimal threshold and using histologic diagnosis as the gold standard. The area under the ROC curve (AUC) was calculated for each data set, using manual frame selection and using automated frame selection. 7.ResultsThe frame selection procedure was fully automated. The time required for automated frame selection was in the original video sequence. Examples of high-resolution microendoscopy video sequences from the oral data set are shown in Video 1 and Video 2. Video 1 shows a non-neoplastic oral site and Video 2 shows a neoplastic oral site. Manually selected frames from Video 1 and Video 2 are shown in Figs. 1(a) and 1(b). Automatically selected frames from Video 1 and Video 2 are shown in Figs. 1(c) and 1(d). Fig. 1Examples of high-resolution microendoscopy frames selected from video sequences in the oral data set. Top row: manually selected frames from (a) non-neoplastic oral site (Video 1) and (b) neoplastic oral site (Video 2). Bottom row: automatically selected frames from (c) non-neoplastic oral site (Video 1) and (d) neoplastic oral site (Video 2). (Video 1: QuickTime, 5.2 MB [URL: http://dx.doi.org/10.1117/1.JBO.20.4.046014.1]. Video 2: QuickTime, 5.9 MB [URL: http://dx.doi.org/10.1117/1.JBO.20.4.046014.2]. Scale ).  Examples of high-resolution microendoscopy video sequences from the esophageal data set are shown in Video 3 and Video 4. Video 3 shows a non-neoplastic esophageal site and Video 4 shows a neoplastic esophageal site. Manually selected frames from Video 3 and Video 4 are shown in Figs. 2(a) and 2(b). Automatically selected frames from Video 3 and Video 4 are shown in Figs. 2(c) and 2(d). Fig. 2Examples of high-resolution microendoscopy frames selected from the esophageal data set. Top row: Manually selected frames from (a) non-neoplastic esophageal site (Video 3) and (b) neoplastic esophageal site (Video 4). Bottom row: Automatically selected frames from (c) non-neoplastic esophageal site (Video 3) and (d) neoplastic esophageal site (Video 4). (Video 3: QuickTime, 1.5 MB [URL: http://dx.doi.org/10.1117/1.JBO.20.4.046014.3]. Video 4: QuickTime, 1.6 MB [URL: http://dx.doi.org/10.1117/1.JBO.20.4.046014.4]. Scale ).  7.1.Quantitative Parameter AnalysisWe compared two quantitative parameters extracted from manually and automatically selected frames: N/C ratio (for oral sites) and mean nuclear area (for esophageal sites). Results are shown in Figs. 3 and 4 for the oral data set and the esophageal data set, respectively. 7.2.Quantitative Image ClassificationFigure 5 depicts the scatter plots of the N/C ratio for each site in the oral data set. Figure 5(a) is a scatter plot of the N/C ratio for manually selected frames and Fig. 5(b) is a scatter plot of the N/C ratio for automatically selected frames. All 100 measurement sites were grouped into three pathology categories in accordance with the original analysis.28 The threshold line set at the Q-point of the ROC curve for classification is shown as a horizontal line in each scatter plot. Fig. 5Scatter plots of N/C ratio for each site in the oral data set: (a) scatter plot of N/C ratio for manually selected frames; (b) scatter plot of N/C ratio for automatically selected frames. The threshold line used for classification is shown as a horizontal line in each scatter plot. The optimal threshold was set at the Q-point of the ROC curve ( for manually selected frames; for automatically selected frames).  Figure 6 depicts the scatter plots of mean nuclear area for each site in the esophageal data set. Figure 6(a) is a scatter plot of the mean nuclear area for manually selected frames and Fig. 6(b) is a scatter plot of the mean nuclear area for automatically selected frames. All 167 measurement sites were grouped into five pathology categories in accordance with the original analysis.8 The threshold line set at the Q-point of the ROC curve for classification is shown as a horizontal line in each scatter plot. Fig. 6Scatter plots of mean nuclear area for each site in the esophageal data set: (a) scatter plot of mean nuclear area for manually selected frames; (b) scatter plot of mean nuclear area for automatically selected frames. The threshold line used for classification is shown as a horizontal line in each scatter plot. The optimal threshold was set at the Q-point of the ROC curve ( for manually selected frames; for automatically selected frames).  ROC curves for the oral data set are shown in Figs. 7(a) (manually selected frames) and 7(b) (automatically selected frames). The Q-points correspond to a sensitivity of 71% and a specificity of 80% for manually selected frames [Fig. 7(a)], and a sensitivity of 69% and a specificity of 76% for automatically selected frames [Fig. 7(b)]. The AUC is 0.82 for manually selected frames and 0.78 for automatically selected frames. With manual frame selection, there were 9 false positives and 16 false negatives. With automated frame selection, there were 11 false positives and 17 false negatives. Fig. 7ROC curves for the oral data set based on (a) manually selected frames and (b) automatically selected frames. The Q-points correspond to a sensitivity of 71% and a specificity of 80% for manually selected frames (a), and a sensitivity of 69% and a specificity of 76% for automatically selected frames (b). The area under the ROC curve (AUC) is 0.82 for manually selected frames and 0.78 for automatically selected frames. 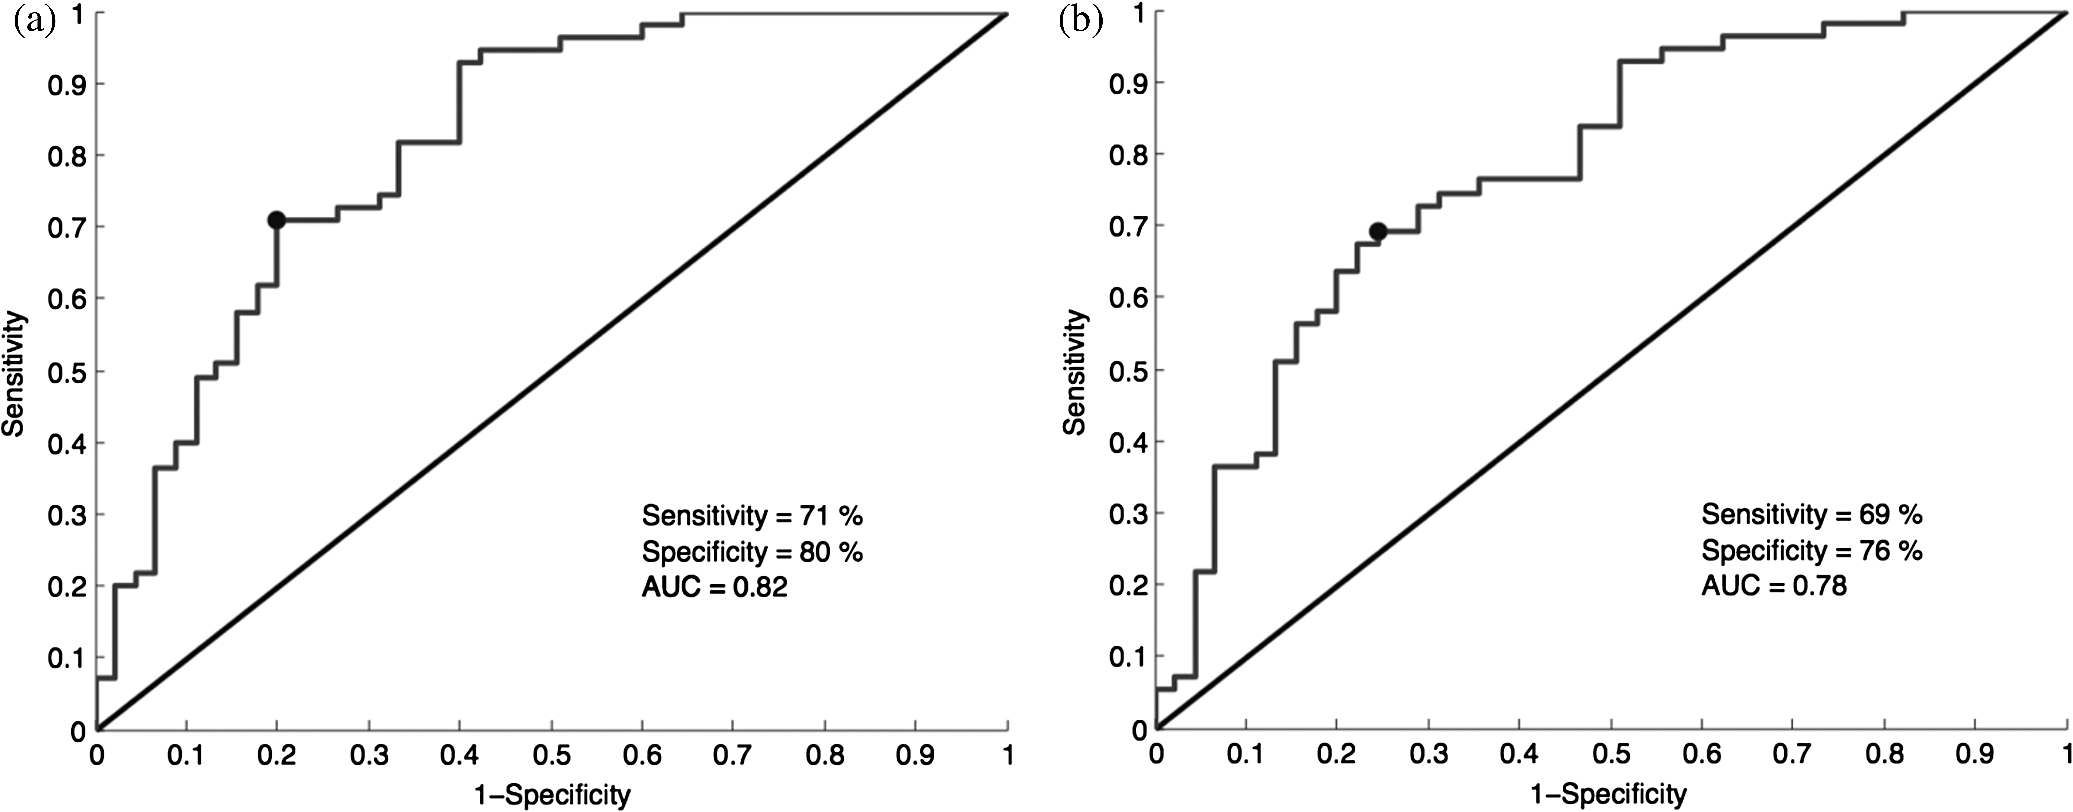 ROC curves for the esophageal data set are shown in Figs. 8(a) (manually selected frames) and 8(b) (automatically selected frames). The Q-points correspond to a sensitivity of 89% and a specificity of 92% for manually selected frames [Fig. 8(a)], and a sensitivity of 84% and a specificity of 92% for automatically selected frames [Fig. 8(b)]. The AUC is 0.92 for manually selected frames and 0.93 for automatically selected frames. With manual frame selection, there were 12 false positives and 2 false negatives. With automated frame selection, there were 12 false positives and 3 false negatives. Fig. 8ROC curves for the esophageal data set based on (a) manually selected frames and (b) automatically selected frames. The Q-points correspond to a sensitivity of 89% and a specificity of 92% for manually selected frames (a), and a sensitivity of 84% and a specificity of 92% for automatically selected frames (b). The AUC is 0.92 for manually selected frames and 0.93 for automatically selected frames.  8.DiscussionIn this study, we developed an automated frame selection algorithm and evaluated its performance relative to manual frame selection using quantitative parameter analysis and quantitative image classification. In both the oral data set and the esophageal data set, the results of the analysis using automated frame selection were very similar to the results previously obtained using manual frame selection by a trained observer. This indicates that the automated frame selection algorithm can successfully select a high-quality representative frame from a high-resolution microendoscopy video sequence. This makes it possible to implement high-resolution imaging with automated frame selection at the point-of-care. Part 3 of the algorithm (feature point detection) relies on the assumption that a high-quality representative frame, in general, has a greater number of feature points than other frames that are lower in quality or less suitable to represent the site. In order to test this assumption, we compared the performance of the full algorithm (Parts 1, 2, and 3) to a modified algorithm in which Parts 1 and 2 were carried out normally, but in Part 3, feature point-based selection was replaced by random selection of one of the remaining candidate frames. In the oral data set, random frame selection in Part 3 reduced the sensitivity from 69% to 64%, reduced specificity from 76% to 69%, and reduced the AUC from 0.78 to 0.69. In the esophageal data set, random frame selection in Part 3 resulted in the same sensitivity (84%), reduced specificity from 92% to 86%, and reduced the AUC from 0.93 to 0.91. These results support the utility of feature point-based selection of high-quality representative frames from in high-resolution microendoscopy videos. A limitation of this study is that the variables, and , which establish the fraction of image frames retained in Parts 1 and 2, were fixed at a user-defined value of 0.5. While this value appears to be quite optimal for both the oral data set and the esophageal data set considered here, other values of and may be more optimal for different data sets. Future work will include development of a robust method to automatically select the values of and . With the implementation of automated frame selection, high-resolution imaging can provide quantitative diagnostic information to endoscopists and physicians at the point-of-care. Moreover, the automated frame selection algorithm makes it possible to perform fully automated diagnosis in real time, which reduces the need for specialized training of endoscopists or physicians. This is especially useful in low-resource settings where the availability of pathologists, physicians, and trained personnel is limited. In conclusion, we have demonstrated an automated frame selection algorithm for high-resolution microendoscopy. The algorithm rapidly selects a high-quality, representative frame with minimal motion artifact from a short video sequence. This automated frame selection algorithm could, in principle, be applied to any high-resolution imaging system capable of digital image acquisition. AcknowledgmentsThis work was supported by Grant Number R21CA156704 from the National Cancer Institute, Grant Number R01EB007594 from the National Institute of Biomedical Imaging and Bioengineering, and Grant Number RP100932 from the Cancer Prevention and Research Institute of Texas. The content is solely the responsibility of the authors and does not necessarily represent the official views of the National Cancer Institute, the National Institute of Biomedical Imaging and Bioengineering, the National Institutes of Health, or the Cancer Prevention and Research Institute of Texas. ReferencesWorld Cancer Report 2008, International Agency for Research on Cancer, Lyon
(2008). Google Scholar
P. Farmer et al.,
“Expansion of cancer care and control in countries of low and middle income: a call to action,”
Lancet, 376
(9747), 1186
–1193
(2010). http://dx.doi.org/10.1016/S0140-6736(10)61152-X LANCAO 0140-6736 Google Scholar
A. Adesina et al.,
“Improvement of pathology in sub-Saharan Africa,”
Lancet Oncol., 14 e152
–157
(2013). http://dx.doi.org/10.1016/S1470-2045(12)70598-3 LOANBN 1470-2045 Google Scholar
M. C. Pierce, D. Yu and R. Richards-Kortum,
“High-resolution fiber-optic microendoscopy for in situ cellular imaging,”
J. Vis. Exp.,
(47), e2306
(2011). http://dx.doi.org/10.3791/2306 JVEOA4 1940-087X Google Scholar
T. J. Muldoon et al.,
“Subcellular-resolution molecular imaging within living tissue by fiber microendoscopy,”
Opt. Express, 15
(25), 16413
–16423
(2007). http://dx.doi.org/10.1364/OE.15.016413 OPEXFF 1094-4087 Google Scholar
T. J. Muldoon et al.,
“Noninvasive imaging of oral neoplasia with a high-resolution fiber-optic microendoscope,”
Head & Neck, 34
(3), 305
–312
(2012). http://dx.doi.org/10.1002/hed.v34.3 1043-3074 Google Scholar
T. J. Muldoon et al.,
“High-resolution imaging in Barrett’s esophagus: a novel, low-cost endoscopic microscope,”
Gastrointest. Endosc., 68
(4), 737
–744
(2008). http://dx.doi.org/10.1016/j.gie.2008.05.018 GAENBQ 0016-5107 Google Scholar
D. Shin et al.,
“Quantitative analysis of high-resolution microendoscopic images for diagnosis of esophageal squamous cell carcinoma,”
Clin. Gastroenterol. Hepatol., 13
(2), 272
–279.e2
(2015). http://dx.doi.org/10.1016/j.cgh.2014.07.030 CGHLAW 1542-3565 Google Scholar
U. von Öshen et al.,
“Key frame selection for robust pose estimation in laparoscopic videos,”
Proc. SPIE, 8316 83160Y
(2012). http://dx.doi.org/10.1117/12.911381 PSISDG 0277-786X Google Scholar
S. Y. Park et al.,
“A colon video analysis framework for polyp detection,”
IEEE Trans. Biomed. Eng., 59
(5), 1408
–1418
(2012). http://dx.doi.org/10.1109/TBME.2012.2188397 IEBEAX 0018-9294 Google Scholar
D. K. Iakovidis, S. Tsevas and A. Polydorou,
“Reduction of capsule endoscopy reading times by unsupervised image mining,”
Comput. Med. Imaging Graph., 34
(6), 471
–478
(2010). http://dx.doi.org/10.1016/j.compmedimag.2009.11.005 CMIGEY 0895-6111 Google Scholar
Q. Zhao and Q. H. Meng,
“WCE video abstracting based on novel color and texture features,”
in Proc. IEEE Int. Conf. Robotics and Biomimetics,
455
–459
(2011). Google Scholar
D. C. Barbosa et al.,
“Automatic small bowel tumor diagnosis by using multi-scale wavelet-based analysis in wireless capsule endoscopy images,”
Biomed. Eng. Online, 11
(3),
(2012). 1475-925X Google Scholar
Y. Yuan and M. Q. H. Meng,
“Hierarchical key frames extraction for WCE video,”
in Proc. IEEE Int. Conf. Mechatronics and Automation,
225
–229
(2013). Google Scholar
I. Mehmood, M. Sajjad and S. W. Balik,
“Video summarization based tele-endoscopy: a service to efficiently manage visual data generated during wireless capsule endoscopy procedure,”
J. Med. Syst., 38
(9), 1
–9
(2014). http://dx.doi.org/10.1007/s10916-014-0109-y JMSYDA 0148-5598 Google Scholar
T. D. Soper, M. P. Porter and E. J. Seibel,
“Surface mosaics of the bladder reconstructed from endoscopic video for automated surveillance,”
IEEE Trans. Biomed. Eng., 59
(6), 1670
–1680
(2012). http://dx.doi.org/10.1109/TBME.2012.2191783 IEBEAX 0018-9294 Google Scholar
T. Syeda-Mahmood et al.,
“Automatic selection of keyframes from angiogram videos,”
in Proc. IEEE Int. Conf. Pattern Recognition,
4008
–4011
(2010). Google Scholar
P. D. Byrnes and W. E. Higgins,
“Construction of a multimodal CT-video chest model,”
Proc. SPIE, 9036 903607
(2014). http://dx.doi.org/10.1117/12.2041609 PSISDG 0277-786X Google Scholar
C.-F. J. Kuo et al.,
“Using image processing technology and mathematical algorithm in the automatic selection of vocal cord opening and closing images from the larynx endoscopy video,”
Comput. Methods Programs Biomed., 112
(3), 455
–465
(2013). http://dx.doi.org/10.1016/j.cmpb.2013.08.005 CMPBEK 0169-2607 Google Scholar
E. Poletti, G. Benedetti and A. Ruggeri,
“Super-image mosaic of infant retinal fundus: selection and registration of the best-quality frames from videos,”
in Proc. IEEE 35th Annual Int. Conf. on Engineering in Medicine and Biology Society,
5883
–5886
(2013). Google Scholar
A. L. Smeaton, P. Over and A. R. Doherty,
“Video shot boundary detection: Seven years of TRECVid activity,”
Comput. Vision Image Underst., 114
(4), 411
–418
(2010). http://dx.doi.org/10.1016/j.cviu.2009.03.011 CVIUF4 1077-3142 Google Scholar
C. Kim and J.-N. Hwang,
“Object-based video abstraction for video surveillance systems,”
IEEE Trans. Circuits Syst. Video Technol., 12
(12), 1128
–1138
(2002). http://dx.doi.org/10.1109/TCSVT.2002.806813 ITCTEM 1051-8215 Google Scholar
X.-D. Zhang et al.,
“Dynamic selection and effective compression of key frames for video abstraction,”
Pattern Recognit. Lett., 24
(9), 1523
–1532
(2003). http://dx.doi.org/10.1016/S0167-8655(02)00391-4 PRLEDG 0167-8655 Google Scholar
D.-Y. Tsai, Y. Lee and E. Matsuyama,
“Information entropy measure for evaluation of image quality,”
J. Digital Imaging, 21
(3), 338
–347
(2008). JDIMEW Google Scholar
S. Srivastava et al.,
“Computer-aided identification of ovarian cancer in confocal microendoscope images,”
J. Biomed. Opt., 13
(2), 024021
(2008). http://dx.doi.org/10.1117/1.2907167 JBOPFO 1083-3668 Google Scholar
L. Firestone et al.,
“Comparison of autofocus methods for automated microscopy,”
Cytometry, 12 195
–206
(1991). http://dx.doi.org/10.1002/(ISSN)1097-0320 CYTODQ 0196-4763 Google Scholar
H. Bay et al.,
“Speeded-up robust features (surf),”
Comput. Vision Image Underst., 110
(3), 346
–359
(2008). http://dx.doi.org/10.1016/j.cviu.2007.09.014 CVIUF4 1077-3142 Google Scholar
M. C. Pierce et al.,
“Accuracy of in vivo multimodal imaging for detection of oral neoplasia,”
Cancer Prevent. Res., 5
(6), 801
–809
(2012). http://dx.doi.org/10.1158/1940-6207.CAPR-11-0555 CPRACC 1940-6207 Google Scholar
Biography |
||||||||||||||||||||||||||||||||||||||||||||||||


