
|
|
1.IntroductionAmoeba is one of the protozoa that exists ubiquitously in nature and can be found commonly in soil and water sources.1 Several amoeba species can cause diseases, including the ones leading to the death of humans and animals,2,3 such as Naegleria fowleri, which causes amoebic meningoencephalitis; Acanthamoeba spp., and Balamuthia mandrillaris, resulting in amoebic encephalitis.2,4 Better understanding of the amoeba life cycle and amoebic infection development can assist in epidemiological monitoring, as well as in the diagnosis and treatment of the diseases. Amoeba in its life cycle can exist in two main forms, the cyst and the trophozoite (trophic amoeba). When the environment does not provide suitable survival conditions, amoeba loses its pseudopodia movement and generates a protective wall to form the cyst, which is immotile and metabolically inert. When the environment becomes favorable for the amoeba survival, the cyst activates, sheds its coat, and becomes trophic amoeba in the process of excystation.5 The cyst in the dormant state is more resistant to disinfection treatment than trophozoite, as has been shown for the cyst stage of Acanthamoeba spp. It has also been found resistant to extreme physical and chemical conditions.2,5,6 To date, research on the amoeba life cycle has been mostly focused on the encystation (the cyst forming), and characteristic signaling pathways have been described.7,8 Until recently, however, the biochemical and molecular mechanisms involved in the transitions from cyst to trophic form and pathways controlling this process were not fully studied and understood. Raman spectroscopy provides information about the chemical structure and could be a useful tool for studying the life cycle of amoeba. Although laser technologies have been widely used in environmental and biomedical sciences, no information has been published on Raman spectroscopic studies of amoeba.9,10 With its molecular specific nature, Raman shifts can serve as fingerprints for identification of the molecular composition and structure and provide information for the characterization of the state of biological samples. The non-invasive advantage renders the possibility for investigation in living samples. Raman spectroscopy has been successfully applied in cell division, cell death, respiration, and other metabolic processes via Raman spectral analysis of the compositional and structural changes of the cellular components.11–14 New methods based on Raman spectroscopy (such as surface-enhanced Raman scattering, coherent anti-stokes Raman scattering, Raman mapping, etc.15) have been developed recently.9,10 For example, Raman mapping can provide information about the distribution of chemical species in the sample;16–18 time- and space-resolved image analysis yields dynamical and distribution information on the studied samples.19,20 In this work, we present the Raman spectral analysis of amoeba (Acanthamoeba polyphaga) in the cyst stages. The changes of the relative intensities of characteristic cellular Raman bands, with a focus on carotenoids spectral components during the amoeba cyst activation and excystation progression are analyzed. The strong correlation between the carotenoid signals and the life cycle stages are observed. The analysis of Raman spectra allows for developing the Raman spectroscopic applications for detection of amoeba in the virulent state and providing a rapid test of amoebic inflammation of environmental mediums, as well as assisting in the early/express diagnostics and treatment of an infection. 2.Materials and Methods2.1.Amoeba CultivationFree-living Acanthamoeba polyphaga (obtained from lake water of the university) was cultivated in straw medium (SM). The medium was prepared by placing 3 g of a dry straw in 400 ml boiling bidistilled water, heating at 100°C for 10 min at agitation and then cooling to room temperature (RT). The pH of the medium was controlled to be 6.8 to 7.2, measured with a SENTRON pH-meter (Titan, Taiwan). One amoeba was placed in 3 ml of the freshly prepared SM and grown at RT. The medium was refreshed once every three days to provide the conditions for also culturing the bacteria B. subtilis, the nutrient for amoeba. The culture dish was changed once every three weeks. 2.2.Amoeba Cyst-Trophozoite TransformationsA single amoeba microorganism was placed in 3 ml of the freshly prepared SM and cultured at RT. The medium was intentionally not regularly refreshed; thus, after five days, the condition was not sufficient for amoeba survival. As a result, the amoeba transformed to cysts. To transform the cyst to the trophozoite form, fresh medium with nutrients was added in a 2:1 proportion. For a quick transformation of the trophozoite to the cyst, cold water was added to the culture dish to decrease the temperature from RT to 4°C. 2.3.Observation of the Amoeba Life CycleFor optical imaging of the amoeba and observation of the amoeba’s life activity in the SM, a Leica confocal laser scanning microscope (TCS SP5, Germany) was used with the image detection in a differential interference contrast mode with a oil emersion objective. To observe the cyst activation and the amoeba excystation, the cysts were prepared by depletion of medium nutrients. Then, fresh SM was added to the depleted medium in glass culture dishes (in 1:1 proportion) to activate the cysts’ metabolism, and the cysts (in 2 ml of SM) were incubated for 6 h at RT. After 6 h, confocal images of the cyst were taken at an interval of every 10 min. To quickly observe the amoeba encystations, the medium for the amoeba was cooled to 4°C, and then confocal images were taken every 1 s. 2.4.Confocal Raman SpectroscopyRaman spectra were acquired using a confocal Raman spectrometer (-SNOM, Witec, Germany) with a 488-nm wavelength excitation laser. For measurements of Raman spectra, a water immersion objective (Nikon, Tokyo, Japan) was used. The cysts in 1 ml of SM were placed in a 5 cm Petri dish with an Si substrate of on the bottom (for spectroscopic measurements). To activate the cyst, 2 ml of fresh SM has been added. The cysts in the medium were incubated for 6 h at RT. The Raman spectra of single cysts were measured to observe the spectral changes during the cyst activation process. The spectra were acquired every 10 min. A low laser power was used (0.1 mW) to avoid damaging the cyst. The experiment was repeated with 15 cells. To study the cyst damage from laser irradiation, Raman spectra of a single cyst were measured every 3 s for 1 h at the laser power of 4 mW. The obtained spectra were processed with a baseline correction and normalized with respect to the band (phenylalanine) for comparison. For the confocal Raman mapping, a objective (Olympus, Japan) was used. The cysts were prepared with 1 ml of SM in a 5 cm Petri dish with an Si substrate () on the bottom and kept for one week at RT. During that time, the sample was depleted of nutrients and dried. As a result, the amoeba transformed to cysts due to the uncomfortable environment. The measurements were performed on the dry samples in air. A sample area of was scanned, with spatial step of in both the and directions. The spatial distribution of intensities of the characteristic Raman bands was mapped to reveal the distribution of the corresponding structures. 3.Results and DiscussionThe amoeba representatives are the Acanthamoeba polyphaga. As for its pathogenecity, Acanthamoeba can cause amoebic keratitis, the vision-threatening infection of the cornea that usually occurs in contact lens wearers.2 In this study, we use Acanthamoeba as a model to discuss the Raman signature of the life cycle of this microorganism. The well-known amoeba life cycle stages2,3,21 observed using microscopic optical imaging were compared with the Raman spectroscopic results. The Acanthamoeba polyphaga has two main states in its life cycle, a trophozoite stage and a double-walled cyst stage. The cell has a single vesicular nucleus and the nucleus has a centrally placed, large, densely staining nucleolus.2 The Acanthamoeba in the trophozoites state ranges in size from 15 to and the cyst size is .3 When food becomes scarce or subject to environmental stresses, the amoeba forms a protective spherical cell wall, decreases its metabolism, and becomes encysted. After completion of encystation, the amoeba is in a resting or stable mature cyst form. When the mature cyst encounters an optimal growth environment, the intercellular processes start to transform the cyst to the activated form, with increasing intercellular motility following detachment of the amoeba from the cyst wall and free amoeba motion inside the cyst envelope. Finally, the amoeba breaks out the cyst envelope as a trophozoite and leaves the empty envelope (cell wall). During the excystation processes, the transportation mediators play a very important role for transformation from a dormant/resting to an active metabolic state.21 In Fig. 1, the amoeba images during the encystation and excystation are presented. To quickly observe the amoeba encystation process, the temperature of the medium in the culture dish was decreased to 4°C. Figure 1(I) depicts amoeba images of the transformation from the trophozoite to the cyst stage as a result of the temperature decrease. One can observe amoeba loses its characteristic pseudopoidal movement and generate a protective wall. Once the appropriate environment is established, the cysts shed their coat and resume trophic or vegetative life through an excystation process, as illustrated in Fig. 1(II). The cysts shown in Fig. 1(II) were obtained as a consequence of the depletion of medium nutrients. To initiate and to observe the excystation, the medium in the culture dish with the cysts was refreshed. After the cysts were exposed to optimal growth conditions, the transformation to the mature cyst stage began. The corresponding images during this process are presented in Fig. 2(I). It is known that this process is characterized by the increasing cytoplasmic motility between the center and periphery of the cyst, involving lipid granules, contractile vacuole, and other subcellular structures.21 The enhanced cytoplasmic movement facilitates the chemicals’ transfer in cytoplasm and the exchange between the endocyst and the plasma membrane, particularly some proteins and the RNA increase observed during the excystation.5,21 Fig. 1Observation of amoeba life cycle using optical (differential interference contrast) images: (I) amoeba encystation and (II) amoeba excystation. 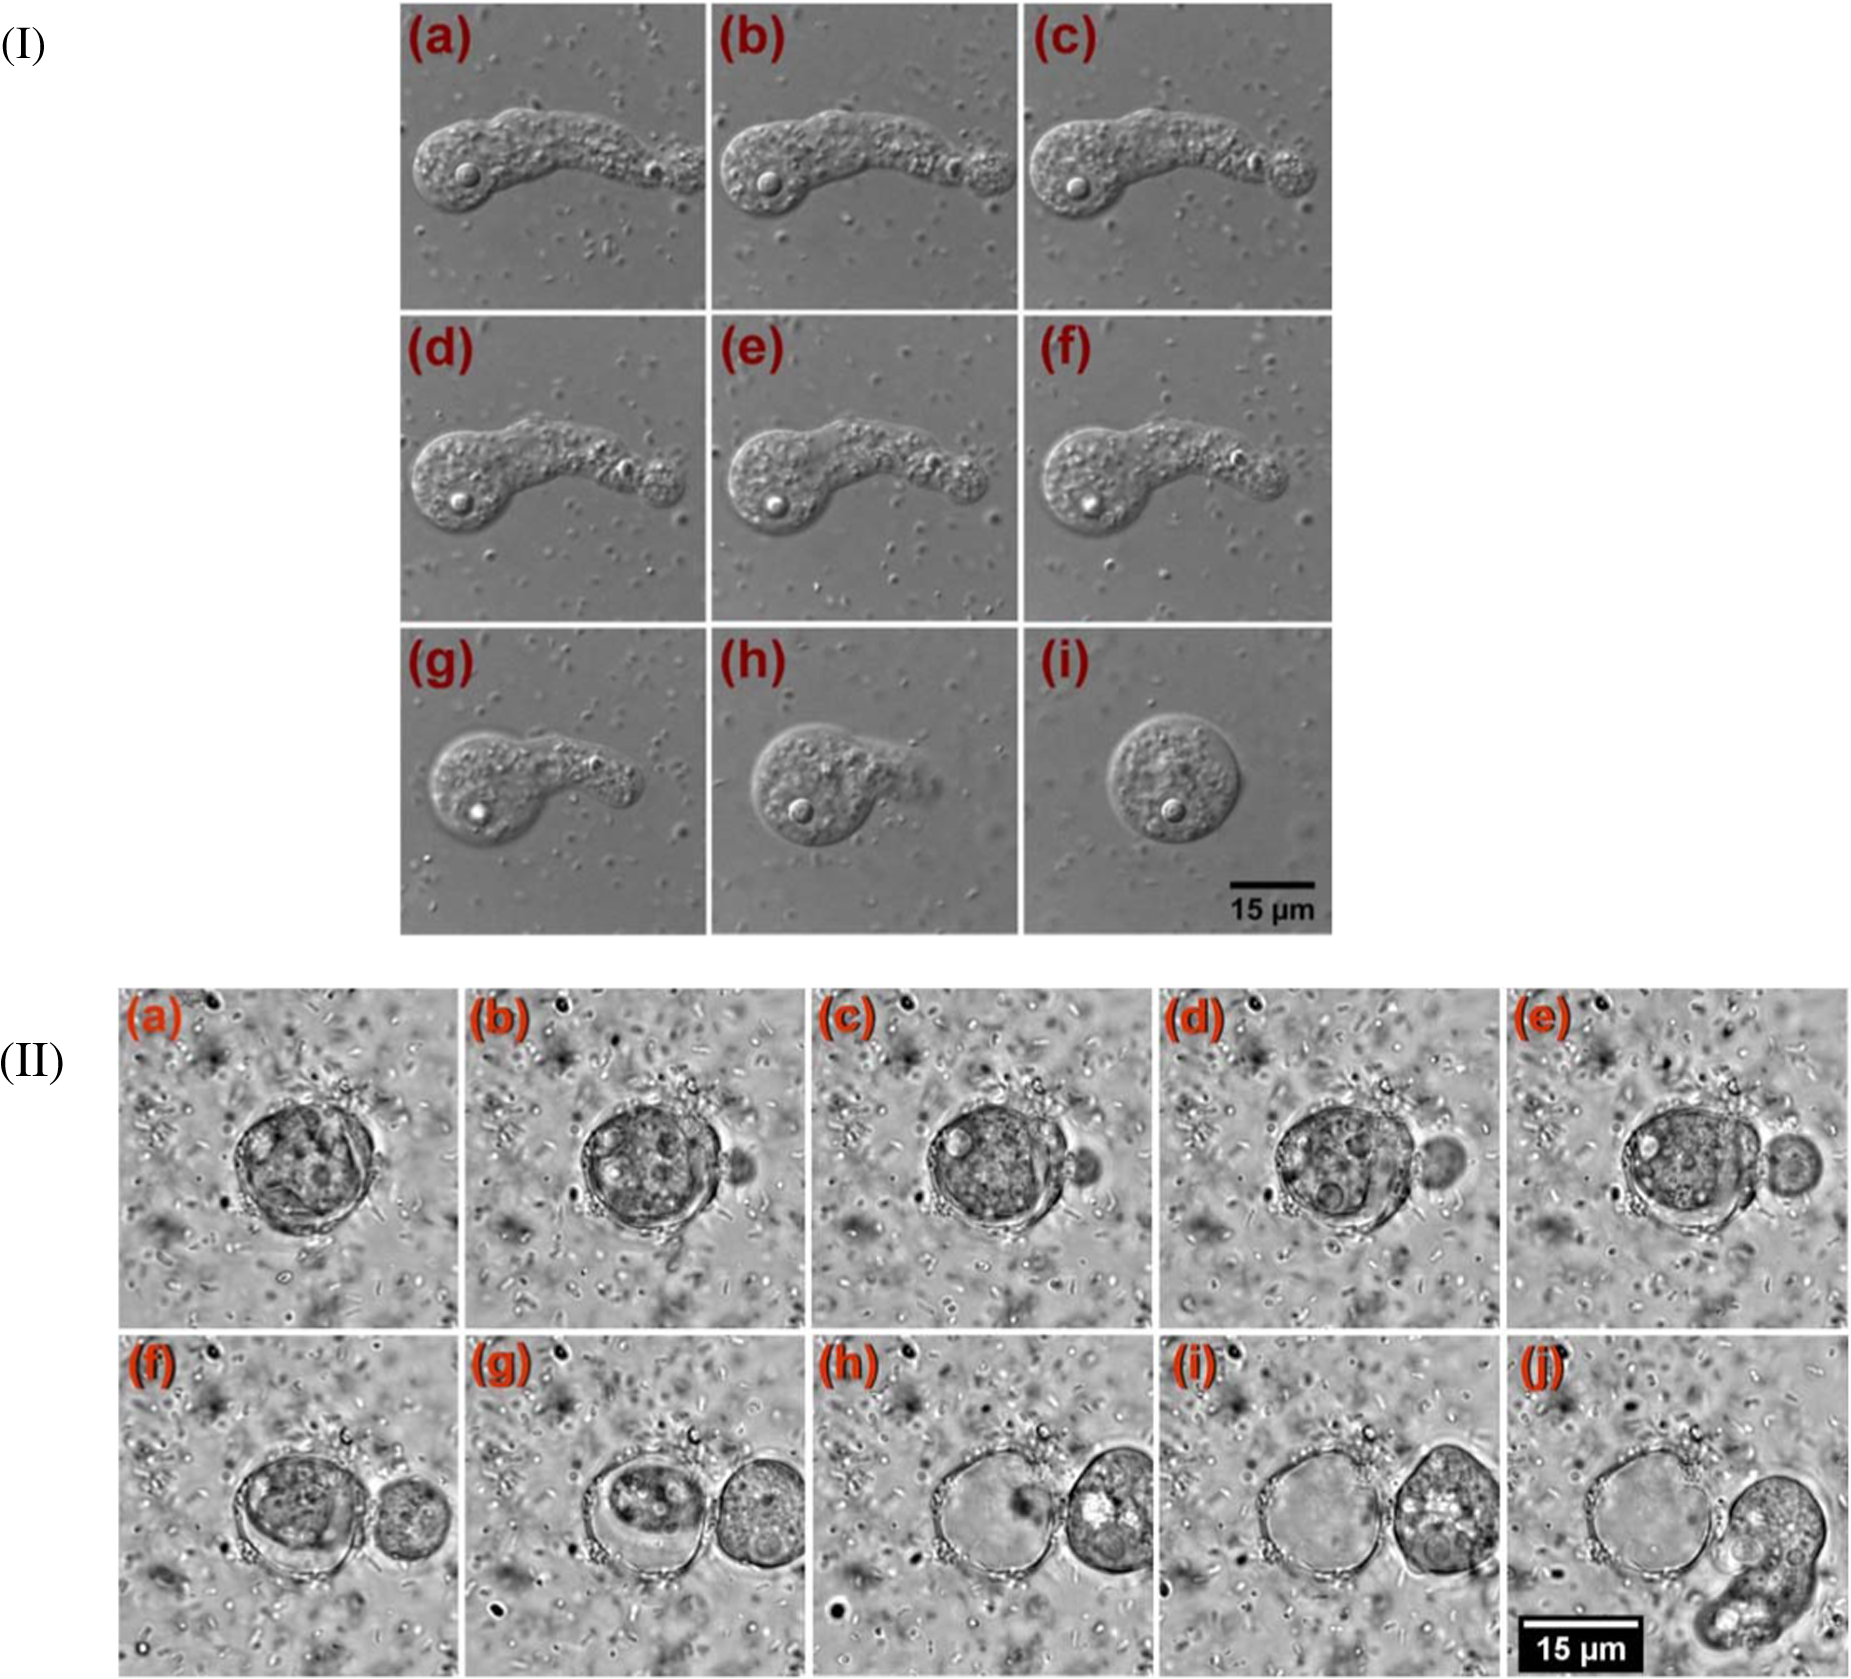 Fig. 2Mature cyst transformation to activated cyst stage: (I) optical images and (II) Raman spectra of mature cyst transforming to activated cyst stage. The spectra intensities are normalized to band. (III) Dependences of Raman peaks intensity on time at cyst activation. 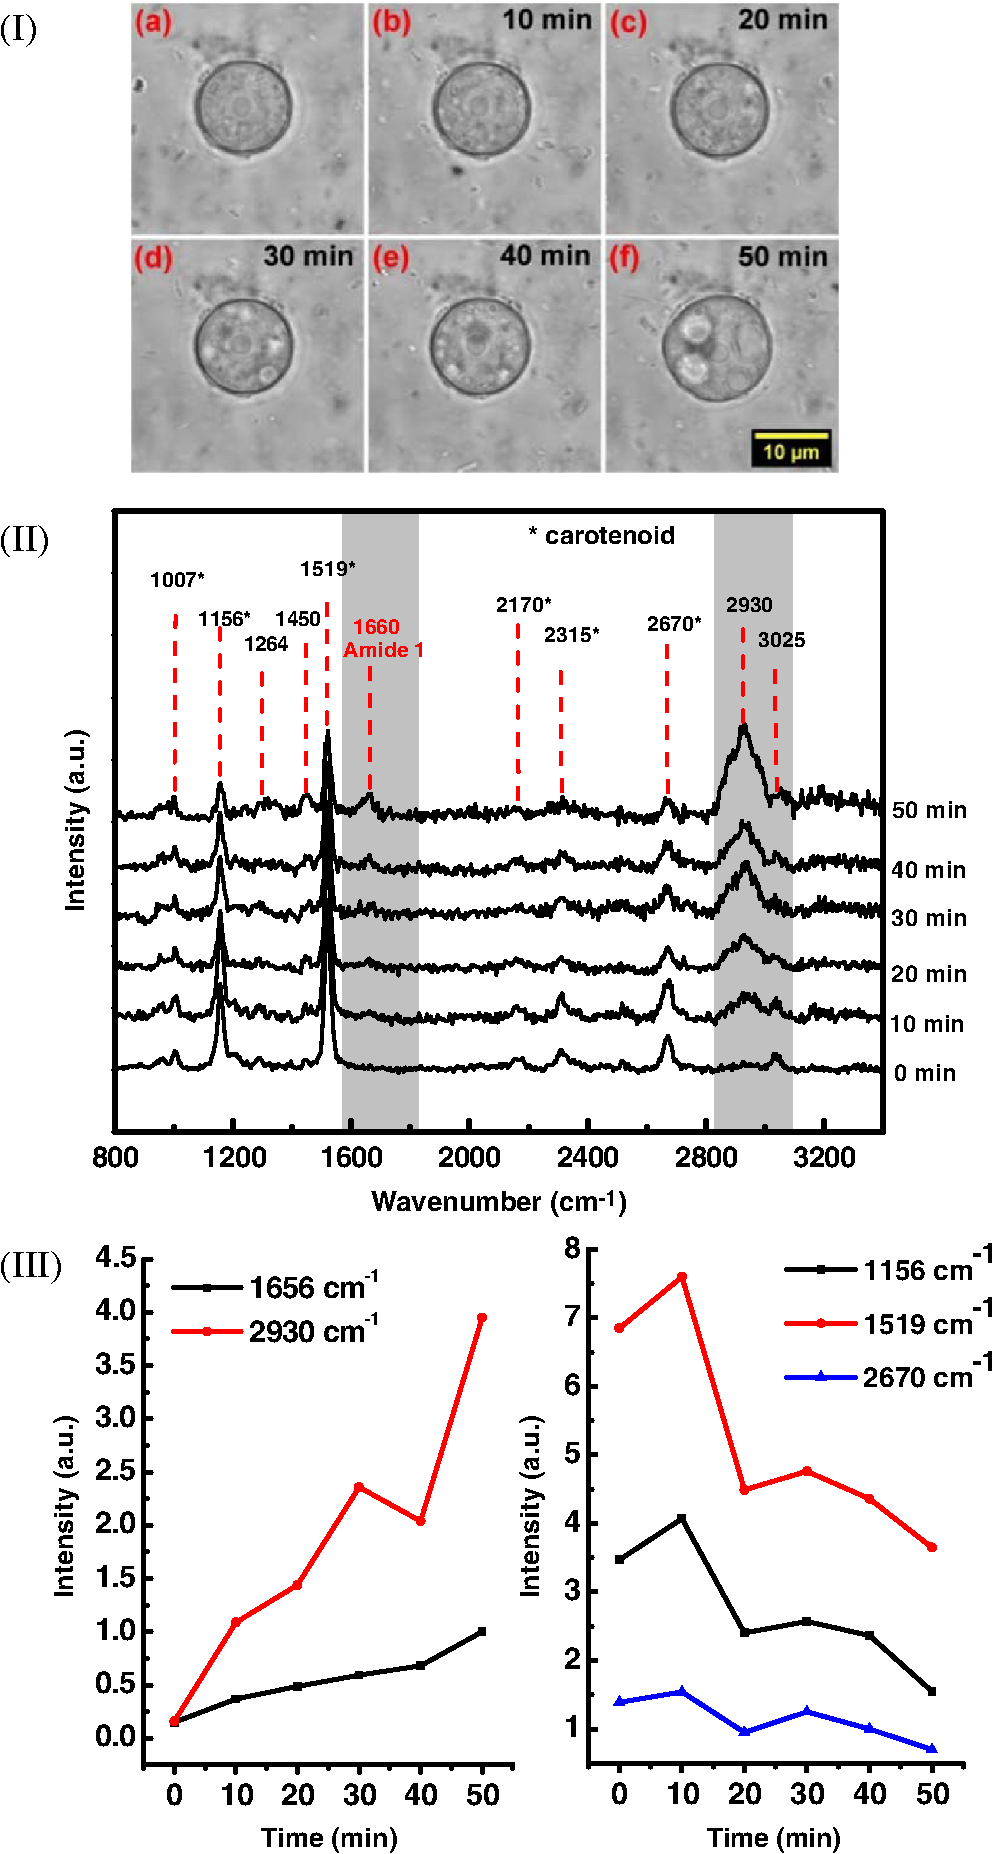 We try to observe the relocation of these substances and chemical changes using Raman spectroscopy. The laser beam was focused in the center of the cyst and the position was fixed during these measurements. The Raman spectra, corresponding to each stage in Fig. 2(I), are displayed in Fig. 2(II). The spectral bands were assigned according to the literature;19,20,22–24 characteristic Raman bands for living cells were observed. The band near is the Amide I band from the of the -helix secondary structure of protein, with possible input of the stretch vibrations of phospholipid. The band near corresponding to bending modes can also come from both protein and lipid. The band at is assigned to symmetric and asymmetric stretch vibrations of the lipid components. The band at as well as the peak at are for stretches from lipids and alkyls.22,25 The lipids’ bands provide signals from the membranes and vesicles organelles which form part of the endosomal system. The changes of relative intensities of these bands are observed and can reflect metabolic activation, as the endosomal system is a mediator in membrane transport processes.20,23 Intense Raman bands at , , , , , and are observed in the cyst, but decrease at cyst activation. The band at is usually attributed to phenylalanine ring breath for most living cells,15 but in amoeba, it is also accompanied by 1156 and bands. These three bands together indicate the presence of carotenoids, characteristic of skeletal , , vibrations.26–28 Weaker peaks an 2017, 2315, and can also be attributed to carotenoids.24 Carotenoids form a large group of isoprenoid pigments. They are synthesized by all photosynthetic organisms and many nonphotosynthetic bacteria and fungi.14,29 Carotenoids exhibit an intense and well-developed Raman spectrum. The excitation by a 488-nm wavelength laser provides resonant enhancement of the carotenoid Raman signals;30 thus, we observed the predominance of carotenoid peaks over proteins’ and lipids’ bands. It has been shown that the Raman signal of carotenoid can be used as a marker, and a method for identifying microorganisms by Raman spectroscopy has been proposed.31 There have been neither studies about carotenoids in amoeba nor amoeba’s Raman studies previously reported. However, the above listed bands can be well-assigned to carotenoid components. There has been increasing evidence showing the beneficial effects of carotenoid antioxidants in the human body.30 Carotenoids in biological systems have important functions based on their ability to absorb light and prevent oxidation both in carotenogenic microorganisms and plants and in organisms that are not carotenogenic themselves but obtain carotenoids from food or medicines. Hundreds of carotenoids have been identified, studied, and used. In this study, we find this signal has a strong correlation with the life cycle of the amoeba. Thus, the observed variation on carotenoids in amoeba provides some information of the life cycle of amoeba with the carotenoid.30–32 Figure 2(III) shows changes of the characteristic band intensities in the process of the cyst activation. From Figs. 2(II) and 2(III), one can see that Amide I Raman band is well detected at the activated cyst stage. It suggests that protein and RNA content increase during excystation.5 Simultaneously, a broad band centered at assigned to aliphatic groups (CH vibrations in , groups, mostly belonging to lipids) increases significantly, while the intensities of the bands of carotenoid components decrease. If we take a ratio of the 1519 to 2930 and then the 1156 to 2930 bands, we can show that the carotenoid decreases while the lipids increase with activation of the cyst (data not shown). Raman spectra from the cystine activated stage (a) and from the cyst envelope after excystation (b) are compared in Fig. 3. In contrast to the image of a mature cyst [Fig. 4(a)], the trophozoite body inside the cyst envelope can be observed after cyst activation [Fig. 4(b)]. In the spectrum measured from a cyst in an activated state, both carotenoid’s Raman bands and characteristic bands for most living cells are presented, such as the Amide I and lipids. The optical image of the cyst envelope after excystation is shown in Fig. 4(d). For the cyst envelope, the intensity of the Raman signal measured at the same conditions as the spectrum before excystation significantly decreases; only bands corresponding to carotenoid components remain observable. Fig. 3Raman spectra of activated cysts and cysts’ envelopes. The spectra, not normalized, are measured under the same conditions focusing on the center of the cyst or envelope. After the amoeba’s excystation, the cyst’s envelope’s spectrum only reveals () and () signals, corresponding to the components from carotenoid.  Fig. 4Optical images of (a) mature cyst; (b) activated cyst with trophozoite inside; (c) amoeba trophozoite; and (d) empty cell wall (cyst envelope) after excystation. (b) and (d) correspond to spectra (a) and (b) of Fig. 3.  The laser power in the measurements (in the focal spot) was to avoid heating and photo-damage of the amoeba. The safety limit of light exposure becomes important in the study of living cells. The safety limits differ for various objects and strongly depend on experimental conditions, i.e., the lasers.33 In addition to safety, the tasks of laser destruction or inactivation of biological objects, such as pathogenic microorganisms,34 cancer cells,35 etc., have been discussed. In this work, we demonstrate the laser treatment’s ability to inactivate the amoeba and to prevent its transformation to the active form. The cyst was irradiated with a CW laser of 488-nm wavelength and a relatively high power of 4 mW on focal spot for 45 min. The Raman spectra measured sequentially during the 45 min of continuous irradiation of the single cyst are shown in Fig. 5(a). We observed a decrease of the absolute intensity of the spectral bands with this treatment. In the first measurement, only carotenoids and probably phenylalanine (which we cannot separate from carotenoid’s peak) peaks are observed. After 5 to 10 min of exposure, a decrease in the bands of the carotenoids with an increasing exposure time was observed. The dependence of intensity on exposure time is shown in Fig. 5(b). For cyst after irradiation, no activation and corresponding chemical changes can be observed, particularly, the proteins signal is not increasing. Therefore, no transformation and excystation happened. Thus, the cyst is significantly damaged or killed by the laser irradiation without significant visible changes in the cyst morphology. Fig. 5Laser power effect on the cysts: (a) spectra measured with high laser power (4 mW) exposure for 45 min from the same cysts; spectra are not normalized; the focus point position and the exposure and measurement conditions did not change. (b) Dependence of the carotenoid’s Raman peaks intensity on laser exposure time.  To obtain and analyze the information about the space distribution of chemical components, Raman mapping is performed. In Fig. 6, an optical [Fig. 6(I)] image of cyst is compared to Raman mapping [Figs. 6(II) and 6(III)]. For these measurements, the medium with cysts was dropped and dried on an Si substrate. In Fig. 6(II), the spatial distribution of the Raman signal intensity from the cyst at [Fig. 6(II-a)], carotenoid, and [Fig. 6(II-b)], mostly from in lipids, are presented. Corresponding three-dimensional Raman mapping is presented in Fig. 6(III). The predominant localization of the carotenoids in the amoeba cyst in the peripheral area adjacent to the cell wall, as well as the distribution of some lipid species, is observed. The enhanced cytoplasmic motion in the activated cyst between the cell’s center and the layer of lipid granules near the plasma membrane has been reported.21 The observed carotenoids in the cell periphery suggest their colocalization with the lipid granules, i.e., their involvement in cyst activation processes. Fig. 6Raman mapping of mature cysts: (I) optical image; (II) the mapping of the intensity of bands (a) at (the signal is locked at 1510 to ) and (b) at (the signal is locked at 3000 to ); (III) three-dimensional mapping of the same peak intensities: (a) and (b) . 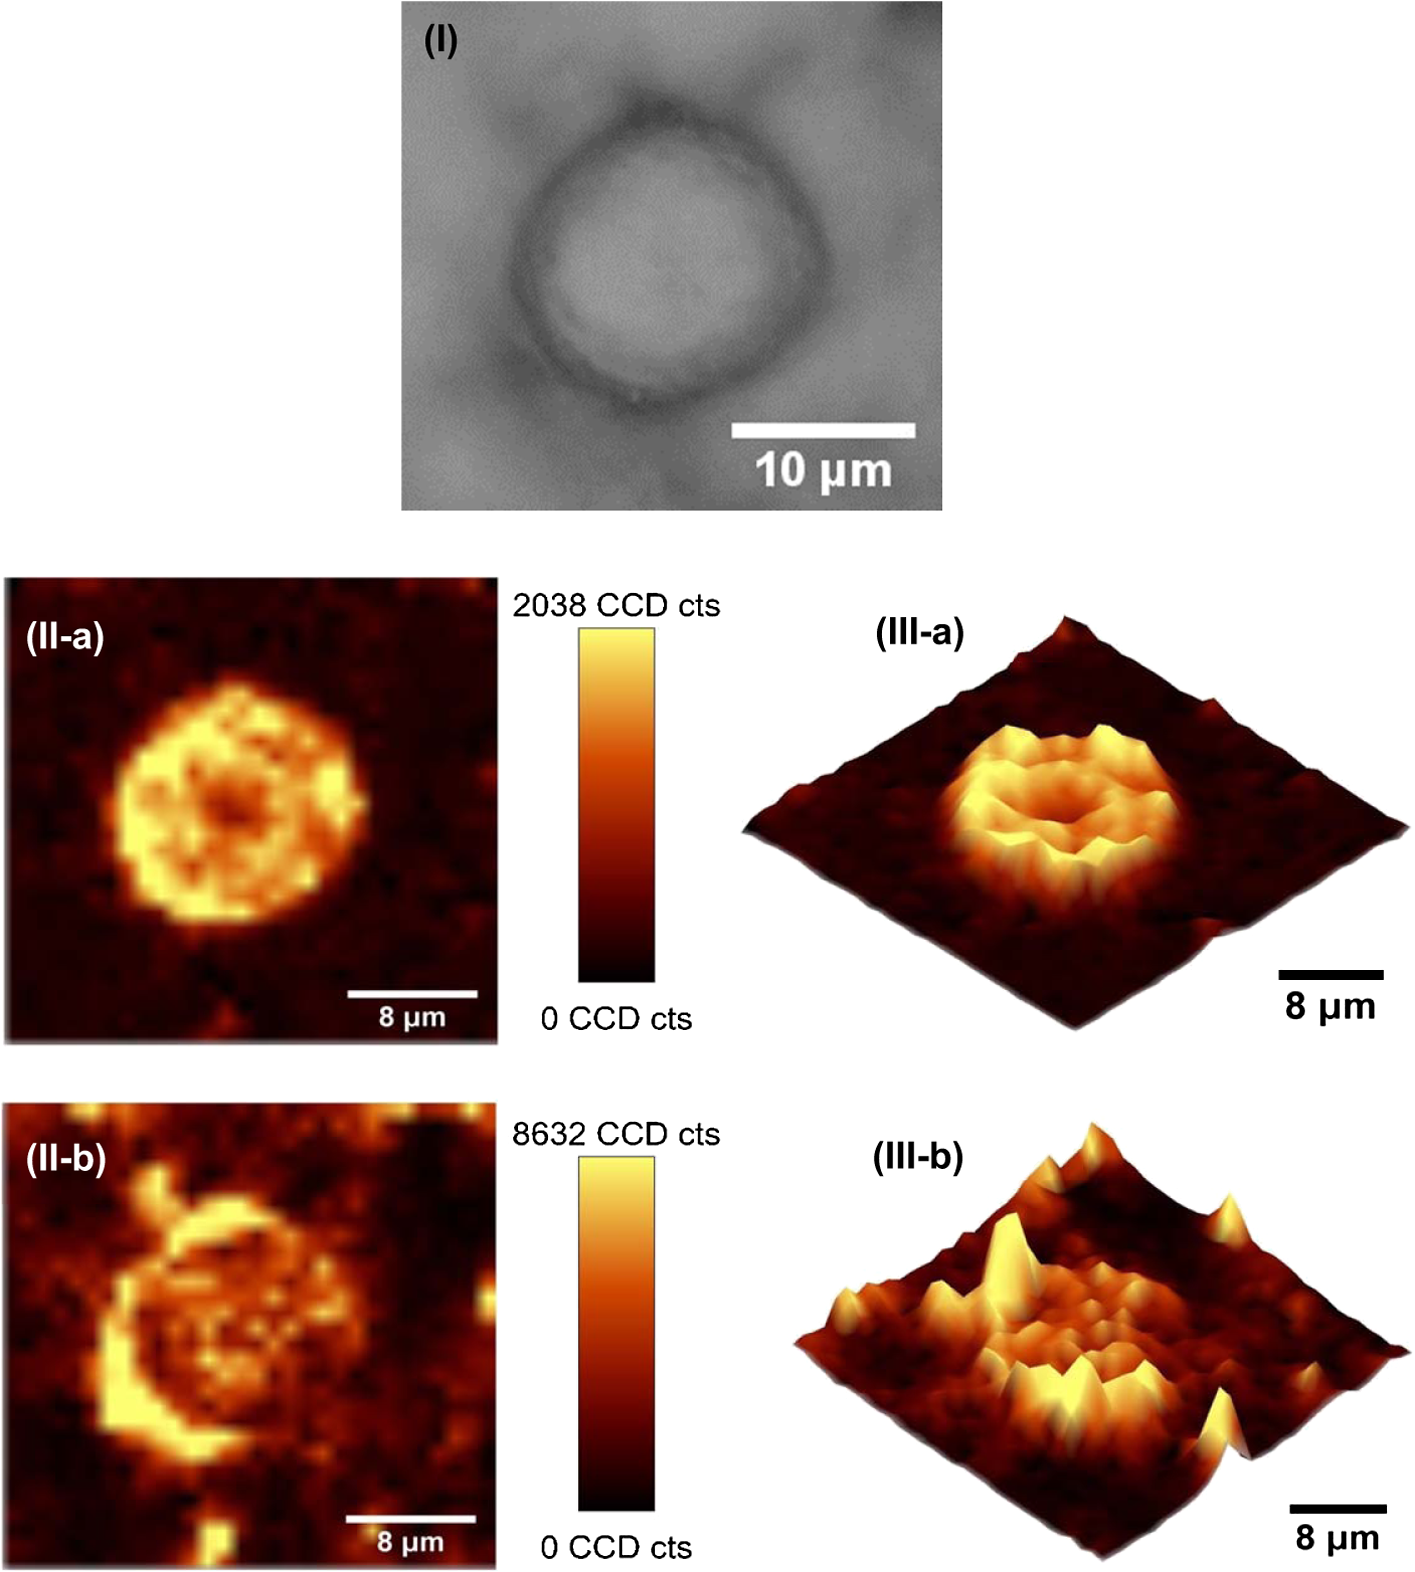 Raman spectroscopy has recently been applied for detection of microorganisms in biological and environmental samples. For this, carotenoid signals can serve both for the detection of the microorganisms (bacteria, fungi, microalgae, etc.) and for their discrimination.14,25,31 Our results demonstrate the ability of Raman spectroscopy, and particularly, Raman mapping, for practical applications; it is possible to detect and identify amoeba's presence using carotenoid bands for imaging. The discrimination of its different stages in its life cycle can be important for the estimation of epidemiological situation and for diagnostics and prognosis of amoebic inflammation. 4.ConclusionIn this report, a Raman spectroscopic study on a single amoeba has been performed. Raman spectra of the amoeba were measured and the spectral transformation corresponding to chemical changes during the amoeba cyst activation and excystation were observed. The Raman characteristic bands evidenced the carotenoid presence in the amoeba. The location of the carotenoid suggests their important roles in the amoeba excystation. Our results demonstrate the possibility for developing Raman applications for amoeba detection in environmental and biological mediums based on carotenoid signals, for identification of the stages of the amoeba life cycle and for the monitoring of the corresponding chemical and structural changes. Additionally, the effect of laser irradiation on the amoeba (in a cyst stage) viability is analyzed in an effort to develop methods for amoeba inactivation. AcknowledgmentsThe authors would like to thank Ministry of Science and Technology of Taiwan for financial support by Grant No. NSC-102-2120-M-259-001. ReferencesF. L. Schuster and G. S. Visvesvara,
“Amebae and ciliated protozoa as causal agents of waterborne zoonotic disease,”
Vet. Parasitol., 126
(1–2), 91
–120
(2004). http://dx.doi.org/10.1016/j.vetpar.2004.09.019 VPARDI 0304-4017 Google Scholar
F. L. Schuster and G. S. Visvesvara,
“Free-living amoebae as opportunistic and non-opportunistic pathogens of humans and animals,”
Int. J. Parasitol., 34
(9), 1001
–1027
(2004). http://dx.doi.org/10.1016/j.ijpara.2004.06.004 IJPYBT 0020-7519 Google Scholar
R. Sriram et al.,
“Survival of Acanthamoeba cysts after desiccation for more than 20 years,”
J. Clin. Microbiol., 46
(12), 4045
–4048
(2008). http://dx.doi.org/10.1128/JCM.01903-08 JCMIDW 1070-633X Google Scholar
Y. Bando et al.,
“Autopsy case of amebic granulomatous meningoencephalitis caused by Balamuthiamandrillaris in Japan,”
Pathol. Int., 62
(6), 418
–423
(2012). http://dx.doi.org/10.1111/pin.2012.62.issue-6 PITEES 1440-1827 Google Scholar
C. R. Murti and O. P. Shukla,
“Differentiation of pathogenic amoebae: encystation and excystation of Acanthamoeba culbertsoni: a model,”
J. Biosci., 6
(4), 475
–489
(1984). http://dx.doi.org/10.1007/BF02703900 JOBSDN 0250-5991 Google Scholar
A. Aksozek et al.,
“Resistance of Acanthamoeba castellanii cysts to physical, chemical, and radiological conditions,”
J. Parasitol., 88
(3), 621
–623
(2002). http://dx.doi.org/10.1645/0022-3395(2002)088[0621:ROACCT]2.0.CO;2 JOPAA2 0022-3395 Google Scholar
M. Herrera-Martínez et al.,
“Actin, RhoA, and Rab11 participation during encystment in entamoeba invadens,”
BioMed. Res. Int., 2013 919345
(2013). http://dx.doi.org/10.1155/2013/919345 BRIIDT 2314-6141 Google Scholar
E. Fouque et al.,
“Cellular, biochemical, and molecular changes during encystment of free-living amoebae,”
Eukaryot. Cell, 11
(4), 382
–387
(2012). http://dx.doi.org/10.1128/EC.05301-11 ECUEA2 1535-9778 Google Scholar
D. I. Ellis et al.,
“Illuminating disease and enlightening biomedicine: Raman spectroscopy as a diagnostic tool,”
Analyst, 138
(14), 3871
–3884
(2013). http://dx.doi.org/10.1039/c3an00698k ANLYAG 0365-4885 Google Scholar
E. Brauchle and K. Schenke-Layland,
“Raman spectroscopy in biomedicine: non-invasive in vitro analysis of cells and extracellular matrix components in tissues,”
Biotechnol. J., 8
(3), 288
–297
(2013). http://dx.doi.org/10.1002/biot.201200163 BJIOAM 1860-6768 Google Scholar
L. D. Chiu and H. Hamaguchi,
“The ‘Raman spectroscopic signature of life’ is closely related to haem function in budding yeasts,”
J. Biophoton., 4
(1–2), 30
–33
(2011). http://dx.doi.org/10.1002/jbio.201000029 JBOIBX 1864-063X Google Scholar
Y. C. Lin et al.,
“The influence of nanodiamond on the oxygenation states and micro rheological properties of human red blood cells in vitro,”
J. Biomed. Opt., 17
(10), 101512
(2012). http://dx.doi.org/10.1117/1.JBO.17.10.101512 JBOPFO 1083-3668 Google Scholar
S. Haider et al.,
“Raman microspectroscopy reveals long-term extracellular activity of chlamydia,”
Mol. Microbiol., 77
(3), 687
–700
(2010). http://dx.doi.org/10.1111/mmi.2010.77.issue-3 MOMIEE 0950-382X Google Scholar
K. Maquelin et al.,
“Raman spectroscopic typing reveals the presence of carotenoids in Mycoplasma pneumonia,”
Microbiology, 155
(6), 2068
–2077
(2009). http://dx.doi.org/10.1099/mic.0.026724-0 MIBLAO 0026-2617 Google Scholar
T. Weeks and T. Huser,
“Raman spectroscopy of living cells,”
Biomedical Applications of Biophysics, 185
–210 Humana Press, New York
(2010). Google Scholar
C.-Y. Cheng et al.,
“Direct and in vitro observation of growth hormone receptor molecules in A549 human lung epithelial cells by nanodiamond labeling,”
Appl. Phys. Lett., 90
(16), 163903
(2007). http://dx.doi.org/10.1063/1.2727557 APPLAB 0003-6951 Google Scholar
C. Matthäusetal,
“Noninvasive imaging of intracellular lipid metabolism in macrophages by Raman microscopy in combination with stable isotopic labeling,”
Anal. Chem., 84
(20), 8549
–8556
(2012). http://dx.doi.org/10.1021/ac3012347 ANCHAM 0003-2700 Google Scholar
C. Krafft et al.,
“Advances in optical biopsy: correlation of malignancy and cell density of primary brain tumors using Raman microspectroscopic imaging,”
Analyst, 137
(23), 5533
–5537
(2012). http://dx.doi.org/10.1039/c2an36083g ANLYAG 0365-4885 Google Scholar
M. Ando and H. Hamaguchi,
“Molecular component distribution imaging of living cells by multivariate curve resolution analysis of space-resolved Raman spectra,”
J. Biomed. Opt., 19
(1), 011016
(2014). http://dx.doi.org/10.1117/1.JBO.19.1.011016 JBOPFO 1083-3668 Google Scholar
A. F. Palonpon, M. Sodeoka and K. Fujita,
“Molecular imaging of live cells by Raman microscopy,”
Curr. Opin. Chem. Biol., 17
(4), 708
–715
(2013). http://dx.doi.org/10.1016/j.cbpa.2013.05.021 COCBF4 1367-5931 Google Scholar
F. E. Mattar and T. J. Byers,
“Morphological changes and the requirements for macromolecule synthesis during excystment of Acanthamoeba culbertsoni,”
J. Cell Biol., 49
(2), 507
–519
(1971). http://dx.doi.org/10.1083/jcb.49.2.507 JCLBA3 0021-9525 Google Scholar
H. Wu et al.,
“In vivo lipidomics using single-cell Raman spectroscopy,”
Proc. Natl. Acad. Sci. U S A, 108
(9), 3809
–3814
(2011). http://dx.doi.org/10.1073/pnas.1009043108 PNASA6 0027-8424 Google Scholar
N. Uzunbajakava et al.,
“Nonresonant confocal Raman imaging of DNA and protein distribution in apoptotic cells,”
Biophys. J., 84
(6), 3968
–3981
(2003). http://dx.doi.org/10.1016/S0006-3495(03)75124-8 BIOJAU 0006-3495 Google Scholar
X. N. He et al.,
“Coherent anti-Stokes Raman scattering and spontaneous Raman spectroscopy and microscopy of microalgae with nitrogen depletion,”
Biomed. Opt. Express, 3
(11), 2896
–2906
(2012). http://dx.doi.org/10.1364/BOE.3.002896 BOEICL 2156-7085 Google Scholar
T. Wang et al.,
“Quantitative dynamics of triacylglycerol accumulation in microalgae populations at single-cell resolution revealed by Raman microspectroscopy,”
Biotechnol. Biofuels, 7
(1), 58
(2014). http://dx.doi.org/10.1186/1754-6834-7-58 BBIIFL 1754-6834 Google Scholar
R. Withnall et al.,
“Raman spectra of carotenoids in natural products,”
Spectrochim. Acta A, 59
(10), 2207
–2212
(2003). http://dx.doi.org/10.1016/S1386-1425(03)00064-7 1386-1425 Google Scholar
M. Macernis et al.,
“Resonance Raman spectra and electronic transitions in carotenoids: a density functional theory study,”
J. Phys. Chem. A, 118
(10), 1817
–1825
(2014). http://dx.doi.org/10.1021/jp406449c JPCAFH 1089-5639 Google Scholar
H. Schulz, M. Baranska and R. Baranski,
“Potential of NIR-FT-Raman spectroscopy in natural carotenoid analysis,”
Biopolymers, 77
(4), 212
–221
(2005). http://dx.doi.org/10.1002/(ISSN)1097-0282 BIPMAA 0006-3525 Google Scholar
N. Misava et al.,
“Structure and functional analysis of a marine bacterial carotenoid biosynthesis gene cluster and astaxanthin biosynthetic pathway proposed at the gene level,”
J. Bacteriol., 177
(22), 6575
–6584
(1995). JOBAAY 0021-9193 Google Scholar
I. V. Ermakov et al.,
“Resonance Raman detection of carotenoid antioxidants in living human tissue,”
J. Biomed. Opt., 10
(6), 064028
(2005). http://dx.doi.org/10.1117/1.2139974 JBOPFO 1083-3668 Google Scholar
P. Roesch et al.,
“The identification of microorganisms by micro-Raman spectroscopy,”
J. Mol. Struct., 661–662 363
–369
(2003). http://dx.doi.org/10.1016/j.molstruc.2003.06.004 JMOSB4 0022-2860 Google Scholar
F. Delgado-Vargas, A. R. Jiménez and O. Paredes-López,
“Natural pigments: carotenoids, anthocyanins, and betalains: characteristics, biosynthesis, processing, and stability,”
Crit. Rev. Food Sci. Nutr., 40
(3), 173
–289
(2000). http://dx.doi.org/10.1080/10408690091189257 CRFND6 0099-0248 Google Scholar
K. T. Tsen et al.,
“Selective inactivation of micro-organisms with near-infrared femtosecond laser pulses,”
J. Phys.: Condens. Matter, 19
(47), 472201
(2007). http://dx.doi.org/10.1088/0953-8984/19/47/472201 JCOMEL 0953-8984 Google Scholar
T. Imamura et al.,
“Antibacterial and antifungal effect of 405 nm monochromatic laser on endodontopathogenic microorganisms,”
Int. J. Photoenergy, 2014 387215
(2014). http://dx.doi.org/10.1155/2014/387215 IJPNBU 1687-529X Google Scholar
D. Lapotko et al.,
“Method of laser activated nano-thermolysis for elimination of tumor cells,”
Cancer Lett., 239
(1), 36
–45
(2006). http://dx.doi.org/10.1016/j.canlet.2005.07.031 CALEDQ 0304-3835 Google Scholar
BiographyYu-Chung Lin received his BSc degree from the Department of Biomechatronic Engineering, National Chiayi University, Taiwan, in 2009. He graduated from the National Dong Hwa University with a master’s degree in physics in 2011. He is currently a PhD student in the Department of Physics, National Dong Hwa University, Taiwan. His research is in the field of Raman spectroscopy, fluorescence spectroscopy, and laser optical tweezers applications in life science. Elena Perevedentseva received her PhD degree in physics from Moscow State University, Moscow, Russia. She has been working at the National Dong Hwa University, Taiwan, for 10 years. Her research is focused on microscopic and spectroscopic studies of nanoparticle interaction with biological objects. She is also a senior researcher at the P. N. Lebedev Physics Institute of the Russian Academy of Sciences, Moscow, Russia, working in the field of optics and spectroscopy. Chia-Liang Cheng is a spectroscopic scientist by training, specializing in Raman and infrared spectroscopy. He is now professor of physics at the Department of Physics, National Dong Hwa University in Taiwan. He received his PhD degree from the Department of Physics, University of Oregon, USA (1993). He did his postdoctoral research at University of California, Berkeley, and at the Institute of Atomic and Molecular Sciences, Academia Sinica, Taiwan (1994-1997). His interest is in carbon nanostructural materials, especially nanodiamond, and their biomedical applications. |


