|
|
1.IntroductionIn vivo optical spectroscopy is a noninvasive method of investigating endogenous fluorophores and tissue biomarkers and is, therefore, a potentially powerful tool for tissue diagnostics. For example, fluorescence spectroscopy of skin autofluorescence has proven to be sensitive to many advanced glycation end products including glucuronic acid, 3-indoxyl sulfate, 3-hydroxybutyrate, phenol sulfate, and pentosidine.1 The absolute extraction of intrinsic fluorescent signals is, however, difficult. Spectroscopy of fluorophores in vivo is strongly influenced by the optical properties of the tissue being measured. As a result, quantitative fluorescence spectroscopy requires a means of quantifying the scattering and absorption properties of the tissue and a method of correcting the raw fluorescence signal to recover the intrinsic autofluorescence. In the past, various methods have been used to extract intrinsic fluorescence spectra. These methods, however, suffer from differences in interrogation geometry between optical properties and fluorescence and differences in sample volume between the measured reflectance and fluorescence. To overcome these obstacles, our group has developed an approach in which multidiameter single-fiber reflectance (MDSFR) and single-fiber fluorescence (SFF) spectroscopy are combined to measure the tissue optical properties and recover the intrinsic fluorescence. These techniques are based on experimentally validated Monte Carlo simulations.2–4 This setup uses a single fiber which is used for both delivery of light to the tissue as well as collection of the reflected light. This enables the use of a relatively small, compact probe in which the optically sampled volume is shallow, on the order of the fiber diameter.5 Recently, our group has shown that by acquiring multiple SFR spectra with varying fiber diameters, MDSFR can be used to simultaneously quantify the absorption coefficient (), the reduced scattering coefficient (), and the phase function parameter .6–8 These properties describe both tissue chromophores as well as scattering properties. Quantification of these properties may be diagnostically valuable, since recently it has been shown that changes in could be directly correlated to changes in the tissue ultrastructure.4,9 The extraction of these optical properties allows the SFF system to measure corrected values for the effective intrinsic tissue fluorescence, which is the product of the quantum yield of the fluorophore (Q) and the fluorophore absorption coefficient (). Since intrinsic fluorescence estimated by the MDSFR/SFF system can now be corrected for the optical properties, it can be used for comparison between people, locations, between normal tissue and (pre)cancerous tissue, and to measure the effect of treatment over time. Currently, the MDSFR/SFF system is used in a population-based cohort study. Within this study, the device will be used by multiple users. The device will be used to quantify tissue fluorescence, scattering, and absorption properties. Since this study will run over many years and the device will be used by multiple users, the measured optical properties must be consistent between users. 2.Materials and Methods2.1.MDSFR/SFF DeviceFor the study, an MDSFR/SFF device was used. This setup has been described in detail elsewhere.10 Figure 1 shows a schematic of the system. In summary, the system consists of a 19-core coherent fiber bundle wherein each individual fiber is trifurcated at the proximal end to allow selective illumination and detection from the center fiber, the middle ring of six fibers, and the outer ring of 12 fibers, respectively. Via this trifurcation, every fiber is connected to a fiber delivering light from a halogen source (HL-2000-FHSA, Ocean Optics, The Netherlands), a fiber delivering light from a 405-nm LED and a fiber collecting light returning from the specimen and delivering it back to the spectrometer. The fiber diameter is independently regulated by three computer-controlled shutters, with effective diameters of 0.20, 0.60, and 1.08 mm. All measurements of the different fiber diameters are performed consecutively in a single measurement without lifting the probe. Detection was realized by three spectrometers (two S2000s, one USB2000+, Ocean Optics, The Netherlands) with an overlapping spectral range of 350 to 1000 nm and a long-pass filter with a 385-nm cut-off wavelength (GL-385-12, Avantes, The Netherlands) to remove fluorescence excitation light. For the fluorescence measurements, only the largest effective fiber diameter was used. The probe tip was polished at a 15-deg angle to reduce back reflections. Calibration of the system comprises integrating sphere calibration, reference optical phantom calibration, and calibrated lamp calibration. Details on this can be found elsewhere.10 This procedure takes roughly 3 min to perform and was done prior to every day the system was used. The coordination of illumination and detection, as well as the calibration and recording of the measurements, was performed by a laptop PC with a custom made LabView code. Fig. 1Schematic representation of the multidiameter single-fiber reflectance and fluorescence system. Numbers represent individual fibers. Both reflectance and fluorescence spectroscopy are measured in one single measurement. For reflectance spectroscopy, three fiber diameters are used. Panel (a) shows the fiber, panel (b) shows the fiber, and panel (c) shows the fiber, all connected both to the halogen lamp and spectrometers. Colors correspond to the reflectance spectra in Fig. 2(a). (d) For fluorescence spectroscopy, only the largest fiber diameter, , is used in conjunction with a 405-nm LED and a spectrometer.  2.2.VolunteersFor this study, six subjects were included for measurements with the MDSFR/SFF system (Table 1). The group consisted of a young cluster () and a mature cluster. These latter volunteers were included to measure variability in mature skin and to investigate possible differences with younger skin. Inclusion criterion of these subjects was, therefore, aged . None of the volunteers had any apparent skin disease and measurements were done on healthy looking skin. None of the volunteers reported diabetes mellitus, kidney disease, or smoking, factors that are known to influence skin autofluorescence. Table 1Summary of volunteers.
The research was done under the Dutch Code of Conduct for the Use of Data in Health Research. 2.3.Measurement StrategyThe measurement scheme consisted of four locations, being the ventral side of the left forearm, the dorsal side of the left hand, the left cheek and left ala nasi. Each location was marked with a black ink ring, 3 mm in diameter. Around this ring, four marks were made 3 mm from the ring, at 12, 3, 6, and 9 o’clock, totaling five spots. Five measurements were done within the ring and between the ring and the marks surrounding the ring, totaling 25 measurements per location. Each measurement takes roughly 8 s to perform. Care was taken not to put the probe in contact with the ink ring. Between consecutive measurements, users were instructed to lift the probe from the skin and reposition it on the same spot. This was done to remove any effect of prolonged pressure by the probe on the skin, which could possibly lead to lowering of the oxygen saturation due to compression of the superficial microvasculature and potential changes in scattering properties. Users were asked to aim the consecutive measurements as precisely as possible on the same spot. All measurements of all users on one particular subject were done on the same day to correct for possible changes in ambient conditions. 2.4.Measurement OutcomesBlood and tissue optical properties were determined from the MDSFR spectra. A custom made MATLAB script was used to extract values for blood oxygen saturation (), blood volume fraction (BVF), vessel diameter (VD), average gamma () where and and are the first and second moment of the phase function, respectively, reduced scattering coefficient at 800 nm, and integrated intrinsic fluorescence excited using 405 nm (). A detailed description of the MDSFR analysis have been described previously.8 The script automatically excluded multidiameter spectra where spectra from the different fiber diameters overlapped (minimal wavelength 625 nm), if the maximum residual of reflectance is higher than 10% or if the maximum residual fluorescence is higher than . To assess variability between users, all measurements of one location were pooled to extract group averages. 2.5.Statistical AnalysisUser variability was assessed by grouping measurements of individual users within the particular subset (i.e., volunteer and location). Subsequently, the user average and standard deviation were calculated. For this study, we defined that if the group average was within the standard deviation of the user, that user was within the system’s limit and variability was acceptable. Spots with less than three measurements were excluded from the analysis. A one-way analysis of variance (ANOVA) was used to assess differences in the fitted parameters between users. 2.6.ValidationOptical measurements may be influenced by handling of the probe in two ways. First, the probe might not be properly placed on the surface of the tissue. The probe tip is polished at a 15 deg angle, which requires a slight angle at which the probe is to be placed on the tissue. If this is not the case, or if the probe is lifted during the measurement, room light might enter the fiber, which is detrimental to the correct recovery of reflectance and fluorescence spectra. However, this ambient light is easily recognized in the acquired fluorescence spectrum, and the measurement can immediately be retaken. The second cause of error during measurement, possibly affecting the optical properties, is the pressure at which the probe tip is held against the tissue. For the MDSFR/SFF system, it is preferable to exert as minimal pressure on the probe tip as possible. If the application pressure is too high, this could lead to dimensional and physiological changes in the tissue that would ultimately alter optical properties. If the pressure is too high, BVF will drop as the blood is forced out. Furthermore, will increase if tissue is compressed, since this property describes the density of the particles in the interrogated volume. Ultimately, the of the tissue will also decrease, since cells consume oxygen faster than it gets replenished. Contrary to disturbances in fluorescence due to room light, changes in these oxygen parameters will not be immediately apparent. A careful examination of variability between users is, therefore, required. Another potential source of error is movement of the probe during acquisition of the individual MDSFR spectra and subsequent SFF spectrum. Spectra taken with the different fiber diameters are taken consecutively, and it is possible that the probe moves between spectra. This will affect the recovery of , , and compared to the intrinsic fluorescence. 3.Results3.1.Study PopulationThe current study focused on variability within as well as between different users of the MDSFR and SFF measurements. Five untrained users were asked to perform multiple consecutive MDSFR/SFF measurements on three test subjects. Furthermore, one test user performed measurements on three older volunteers. It is imaginable that the skin’s architecture changes with age, leading to fundamentally different optical properties which may lead to a larger variability between users. By including three older individuals, the effect of this could be investigated. All subjects were measured on the arm and face. Additionally, subjects were also measured on the hand and nose. These locations were added, since (pre-)malignant lesions are often found in these regions. It is important to be aware of any location-specific variability. Table 1 summarizes the characteristics of the volunteers included in this study. The first group of volunteers (A, B, and C) with an average age of 36 years was measured by multiple users. The second group also consisted of three volunteers (D, E, and F), with an average age of 69 years. These were only measured by one user. Median skin type according to the Fitzpatrick scale was 2. Figure 2(a) shows typical MDSFR spectra from the face. All data in Fig. 2 are from the same measurement on patient E. The double dip between 500 and 600 nm, particularly in the largest effective diameter, is a feature of oxyhemoglobin. Figure 2(b) shows a typical curve. The wavelength dependence of , especially below 500 nm, is apparent from the figure. Fig. 2Example of (a) typical single-fiber reflectance and (b) phase function . The red (upper) line represents a spectrum measured with a diameter of , the blue (middle) line represents , and the green (bottom) line represents a diameter of . Error bars denote one standard deviation. (c) Corrected intrinsic fluorescence (d) with the residual. Light gray line represents measurement and black line represents fitted fluorescence. 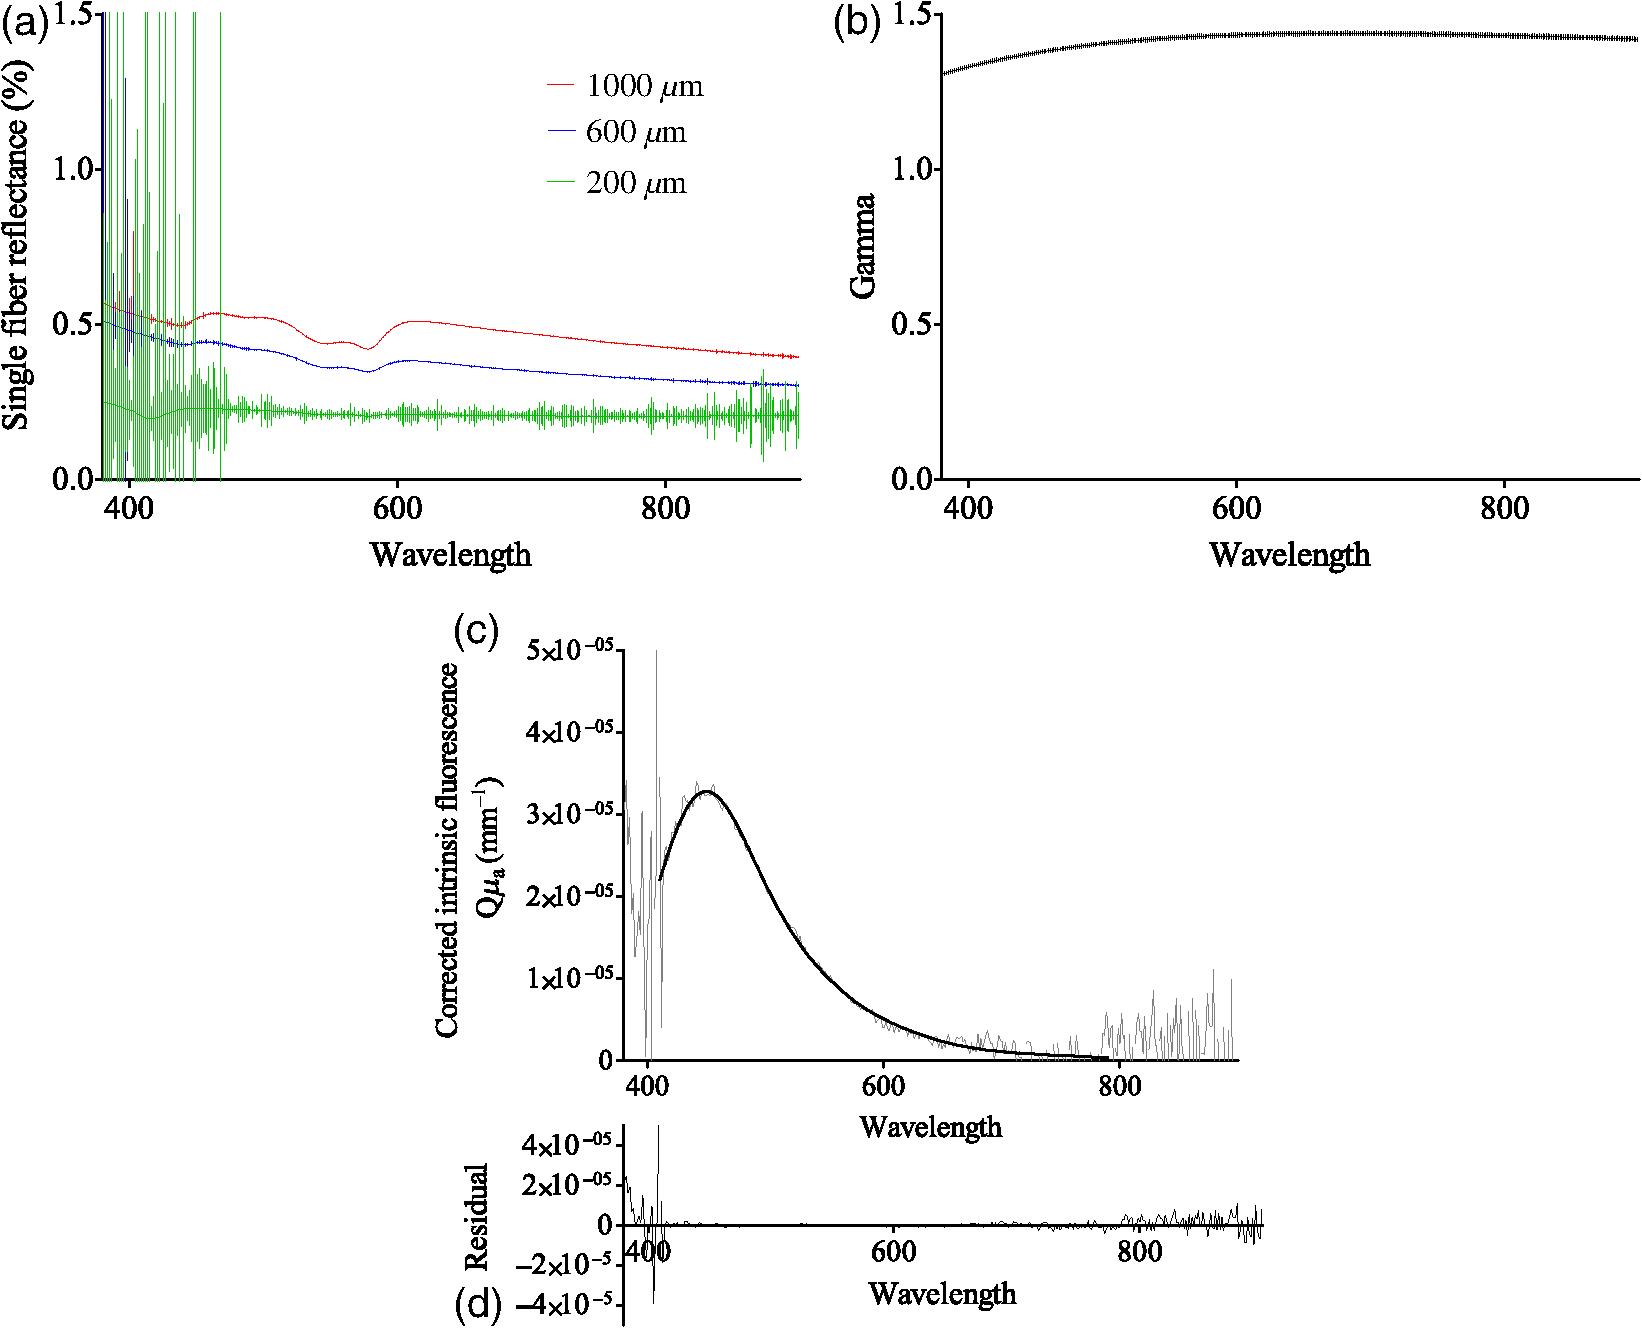 3.2.Variability within UsersAfter exclusion of the spectra that matched the exclusion criteria mentioned above, user variability was assessed in three volunteers (A, B, and C). Figures 3(a)–3(c) show the measured group averages of the blood parameters for each user on all subjects. Figures 3(d)–3(g) show the extracted optical properties of all measurements. For clarity, only the measurements done on the center spot of the arm and on the face at the central spot are shown ( per user). Variability on the hand and nose and the other spots is, however, comparable to the trend seen in the arm and face as shown in the figures. One user had only two valid measurements on volunteer C. This user was excluded from the analysis. Fig. 3Variability of parameters (a) blood oxygen saturation (, %), (b) blood volume fraction (BVF), (c) vessel diameter (VD, mm), (d) average gamma (), (e) reduced scattering coefficient at 800 nm (), and (f) corrected intrinsic autofluorescence () of volunteers A, B, and C, measured by multiple users (one to eight). . Solid lines represent data collected from the arm and dashed lines represent data collected from the face. 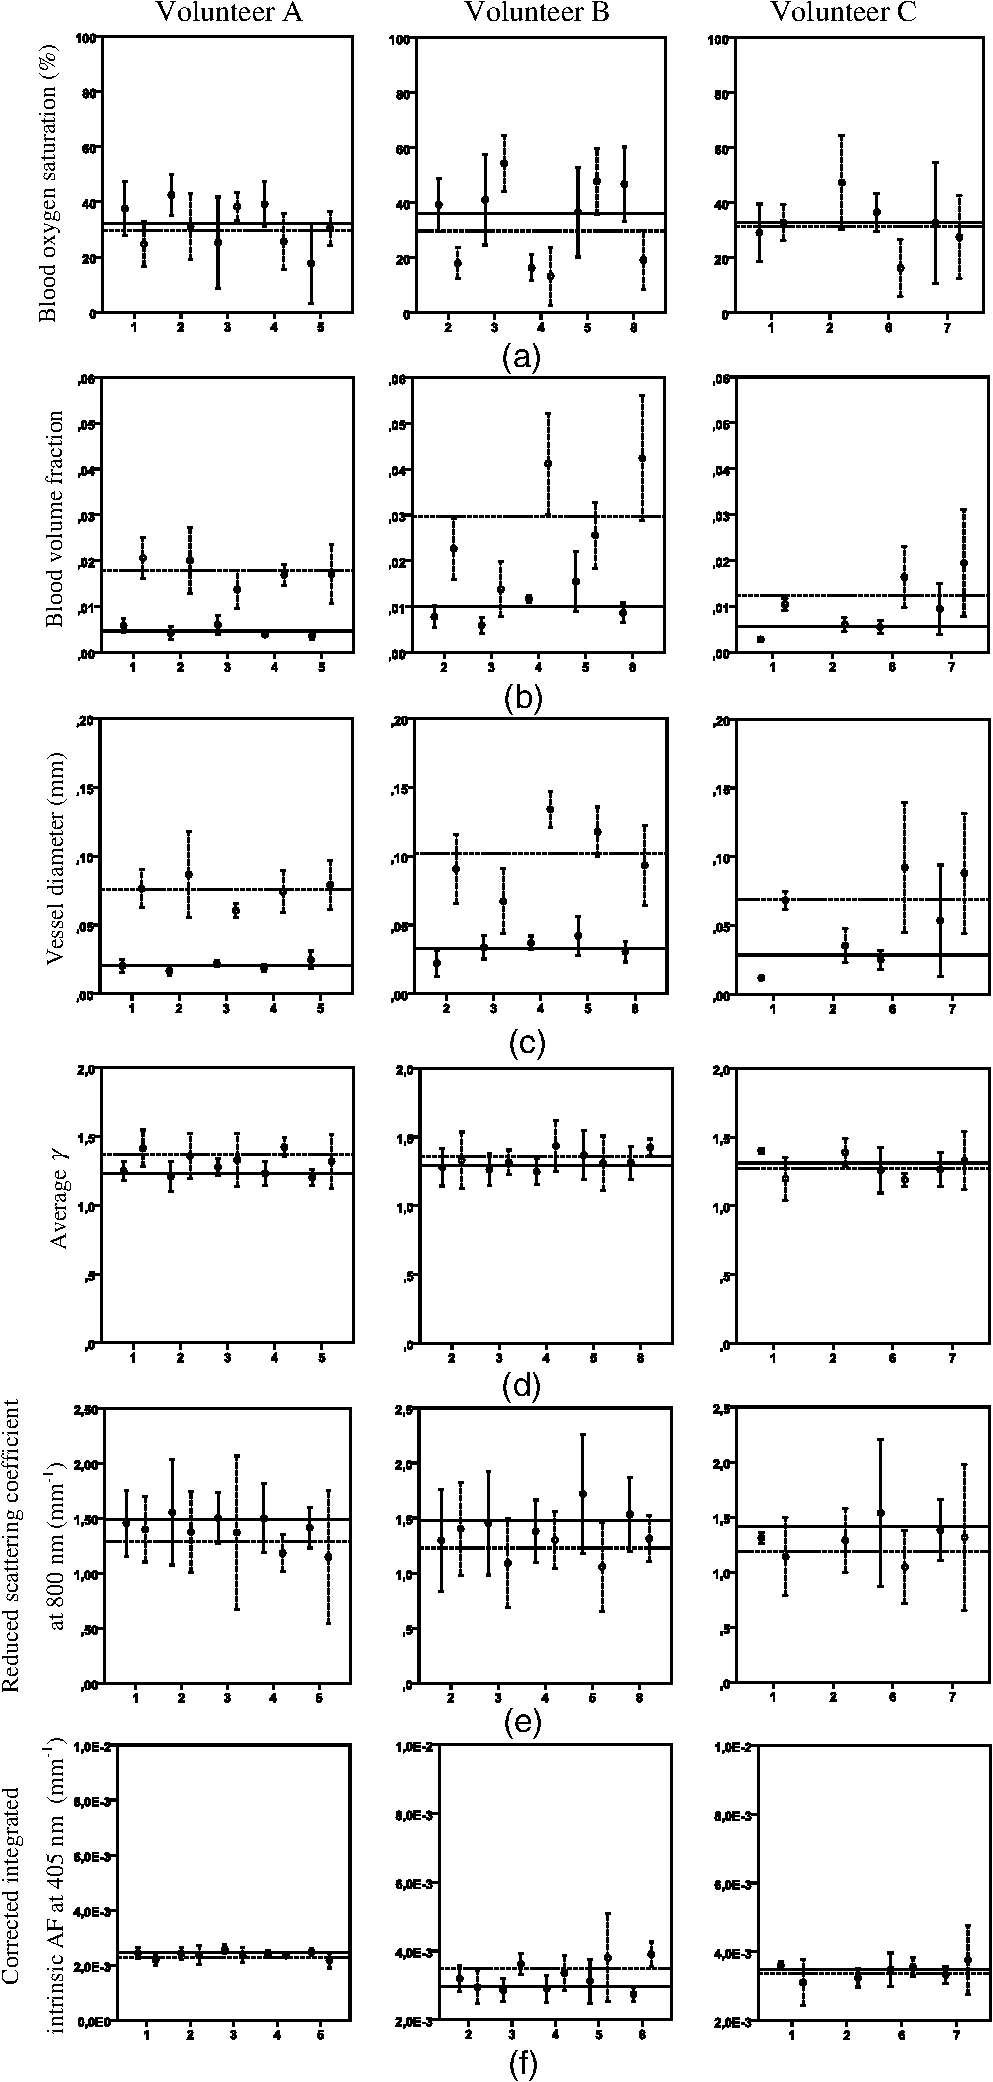 Overall, vascular parameters showed more intrauser variability than the optical properties [Figs. 3(a)–3(c) versus 3(d)–3(f)]. Standard deviations were larger compared to the optical properties. With respect to [Fig. 3(a)], some users tended to display very narrow results, whereas others showed a relatively large variation in saturation. The variability of the BVF was uniform and individual users showed very little variability, especially with respect to measurements on the arm. Users 4 and 5 showed relative higher variability in their measurement on the face of volunteer B [Fig. 3(b), second panel]. Variability of the VD showed a similar trend [Fig. 3(c)], although users 6 and 7 showed far higher variability on the face of volunteer C compared to any other combination of user and volunteer [Figs. 3(c), third panel]. The scattering phase function parameter [Fig. 3(d)] showed less intrauser variability compared to the blood properties. Intrauser variability of (800) was uniform but quite large [Fig. 3(e)]. Variability of the intrinsic autofluorescence excited at 405 nm showed very low variability within users. 3.3.Variability between UsersTo examine variability between users, the spread of the individual users was compared with the measured group mean of the different variables. A maximum deviation of one standard deviation from the group mean was set as the cut-off point. Furthermore, ANOVAs were performed to assess this statistically. Measurements on the different locations were separated. For , most of the measurement on the arm fell within one deviation of the group mean. As described above, some users showed considerable variation compared to others. Measurements on the face showed a similar trend, although for volunteer B, users 3 and 5 measured higher oxygen saturations than users 2, 4, and 8. Indeed, ANOVA showed significant differences on all locations on all volunteers, except for the face of volunteer A and the arm of volunteer C (Table 2, ). BVF shows interuser variability that is overall within one standard deviation of the group mean. Variability is especially small on the arm. ANOVA only showed a nonsignificant difference on the face of volunteer A. Variability of the VD is also primarily within one standard deviation of the group mean. This is true for both the arm and the face of all volunteers. ANOVA confirmed the similarity of measurement on the face of volunteer A and the arm and face of volunteer C (Table 2, ). Table 2One-way analysis of variance (ANOVA) of differences of user variability on different measurement locations and volunteers, where the users comprise the difference groups of the ANOVA. p-values higher than 0.05 were considered nonsignificant.
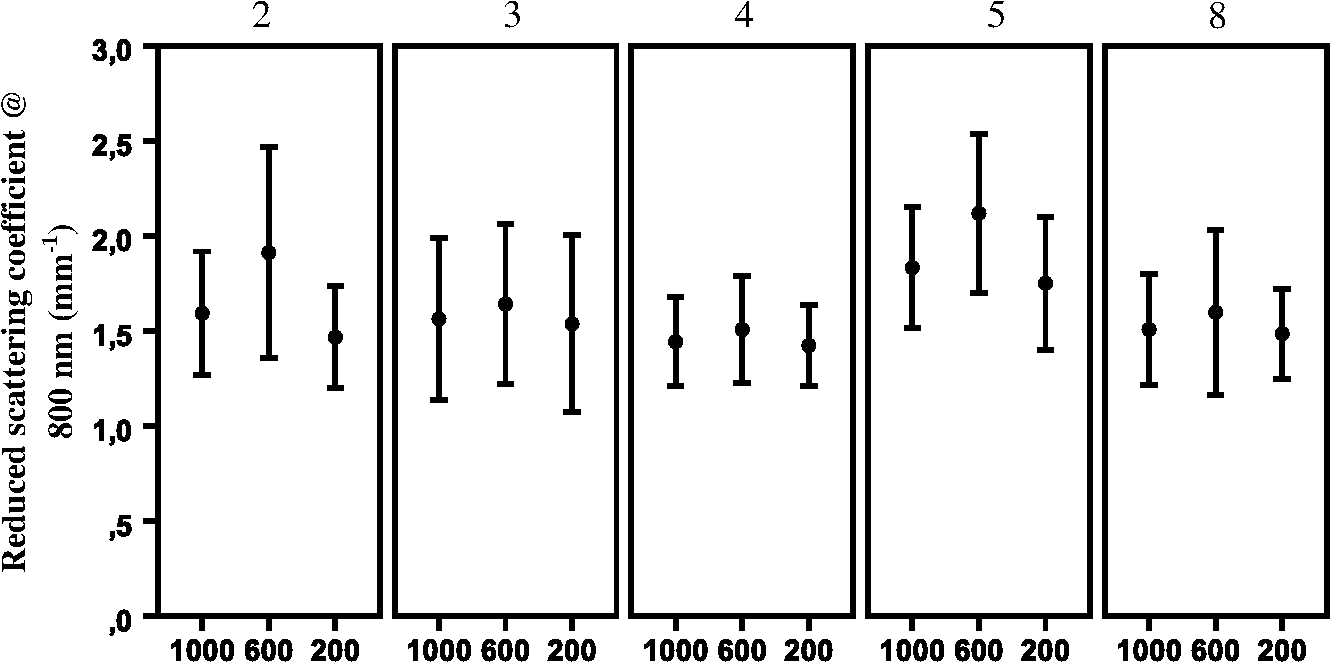
The optical properties , (800), and showed interuser variability that was much more uniform and highly concordant with the respective nonsignificant () ANOVA calculations. For the average gamma (), all users measured values within one standard deviation of the group mean in volunteers A and B on both locations. For volunteer C, user 1 on the arm and user 6 on the face reported standard deviations that did not overlap the group mean. All calculated ANOVA -values are higher than 0.05, suggesting similarity between the users. This was also true for the reduced scattering coefficient at 800 nm. All users reported measurements that were within one standard deviation of the group mean, except measurements of user 1 on the arm of volunteer C. ANOVA results show highly nonsignificant -values for all locations on all volunteers. Finally, for the corrected integrated intrinsic autofluorescence excited at 405 nm, all measurements, on the arm as well as the face, fell within one standard deviation. This translated to -values above 0.05 for all locations on all three volunteers. 3.4.Variability Differences within Different LocationsIt is known that the skin of different parts of the body is structurally different. To investigate if this influenced variability, measurements of the arm and face were compared. No conclusive differences were found concerning [Fig. 3(a)]. No real trend in variability differences between the arm and the face could be discerned. Standard deviations of BVF and VD of the arm were smaller than the face [Figs. 3(b) and 3(c), respectively]. This was true for all user measurements on all volunteers. showed a slightly broader standard deviation on the face compared to the arm [Fig. 3(d)]. This was true for almost all users on all volunteers. For (800), no clear trend can be extracted from the results, although it seemed variability is either comparable between locations or higher in the face [Fig. 3(e)]. did not show any clear differences in variability in the arm or face [Fig. 3(f)]. Some large individual differences were observed, but no overall conclusion could be drawn from these results. 3.5.Variability in Mature SkinTo determine the intrauser variability of vascular and optical properties in older individuals, one user repeated the measurements in a second group of volunteers with mature skin (volunteers D, E, and F). Measurements were only done on one spot on the arm, hand, face, and nose. To be consistent with the first group of younger volunteers, every location was measured five times. Results of the mature skin are shown in Fig. 4. For reference, scales of the graphs are the same as the corresponding previous graphs in Fig. 3. It is clear that the ranges of intraperson variability with respect to in the mature skin were similar compared to that of the young volunteers. Intraperson variability of BVF was also similar in young and mature skin. Overall, VD was comparably variable in mature skin compared to young skin. The VD on the arm of volunteer E is very variable due to two very high data points. Furthermore, volunteers D and F showed less variability on the arm compared to the face, which is in accordance with what was seen in younger volunteers A to C. Fig. 4Variability of parameters (a) (%), (b) BVF, (c) VD, (d) , (e) (800) (reduced scattering coefficient at 800 nm, ) and (f) (corrected intrinsic autofluorescence, ) in mature skin of volunteers D, E, and F, measured by one user.  showed similar intraperson variability in mature skin compared to young skin. Variability of (800) was notably smaller in mature skin. This was true for both the measurements on the arm as well as the face. Last, showed a slighter higher variability in mature skin. 3.6.Variability of Scattering Due to Different Fiber DiametersSince the skin is morphologically subdivided in different layers, all of the layers have their specific cell types and structures. The depth of interrogation of the probe depends on the diameter. The smallest diameter interrogates the shallowest depth, the largest diameter the deepest part. To examine whether the fiber diameter would explain variability in scattering, the reduced scattering at 800 nm was examined for all three fiber diameters. For this analysis, the data of volunteer B were used and separated by fiber diameter (Fig. 5). Shown are the mean value () for (800) for users 2, 3, 4, 5, and 8. Pooled by user, the size of the error bars is roughly equal, except for the (800) measured with the 600-nm diameter by user 2. Mean scattering coefficient shows a trend of being higher when measured with the 600-nm fiber but no trend is seen with regard to the size of the variability of (800). 4.DiscussionFluorescence spectroscopy with the MDSFR/SFF device is a new tool that can be used to quantify the tissue optical properties. These, in turn, can be used to recover the intrinsic autofluorescence of the tissue. This intrinsic fluorescence may prove diagnostically useful, as it has been linked to cardiovascular disease, diabetes, kidney diseases, and aging. Furthermore, MDSFR/SFF might also be valuable in the diagnosis of several common (pre-)malignant skin lesions, such as actinic keratosis, basocellular carcinoma, and squamous cell carcinoma. This study focused on possible sources of variability when using the MDSFR/SFF system. To the best of our knowledge, this is the first study focusing on user variability of a handheld optical device. The system is used by multiple different users and although all users have been given the same instructions, handling of the fiber is likely to be slightly different for each user. We investigated the magnitude of this effect by allowing several untrained users to use the system in a controlled environment and assessed user variability. Because the probe was lifted and repositioned between each measurement and the sample volume is in the order of , the effects of tissue heterogeneity and probe placement cannot be entirely isolated from each other. However, these data can still provide insight into the sources of variability in these measurements. For example, if measurement variability is dominated by tissue heterogeneity, then all users would be expected to measure similar average spectra and extract similar average optical properties. In this case, the inter- and intrauser variation of the measured spectra and the extracted optical properties would be expected to be similar. If, however, the probe placement technique is the dominant source of variability, then it could be reasonably expected that users would measure different mean optical properties. For example, a user that consistently applied higher pressure would be expected to measure a consistently lower BVF and a higher due to pressure from the probe tip compressing the tissue and forcing blood from the measurement volume. Our results show that the mean extracted values for the optical properties are similar and that this variability is well within one standard deviation of the group mean, which supports the conclusion that tissue heterogeneity is the most important source of variability rather than differences in probe placement technique. It was observed that intrauser and interuser variations were of similar magnitude, which suggests either that (1) variation is dominated by spatial heterogeneities in the tissue or that (2) each user introduces some pressure artifact that is similar in magnitude and variation among all the users. It is unlikely that multiple untrained users would introduce a similar range of pressure variations, which suggests that the observed variability in the data is an indicator of tissue heterogeneity. The variability observed in volunteers A, B, and C is overall within our defined limits. The vascular parameters , BVF, and VD all show slightly larger variability compared to the optical properties and . However, in almost all instances, the individual user average was within one standard deviation of the group average. In the case of BVF [Fig. 2(b)], where pressure effects should be most clearly observed, two users do display a larger variability in their measurements on volunteer B. Because this variability does not correlate to variability in other pressure-sensitive optical properties, such as , however, we believe that the increased standard deviation is not related to pressure artifacts. Interestingly, the mean value as well as the variability of BVF and VD was larger in the face than in the arm [Figs. 3(b)–3(c)]. It is well known that the superficial cutaneous vasculature of the face is more evident than that of the arm. In fact, there are more capillary loops per square centimeter in the face compared to other sites.11 Furthermore, it is known that the superficial vessels of the skin are wider in the face than anywhere else.12 This is supported by the observation that we measured higher BVF and VD in the face compared to the arm. The fact that the face has more complex vasculature might be the cause of more variability in the BVF and VD measured on the face. In line with our expectation, stronger agreement between different users was found in the tissue optical properties of and the corrected integrated intrinsic autofluorescence excited using a 405-nm laser. Variability of was within the limit of one standard deviation and most individual users measured values within one standard deviation. The intrinsic fluorescence [Fig. 3(f)] is corrected for tissue properties using the absorption and scattering characteristics measured in the MDSFR/SFF system. It is, therefore, susceptible to variability in reflectance and fluorescence arising from the probe application. However, the extracted intrinsic fluorescence seemed to be highly repeatable between users. The results of the ANOVA analysis, shown in Table 2, show that the null hypothesis (that all users measure the same average properties) is supported for , (800), and . For the and BVF, this is partially true. However, as started earlier, since this does not correlate with changes in variability of other pressure-related parameters such as (800), which would also be affected by increased pressure, we believe that this relatively high variability in and BVF is not related to pressure artifacts. To investigate variability in older individuals, three volunteers older than 55 years of age were included. Although only one user measured the individuals, intraperson variability did not differ from younger individuals (Fig. 4). For all parameters, both vascular as well as optical intrauser variability was comparable to the ones measured in younger skin. The VD measured on the arm of volunteer E was an exception. This was, however, due to two outliers. If those measurements would have been omitted, variability would be comparable to the other volunteers. Since the measurements on older individuals seem to correlate well with respect to variability, we believe that our MDSFR/SFF is also very well suited for mature skin. Based on the repeatability of the optical properties, we conclude that variation in the MDSFR/SFF system is primarily caused by tissue heterogeneity. Variation in probe placing or pressure does not play a large role. It is interesting to consider strategies to reduce the influence of probe pressure. A clear disk around the tip of the probe might achieve such a goal such that a greater contact surface is provided at the sample. However, this would be very inconvenient, since this modification would have to be removed before calibration before the probe can be inserted into the calibration sphere. Furthermore, if the disk is not properly aligned with the angle of the probe tip, all subsequent measurements would experience this uneven contact with the tissue. Also, a disk would prevent proper use of the system on places where the tissue is not flat, such as the edge of the nose, or between the extensor tendons on the back of the hand. Finally, the current probe tip is only 5-mm wide, which makes it suitable for difficult-to-reach locations. A disk would, at least partially, impede these types of measurements. 5.ConclusionIn this study, eight untrained users were recruited to measure three different volunteers on the hand, arm, face, and nose using the MDSFR/SFF spectroscopy system. The parameters recovered from the measurements, especially (800), , and the intrinsic fluorescence, showed variability that was within our predefined cut-off of one standard deviation. The MDSFR/SFF device is now used in a larger population-based study to investigate differences between location with respect to , BVF, VD, the reduced scattering coefficient, and autofluorescence. ReferencesE. Macsai et al.,
“Verification of skin autofluorescence values by mass spectrometry in adolescents with type 1 diabetes: brief report,”
Diabetes Technol. Ther., 15
(3), 269
–272
(2013). http://dx.doi.org/10.1089/dia.2012.0251 DTTHFH 1520-9156 Google Scholar
A. Amelink et al.,
“In vivo measurement of the local optical properties of tissue by use of differential path-length spectroscopy,”
Opt. Lett., 29
(10), 1087
–1089
(2004). http://dx.doi.org/10.1364/OL.29.001087 OPLEDP 0146-9592 Google Scholar
S. C. Kanick et al.,
“Measurement of the reduced scattering coefficient of turbid media using single fiber reflectance spectroscopy: fiber diameter and phase function dependence,”
Biomed. Opt. Express, 2
(6), 1687
–1702
(2011). http://dx.doi.org/10.1364/BOE.2.001687 BOEICL 2156-7085 Google Scholar
S. C. Kanick et al.,
“Extraction of intrinsic fluorescence from single fiber fluorescence measurements on a turbid medium,”
Opt. Lett., 37
(5), 948
–950
(2012). http://dx.doi.org/10.1364/OL.37.000948 OPLEDP 0146-9592 Google Scholar
S. C. Kanick et al.,
“Monte Carlo analysis of single fiber reflectance spectroscopy: photon path length and sampling depth,”
Phys. Med. Biol., 54
(22), 6991
–7008
(2009). http://dx.doi.org/10.1088/0031-9155/54/22/016 PHMBA7 0031-9155 Google Scholar
U. A. Gamm et al.,
“Measurement of tissue scattering properties using multi-diameter single fiber reflectance spectroscopy: in silico sensitivity analysis,”
Biomed. Opt. Express, 2
(11), 3150
–3166
(2011). http://dx.doi.org/10.1364/BOE.2.003150 BOEICL 2156-7085 Google Scholar
U. A. Gamm et al.,
“Quantification of the reduced scattering coefficient and phase-function-dependent parameter gamma of turbid media using multidiameter single fiber reflectance spectroscopy: experimental validation,”
Opt. Lett., 37
(11), 1838
–1840
(2012). http://dx.doi.org/10.1364/OL.37.001838 OPLEDP 0146-9592 Google Scholar
S. C. Kanick et al.,
“Method to quantitatively estimate wavelength-dependent scattering properties from multidiameter single fiber reflectance spectra measured in a turbid medium,”
Opt. Lett., 36
(15), 2997
–2999
(2011). http://dx.doi.org/10.1364/OL.36.002997 OPLEDP 0146-9592 Google Scholar
J. D. Rogers, I. R. Çapoglu and V. Backman,
“Nonscalar elastic light scattering from continuous random media in the Born approximation,”
Opt. Lett., 34
(12), 1891
–1893
(2009). http://dx.doi.org/10.1364/OL.34.001891 OPLEDP 0146-9592 Google Scholar
C. L. Hoy et al.,
“Method for rapid multidiameter single-fiber reflectance and fluorescence spectroscopy through a fiber bundle,”
J. Biomed. Opt., 18
(10), 107005
(2013). http://dx.doi.org/10.1117/1.JBO.18.10.107005 JBOPFO 1083-3668 Google Scholar
G. I. Taylor and J. H. Palmer,
“The vascular territories (angiosomes) of the body: experimental study and clinical applications,”
Br. J. Plast. Surg., 40
(2), 113
–141
(1987). http://dx.doi.org/10.1016/0007-1226(87)90185-8 BJPSAZ 0007-1226 Google Scholar
J. Wilkin, Flushing and Blushing, in Dermatology, 2080
–2083 WB Saunders, Philadelphia
(1992). Google Scholar
BiographySander Brooks received his BSc degree in biomedical sciences from the Leiden University, The Netherlands, in 2008, his MSc degree in biomedical sciences, together with his medical degree in 2013. He is currently pursuing his PhD at the Department of Dermatology at the Erasmus Medical Center in Rotterdam, The Netherlands. Christopher L. Hoy received his PhD degree in mechanical engineering from the University of Texas at Austin in 2011, where he developed tools and applications for ultrafast laser microsurgery. In 2011, he joined the Center for Optical Diagnostics and Therapy at Erasmus Medical Center in Rotterdam, the Netherlands, conducting postdoctoral research on quantitative diagnostic spectroscopy techniques. Currently, he works as a research scientist at Boulder Nonlinear Systems, in Lafayette, Colorado, developing biomedical applications of liquid crystal technologies. Arjen Amelink received his master’s degree in experimental physics from the University of Groningen in 1995, and his PhD in atomic physics from the University of Utrecht in 2000. After one year in the optical storage group at Philips Research, he started working at the Erasmus Medical Center in Rotterdam, where his research focused on clinical applications of optical spectroscopic technologies. Since 2014, he has been senior scientist at the Netherlands Research Organization for Applied Sciences TNO. Dominic J. Robinson received his BSc degree in physics from the University of Manchester, UK, in 1992, and his MSc degree in medical physics and PhD from the University of Leeds, UK, in 1998. He is appointed as a assistant professor in 2002 at the Center for Optical Diagnostics and Therapy of the Erasmus Medical Center in Rotterdam, and he is leading a range of projects centred on the translational development of optical diagnostics and photodynamic therapy. Tamar E. Nijsten is head of the Department of Dermatology, Erasmus MC. In addition to patient care, his research is focused on the epidemiology of skin cancer and aging. The introduction of optic techniques in the diagnosis of skin diseases is a scientific and clinical challenge that might have enormous clinical relevance. |