
|
|
1.IntroductionCirculating tumor cells (CTCs) are cells that have separated from a tumor mass and circulate in bodily fluids such as blood. These cells can contribute to the spread of tumors, i.e., secondary tumors or metastases distant from the originating organ. The number of CTCs in peripheral blood of patients and its time-dependent evolution are important markers to diagnose disease, to assess the success of therapy, and to estimate the prognosis. CTCs are extremely rare. Even in patients with advanced tumors there are only a few CTCs for every billion normal blood cells. This makes detection and isolation challenging. The technologies that are currently available for CTC isolation, the utility of CTCs as a diagnostic, and prognostic marker in various cancers and molecular properties of these rare cells have been reviewed.1 Current detection technologies are based on (1) free DNA or RNA circulating in plasma from patients with cancer; (2) physical properties of CTCs that include the larger size of most epithelial cells and differences in density, charge, or migratory properties; and (3) antibodies against specific cell surface antigens such as epithelial cell adhesion molecule (EpCAM, CD326). The CellSearch system (Veridex) is the only FDA (U.S. Food and Drug Administration)-approved technique that uses ferrofluids loaded with an EpCAM antibody to capture CTCs that are subsequently visualized by staining with a cocktail of antibodies against cytoplasmic epithelial cytokeratins.2 Even after the labels are applied, the acquired CTC samples are only 50% pure.3 In other words, only 50% of the cells identified as tumor cells are actually tumor cells. It is unclear how many tumor cells are misclassified as normal. Our group developed Raman spectroscopic approaches to identify cells isolated with optical tweezers4 and in microfluidic chips comprised of glass with 514-nm excitation5 and quartz with 785-nm excitation.6 Although correct classification rates were above 95%, implementation of Raman-activated cell sorting (RACS) suffers from relatively long exposure times of seconds per cell and low throughput. Surface-enhanced Raman spectroscopy (SERS) is a variant to improve the sensitivity and throughput of Raman-based detection schemes by several orders of magnitude. Together with enrichment or preselection of suspicious cells by rapid, yet low-specificity screening tools, SERS may become a powerful tool for detection of CTCs in blood. The SERS effect can be achieved by designing substrates (such as Ag nanorod assays7 and other microfabrication procedures8) or nanoparticles (NPs) that are enzymatically formed9 or chemically prepared (this work and the following citations). The Raman bands of molecules are enhanced after adsorption on nano-sized metals and excitation of surface plasmon polariton modes by appropriate laser wavelengths. Progress and trends of SERS for sensing molecules in trace amounts within the field of chemical and biochemical analytics have been described.10–12 The high potential of SERS in cancer detection and imaging has recently been discussed.13 Challenges attributed to the application of SERS in the context of cell detection are nonspecific binding and low reproducibility. These issues have been overcome by surface functionalization with cell-specific antibodies and the introduction of reporter molecules. Successful implementations have been reported by several authors. SERS-labels were functionalized with an epidermal growth factor (EGF) antibody to quantify CTCs in blood samples.14 HER2 is another frequently used antigen for SERS-based differentiation of tumor cells by hollow gold nanospheres,15 gold nanorods,16 silver NP-embedded silica spheres,17 gold nanocorals,18 and in combination with EpCAM-labeled magnetic particles.19 Another combination of trapping by magnetic NP and SERS-active NP was proposed for CTC detection.20 Both NPs were targeted to folate receptor which is overexpressed on many cancer cells yet absent on most normal blood cells. Advantages compared to fluorescence labels include that SERS labels show a very low spectral width of the Raman bands.21 The narrow spectral features of the SERS signal enable more distinct probes to be measured in a smaller region of the optical spectrum with a single laser and detector, allowing for higher levels of multiplexing and multiparameter analysis, which means 10 or more SERS labels can be demixed with low crosstalk.20,22,23 The excellent multiplexing capacity can be further increased using a mixtures of SERS-active molecules.24,25 For the detection of CTCs, this enables a strategy to apply multiple SERS labels and simultaneously identify multiple tumor-specific antigens.26,27 As a proof of concept, the actively targeted multiplex in vitro detection of three intrinsic cancer biomarkers—EGFR, CD44, and —was demonstrated in a breast cancer model using three multiplexing-capable, biocompatible SERS nanoparticles/nanotags.28 Another work described the expression of EGF, ErbB2, and insulin-like growth factor-1 (IGF-1) receptors in human breast cancer cell lines by SERS.29 Silver-gold nanorods were functionalized with four Raman-active molecules and four antibodies specific to breast cancer markers, i.e., EpCAM, IGF-1 receptor , CD44, and keratin 18.30 SERS NPs show also photothermal (PT) properties that were used for multimodal SERS-PT diagnosis30 and as PT therapeutic agents for theranosis.31 In the latter study, nanorattels were functionalized by estrogen receptor-alpha antibody that targets MCF-7 cell surfaces. Beside single cells, immuno-SERS microscopy has been applied to tissue imaging with single-particle sensitivity.32 Coherent anti-Stokes Raman scattering (CARS) is a nonlinear variant of Raman spectroscopy that has been coupled with surface enhancement (SE) using antibody-labeled metallic nanoshells.33 The paper employed this so-called SECARS approach for selective, sensitive, and rapid localization of the basal cell protein p63 in normal prostate tissue. The current paper addresses the application and describes further developed multicore SERS labels (MSLs) that were designed for 785-nm excitation.34 First, successful conjugation of the antibody EpCAM is shown by dark field and fluorescence microscopy. EpCAM antigen is a transmembrane glycoprotein involved in cell signaling,35 migration,36 proliferation, and differentiation.37 EpCAM is known to be highly expressed in epithelial carcinoma36 and is frequently used as a diagnostic marker. Second, Raman spectroscopy proved the specific and nonspecific binding of functionalized and nonfunctionalized MSLs to MCF-7 tumor cells, leukocytes from blood, and nontransformed human foreskin fibroblasts. Furthermore, the subcellular distribution of MSLs was visualized by Raman imaging and dark field microscopy. Finally, viability tests were performed with living tumor cells to demonstrate the low toxicity of MSL-EpCAM at 785-nm laser excitation. 2.Experimental2.1.ChemicalsTetraethyl orthosilicate (TEOS) was ordered from Wako Pure Chemical Industries (Germany). Poly(vinylpyrrolidone) (Mw 55,000) (PVP), 3-mercaptobenzoic acid, 4-mercaptophenol, 4-mercaptobenzoic acid, thiophenol, 6-mercaptopyridine-3-carboxylic acid, 2-mercapto-4-methylthiazol-5-acetic acid, (3-aminopropyl)triethoxysilane (APTES), 4,7,10-trioxa-1,13-tridecanediamine, -hydroxysulfosuccinimide sodium salt (sulfo-NHS), PAMAM dendrimer generation 4.5 polyamidoamine, ethanol (99.8%), ammonia (30 wt. %), phosphate-buffered saline (PBS), 2-(-morpholino)ethanesulfonic acid (MES), bovine serum albumin (BSA), and propidium iodide solution ( in water) were purchased from Sigma–Aldrich (Germany). EDC-hydrochloride was supplied from AppliChem GmbH (Germany). A silver-enhancing kit was received from BBI international, Plano GmbH (Germany). Polyvinyl alcohol (Mw 30,000–70,000) (PVA) was obtained from VWR (Germany). EpCAM (VU1D9) mouse mAb (Alexa Fluor®488) was supplied from New England BioLabs GmbH (Germany). Sterile syringe filter (220-nm pore size) made of polyethersulfone from Rotilabo® was used. Deionized water was used in all procedures. For cell culture DMEM (Dulbecco’s Modified Eagle Medium), pen/strep (penicillin/streptomycin), EDTA (ethylenediaminetetraacetic acid), and erythrocytes lysing buffer were purchased from Invitrogen, and FCS (fetal bovine serum) was ordered from Biochrom AG (Germany). 2.2.Multicore Surface-Enhanced Raman Spectroscopy LabelsThe preparation of MSLs was previously reported.34 In brief, aggregation of gold NPs around 40 nm in diameter was controlled with a linear water-soluble diamine. Raman reporter molecules were covalently bound at the metal surface. In our approach, a reporter molecule concentration of (%vol.) in water was applied. MSLs with the reporter molecule 3-mercaptobenzoic acid, 4-mercaptobenzoic acid, and thiophenol were used for cell experiments. Different charged polymers such as PVP and PVA prevent further aggregation and support the growth of a silica shell. Before preparation of the silica shell, silver was deposited at the surface of gold aggregates with reporter molecules. Then, MSL was filtered with a syringe filter (220-nm pore size) to remove larger clusters. After that the silica shell was completed by the use of TEOS and ammonia. 2.3.Surface FunctionalizationThe silica shell was functionalized in an improved way with APTES as follows. After 20-min incubation with TEOS, of APTES was added under vigorous stirring to the mixture for further 10 min. The mixture was then washed twice with ethanol and once with water. Sonication was used between the washing steps to suspend the MSL. After a further washing step, water was removed and the pellet was suspended in a mixture of PAMAM dendrimer, 3.7 mg EDC, and 4.2 mg sulfo-NHS aliquot with MES buffer () to complete the final volume to 1 mL and activated for 30 min by shaking before using. The reaction mixture with the MSL was shaken for another 30 min. To remove all unreacted dendrimer solutions, the suspension was washed with MES buffer by centrifugation (8000 rpm, 5 min) two times. of EpCAM (alexa®fluor 488) antibody was added to the activated MSL and was carefully shaken for 3 h. Finally, all unreacted proteins were removed from the solution (6000 rpm, 5 min) and the sample was washed by centrifugation three times with block buffer (, BSA). 2.4.Cell Cultivation and ReagentsFor cell experiments, the cell lines MCF-7 (breast adenocarcinoma) and human foreskin fibroblasts (HFFs) as well as primary leukocytes from healthy volunteers were used. MCF-7 cells and HFFs were cultured in pen/strepat 37°C under a 5% atmosphere. For splitting the confluent culture of MCF-7 cells, trypsin and EDTA were used. Leukocytes from whole blood samples were prepared by lysis of 8-mL patient blood with 40-mL erythrocyte lysis buffer for 10 min. White blood cells were collected by centrifugation (10 min, 1200 rpm). In a second step, the leukocyte pellet was resuspended with 15-mL erythrocyte lysis buffer and incubated for 10 min. After centrifugation, the cell pellet containing leukocytes was suspended in PBS + 2 mM EDTA buffer. 2.5.Cell DetectionAfter the cells were grown for 1 day, cells were transferred into block buffer ( BSA) for 30 min. Anti-EpCAM antibody functionalized and nonfunctionalized MSL were added to the cells in a defined concentration, volume, and time. In detail, nonfunctionalized MSL in two different concentrations ( and 0.15 at 534 nm) were added to of MCF-7 cells or leukocytes in block buffer for 1 h. Incubation was carried out during mixing of cells. Cells were washed by centrifugation (5 min, 300 rpm) with block buffer three times. MCF-7 cells and leukocytes in suspension were also treated with EpCAM functionalized MSL (MSL-EpCAM) in three different concentrations (, 0.13, and 0.15 at 534 nm) in the same manner. Adherent MCF-7 cells and HFF grown on slides were transferred into 2.5-mL block buffer and treated with MSL-EpCAM ( at 534 nm) for 1 h. Furthermore, MCF-7 cells were incubated with MSL-EpCAM for 30 min, 1, and 2 h in the same manner. To test successful removal of free MSL by centrifugation, buffer without cells was measured. 2.6.Spectroscopy and MicroscopyRaman spectra were collected using two different microscopic Raman systems. Single Raman spectra of whole single cells ( objective, ) and NP suspensions ( objective, ) were collected with the RXN1 microprobe (Kaiser Optical Systems). The transmissive holographic grating covers the spectral range from 0 to at a spectral resolution of . The instrument contains a built-in multimode laser at 785 nm (Invictus). The laser wavelength was calibrated using cyclohexane, the intensity axis was calibrated using a white light source, and the wavenumber axis was calibrated using a helium neon source according to the manufacturer’s instructions. Cell maps were measured using an Alpha 300R Plus confocal Raman microscope with a single-mode diode laser at 785 nm (WITec, Ulm, Germany) and a water-immersion objective (Nikon, Japan). Spectra were collected with a step size, an exposure time of 0.5 s using a grating, and 25-mW laser power. The spectral resolution was about and the spectral window ranged from 300 to . For collection of Raman spectra slides and quartz glass cuvettes were used. Raman spectra were baseline-corrected and intensity-normalized (vector normalization) using the Opus software (Bruker). Raman maps were analyzed with WITec Project software. Fluorescence images were measured with an AxioImager A1 from Zeiss (filter set No. 09: STX-excitation: 450 to 490 nm, STX-emission: 515 to 565 nm). Absorption spectra were collected using the V-670 (Jasco, Japan) spectrophotometer. Transmission electron microscopy (TEM) images were acquired with a CEM 902A (Zeiss, Germany) at 300 mesh-grids (formvar/carbon-film). Centrifuges Heraeus Fresco 17 (Thermo Scientific) and UniGen 15DR (Herolab) were used for sample preparation. 3.Results and Discussion3.1.Structural and Optical Characterization of MSLThe final structure of MSLs is shown in Fig. 1(a) and consists of aggregated gold NPs, a monolayer of reporter molecules, a thin silver shell, a silica shell, and antibodies. The optimized procedure included to encapsulate MSL with APTES instead of APTMS. Because of the slower reaction times of APTES, a more controlled growth of the silica shell is possible. Fig. 1(a) Structure of multicore surface-enhanced Raman spectroscopy (SERS) labels (MSL). (b) SERS spectra of aggregated gold nanoparticles with reporter molecule 3-mercaptobenzoic acid without (black), thin (green), medium (red), and thick silver shell (blue). (c) Transmission electron microscope (TEM) images of MSLs, (d) silica coated MSL after incubation with tetraethyl orthosilicate (TEOS) for 30 min (e) and after incubation with TEOS for 20 min followed by APTES for 10 min. The blue arrow marks the transition between both silanes. (f) Absorbance spectrum of MSL.  A thin silver shell further enhances the SERS intensities of Raman reporter 3-mercaptobenzoic acid bound to the gold NPs [Fig. 1(b)]. The decrease of the SERS intensities with increasing thickness of the silver shell might be due to the lower penetration of radiation. A silica shell prevents adsorption and enhancement of interfering molecules, and provides stability of MSLs against further aggregation for more than 3 months. After storage for 1 year in the dark at ambient temperature, MSLs gave SERS signals of similar intensities (data not shown). The aggregation was controlled with the aim that between two and four gold NPs were present in the silica shell [Fig. 1(c)]. The silica thickness is around 12 nm after a 30-min incubation time [Fig. 1(d)]. Adding APTES to the mixture for the last 10 min gave a significant increase to overall 22 nm [Fig. 1(e)]. This is attributed to the higher reactivity of APTES compared to TEOS. In TEM images, the transition between the two silanes is visible [Fig. 1(e), blue arrow] Silica provides an effective binding site for conjugation of the amine-containing APTES. The hydrolysis of APTES to silanols and the further condensation generates a surface with organo-functional alkoxysilane molecules. APTES-functionalized surfaces have been shown to be nontoxic,38 and therefore constitute a good and efficient substrate for conjugation of biomolecules. NP aggregates show good SERS enhancement with near-infrared (NIR) excitation39,40 that is consistent with their plasmonic properties with absorption maxima near 534 and 783 nm [Fig. 1(f)]. The slope of the latter band is typical for aggregated gold NPs and enables efficient excitation by NIR lasers at 785 nm. Gaps in gold NP clusters show an enhanced electromagnetic field41 called “hot spots” and enable short measurement times down to milliseconds for adsorbed molecules. 3.2.Antibody ConjugationThe conjugation of the antibody to MSL is shown in Fig. 2. Dark field (c, d) and fluorescence images (a, b) of dried MSL are compared after conjugation of anti-EpCAM antibodies labeled with a fluorescent dye. A polyamidoamine (PAMAM) dendrimer was used to enlarge the surface for covalently binding of antibodies at the silica surface. PAMAM has a specific size and shape and a highly functionalized terminal surface. The term “dendrimer” was derived from its tree-like branching structure. The G4.5 dendrimer contains 128 terminal carboxyl groups on the outer surface. For cross linking of secondary amines (APTES with IgG antibody) with carboxylates (PAMAM dendrimer), EDC and sulfo-NHS enable formation of a stable amide bond. The efficiency of EDC-mediated coupling is increased in the presence of sulfo-NHS. Fluorescence images indicate the success of antibody conjugation at the MSL surface after several washing steps. The positions of MSL agree well in the dark field and fluorescence image. Virtually all MSLs are conjugated with a high number of antibodies (Fig. 2). Fig. 2Fluorescence images (a, b) and dark field images (c, d) of anti-EpCAM antibody (Alexa®488) conjugated MSL. Every dot consists of MSL clusters. Little dots may be single MSL. In images (a) and (c) the sample margin is marked. The sample shows the same greenish and bluish backgrounds as the glass slide, respectively. 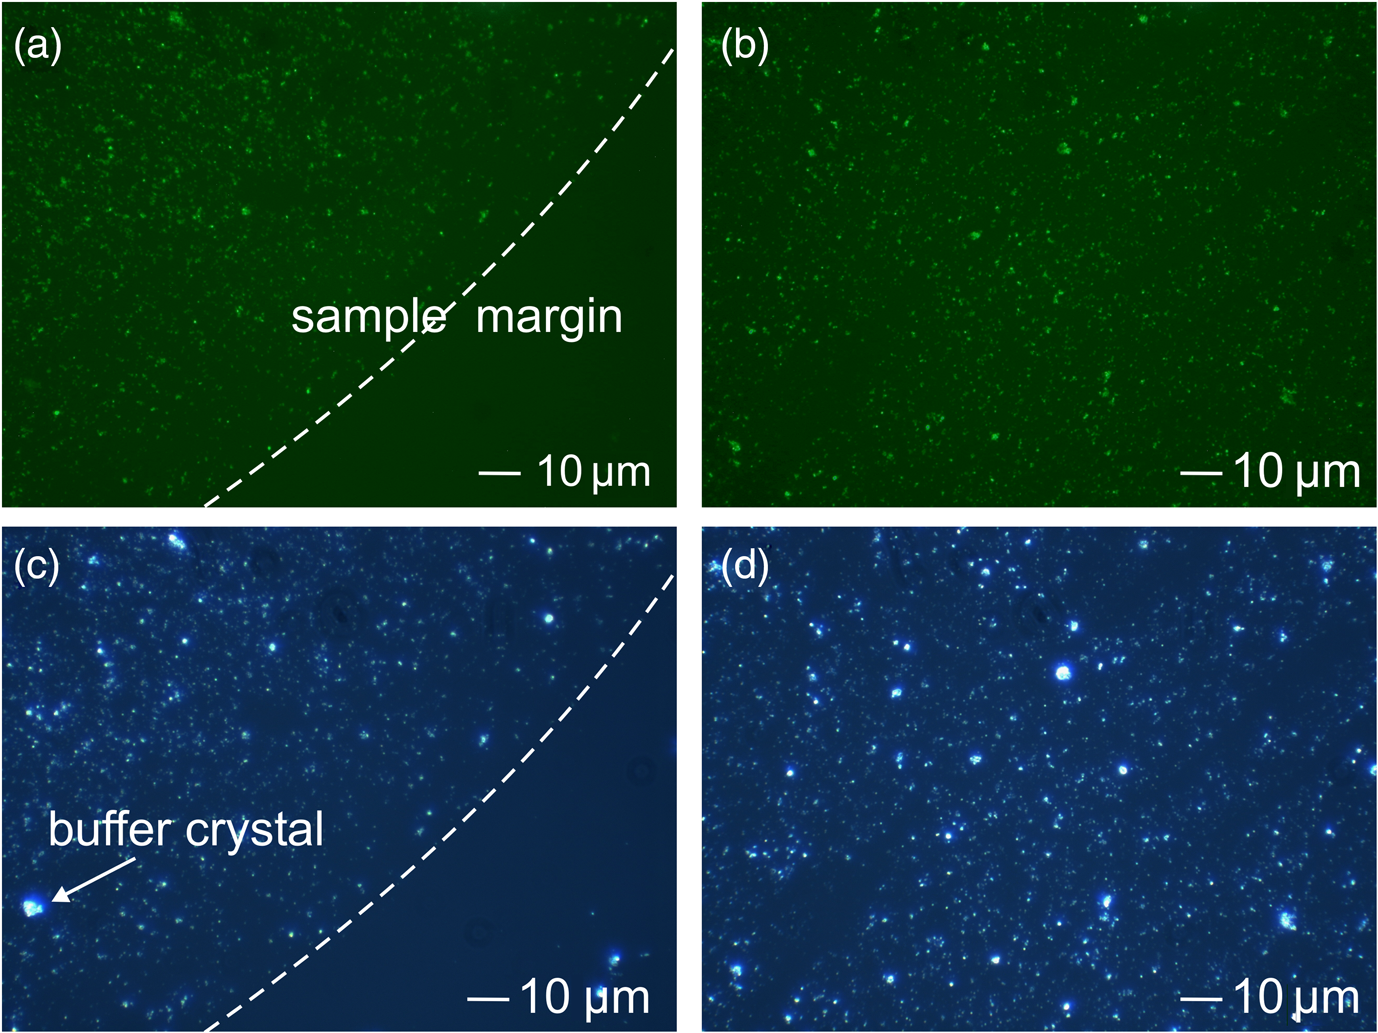 3.3.Cell Detection by Nonfunctionalized MSLThe specificity of nonfunctionalized MSLs (MSL-non) for tumor cell detection was tested by incubating MSLs-non at two different concentrations with living MCF-7 cells in suspension. Raman spectra of about 20 single cells were measured in 1 s with 785-nm excitation. MSLs-non are not expected to bind specifically to cells because of the missing antibody, and subsequently they should not show SERS spectra of the Raman reporter 3-mercaptobenzoic acid. The percentage values indicate the fraction of cells with a SERS spectrum from MSL (Table 1). At low concentrations of MSL-non (), MSL-non did not bind to MCF-7 cells. By increasing the MSL-non concentration (), an unspecific interaction was detected in 70% of cells, this means 30% of measured cells show no SERS signal. Forthcoming experiments will investigate the conditions (such as incubation time and concentration) in more detail if MSLs-non constitutes an alternative route for 100% tumor cell detection. Table 1Percentage of single MCF-7 cells and leukocytes with surface-enhanced Raman spectroscopy (SERS) spectrum of reporter molecule for concentrations of MSL-non and MSL-EpCAM between OD534 nm0.11 and 0.15.
3.4.Cell Detection by Functionalized MSLThe specificity of anti-EpCAM antibody-functionalized MSL (MSL-EpCAM) for tumor cell detection was tested in an analogous manner. As EpCAM is over-expressed in MCF-7 cells, the MSL-EpCAM is expected to bind specifically. At low concentration of MSL-EpCAM (), SERS spectra of the reporter molecule were detected for 75% of the MCF-7 cells in suspension after antibody-antigen binding (Table 1). Compared with the results of MSL-non, this observation suggests true-positive cell detection. After increasing the concentration to , SERS spectra were obtained for 100% of the MCF-7 cells, probably due to a mix of specific and nonspecific binding of MSL-EpCAM to MCF-7 cells. As described above, already 70% of cells bound MSL-non at this concentration. On the one hand, only 75% of MCF-7 cells were specifically detected at concentration; therefore, the MSL-EpCAM concentration needs to be increased for 100% specificity. On the other hand, the concentration should be below to avoid nonspecific interactions. Consequently, the MSL concentration was adjusted. In further experiments, the concentration of MSL-EpCAM was set to an optical density near . After incubation of MCF-7 cells with MSL-EpCAM for 1 h, approximately 100% of MCF-7 cells were detected (Table 1). An uptake of MSL-EpCAM () into the cytoplasm of living adherently grown MCF-7 cells was not observed even after prolonged incubation for 2 h. Dark field images at three depths resolved MSLs only at the upper cell membrane [Fig. 3(a)] but not in cytoplasm (b) and at lower membrane (c). The results in Fig. 3 are consistent with fluorescence images in Fig. 4 and SERS images in Fig. 5 that confirm the localization of MSL-EpCAM near the cell membrane. The large size of MSL over 120 nm and low incubation times might explain the lack of internalization of MSL by cells and the low toxicity in viability tests (see Fig. 6). Incubation times of only half an hour lead to incomplete binding of MSL-EpCAM to MCF-7 cells, and thus give similar results as for using concentrations of MSL-EpCAM below . Fig. 3Dark field images at three focal planes of MCF-7 cells after incubation with MSL-EpCAM for 2 h () (a-c). (a) White circles mark MSLs visible at the upper cell membrane, (b) but not in the cytoplasm, (c) lower membrane. MSLs are not evident within the cell, but at the outer membrane.  Fig. 4(a, c, e, g) Dark fields and (b, d, f, h) fluorescence images of (a, b, e, f) MCF-7 and (c, d, g, h) human foreskin fibroblast (HFF) cells after incubation with fluorescent labeled (a, b, c, d) EpCAM antibodies (Alexa®488) and (e, f, g, h) MSL-EpCAM. Arrows mark MSL-EpCAM at MCF-7 cells in the same region of the fluorescent and dark field images (e, f).  Fig. 5Bright field image of (a) MCF-7 and (b) HFF cells. Chemical map of the C-H deformation band at of (c) MCF-7 and (d) HFF cells. (e, f) Chemical map of the MSL band at . Representative Raman spectra of MSL and cell from the Raman images (position indicated by blue and green star).  Fig. 6Viability test with propidium iodide. Fluorescence and dark field images of MCF-7 cells after incubation with (a, b) MSL-EpCAM or (c, d) pure EpCAM as reference for 1 h. Nuclei of dead cells are colored in red after 1 h incubation time.  MSL-EpCAM was also incubated with leukocytes and binding was monitored by SERS spectroscopy. It was observed that MSL-EpCAM did not bind nonspecifically to leukocytes for concentrations between and 0.15 (Table 1). Although it is unlikely that the binding capacity of MSL-non to leukocytes is higher than MSL-EpCAM, the interaction of MSL-non to leukocytes will also be probed in the context of the specificity of MSL-non for tumor cell detection in forthcoming experiments. As leukocytes are nonadherent cells in suspension, the specificity of MSL-EpCAM was further tested for HFF as an adherent cell line without EpCAM antigen. Cells were grown on slides and incubated with fluorescently labeled EpCAM [Figs. 4(a)–4(d)] and MSL-EpCAM [Figs. 4(e)–4(h)]. Whereas dark field images show a number of cells, fluorescence images prove the binding of EpCAM to MCF-7, but not to HFF [Figs. 4(a)–4(d)]. For MSL-EpCAM, dark field and fluorescence images reveal NPs bound to MCF-7 [Figs. 4(e) and (f)] consistent with Figs. 4(a) and 4(b) but no NPs bound to HFF [Figs. 4(g) and 4(h)]. Raman images of single cells were collected to visualize cellular distribution of MSL-EpCAM whose reporter molecules cannot be detected by fluorescence. Chemical Raman images [Figs. 5(c) and 5(d)] were generated by plotting the intensities of the C-H stretching vibrations between 2800 to for MCF-7 and HFF cells [Figs. 5(a) and 5(b)]. All cells are visualized at a similar intensity scale. The intensities of the reporter molecule band at of thiophenol are also plotted for both cell types on the same scale [Figs. 5(e) and 5(f)]. High intensities were found near the cellular membrane of MCF-7 cells that is consistent with the specific binding of MSL-EpCAM. The Raman image in Fig. 5(e) shows a nonuniform binding of MSL-EpCAM that is consistent with dark field and fluorescence images in Figs. 3 and 4, respectively. The nonuniform binding pattern might point to different affinities or potential blocking of some antigen binding sites. Low intensities in the Raman image of HFF cells demonstrate the absence of MSL-EpCAM binding. A typical spectrum of MSL-EpCAM from the Raman image of MCF-7 cells is dominated by spectral contributions of the reporter molecule (Fig. 5, blue star). For comparison, a typical Raman spectrum of HFF cells is shown with spectral contributions of proteins and lipids, but without the reporter molecule (Fig. 5, green star). 3.5.Cell ViabilityViability tests were carried out with MCF-7 cells using propidium iodide during incubation with MSL-EpCAM in a suspension of living cells for 1 h. Propidium iodide stains necrotic and apoptotic cells in red. Figure 6 shows that the majority of cells are unstained confirming their viability and low toxicity of MSL-EpCAM at the concentration . Only a few cells were stained, which appears to be independent of the incubation with MSL-EpCAM [Figs. 6(a) and 6(b)] or pure EpCAM [Figs. 6(c) and 6(d)]. A few dead cells can always be expected in cell cultures because of occasional necrosis and apoptosis. The low toxicity of MSL-EpCAM is probably related to the large size of more than and the lack of internalization as written above. This observation is consistent with a report that amorphous silica NPs below induced cytotoxicity.42 The authors suggested that the size is decisive to produce biological effects. This hypothesis was confirmed in a murine toxicology study by administration of SERS-active NPs measuring 100 nm in diameter.43 The shape of cells in Figs. 4–6 is slightly different, because of the applied preparation protocol. The cells in Figs. 4 and 5 grew adherently onto slides, whereas the cells in Fig. 6 were treated with trypsin to detach them from slides and transfer them in suspension. Such treatment is known to change the shape of cells. Gold NPs are also used in PT therapies due to their known PT effects by laser irradiation. By using short measurement times of 1 s or less, exciting with a NIR laser and 40-mW laser power phototoxic effects of cells in buffer is expected to be small. Heat-induced cell damage would cause spectral changes in protein vibrational modes that have not been observed so far. 4.ConclusionsAs stated in the Introduction, the CellSearch system (Veridex) gives only 50% pure CTC samples and fails in a considerable number of cases to identify CTCs in a patient’s blood. Possible explanations are that EpCAM is the only antibody that is used to capture CTCs and the expression of antigens varies remarkably between single tumor cells. Therefore, the application of multiple antibodies is a well-accepted route to improve identification and sorting of tumor cells. However, widely used optical and spectroscopic tools in cytometers are based on elastic light scattering and fluorescence that only allow simultaneous detection of a few tags. Another limitation is the stability of fluorescent tags due to photobleaching. SERS tags offer (1) higher stability against photobleaching, (2) high multiplex capability due to enhancement of fingerprint-like signatures, and (3) comparable or even higher intensities than fluorescent tags.44 The authors used the height of one SERS band and the height at the fluorescence maximum to determine a lower detection limit for a SERS-labeled antibody than for a fluorescence labeled antibody using the same instrument with the same laser excitation source. This paper described preparation and properties of SERS-tags against the antigen EpCAM. The protocol can easily be adapted to other reporter molecules and antibodies for multicolor detection of multiple antigens as summarized in the Introduction. Specific detection of MCF-7 tumor cells and no nonspecific binding of MSL to leukocytes and HFF were demonstrated. No toxicity of MSL for cells makes them very interesting for detection of living cells with the option of separation for further investigations. Excitation of localized surface plasmon polariton modes using NIR laser at 785 nm induces low phototoxicity, which depends on the lower energy input at longer wavelengths. Fast measurement times as low as 25 ms per cell render MSL ideal for high-throughput RACS in microfluidic chips. This time is significantly lower than exposure times of 1 s and more in a similar SERS study describing a different protocol.30 SERS-based cytometry has already been recognized as a powerful complement to conventional fluorescence-based cytometry45 and has been demonstrated to detect leukemia and lymphoma cells.46 AcknowledgmentsThe work is funded by the European Union via the “Europäischer Fonds für Regionale Entwicklung” (EFRE), the “Thüringer Ministerium für Bildung, Wissenschaft und Kultur” (Project No. B714-07037), and the “Bundesministerium für Bildung und Forschung” (BMBF) within the Raman CTC project (FKZ: 13N12685). Funding of research projects “QuantiSERS” (FKZ: 03IPT513A) and “Jenaer Biochip Initiative 2.0” (FKZ: 03IPT513Y) within the framework “InnoProfile Transfer—Unternehmen Region” the Federal Ministry of Education and Research, Germany (BMBF), is gratefully acknowledged. Helpful assistance of Franka Jahn (IPHT Jena, Germany) for TEM images and Cornelia Jörke for cell preparation is gratefully acknowledged. ReferencesM. Yu et al.,
“Circulating tumor cells: approaches to isolation and characterization,”
J. Cell Biol., 192
(3), 373
–382
(2011). http://dx.doi.org/10.1083/jcb.201010021 JCLBA3 0021-9525 Google Scholar
S. Riethdorf et al.,
“Detection of circulating tumor cells in peripheral blood of patients with metastatic breast cancer: a validation study of the CellSearch system,”
Clin. Cancer Res., 13
(3), 920
–928
(2007). http://dx.doi.org/10.1158/1078-0432.CCR-06-1695 CCREF4 1078-0432 Google Scholar
S. Nagrath et al.,
“Isolation of rare circulating tumour cells in cancer patients by microchip technology,”
Nature, 450
(7173), 1235
–U1210
(2007). http://dx.doi.org/10.1038/nature06385 NATUAS 0028-0836 Google Scholar
U. Neugebauer et al.,
“Towards detection and identification of circulating tumour cells using Raman spectroscopy,”
Analyst, 135
(12), 3178
–3182
(2010). http://dx.doi.org/10.1039/c0an00608d ANLYAG 0365-4885 Google Scholar
S. Dochow et al.,
“Tumour cell identification by means of Raman spectroscopy in combination with optical traps and microfluidic environments,”
Lab Chip, 11
(8), 1484
–1490
(2011). http://dx.doi.org/10.1039/c0lc00612b LCAHAM 1473-0197 Google Scholar
S. Dochow et al.,
“Quartz microfluidic chip for tumour cell identification by Raman spectroscopy in combination with optical traps,”
Anal. Bioanal. Chem., 405
(8), 2743
–2746
(2013). http://dx.doi.org/10.1007/s00216-013-6726-3 ABCNBP 1618-2642 Google Scholar
P. Negri and R. A. Dluhy,
“Ag nanorod based surface-enhanced Raman spectroscopy applied to bioanalytical sensing,”
J. Biophotonics, 6
(1), 20
–35
(2013). http://dx.doi.org/10.1002/jbio.201200133 JBOIBX 1864-063X Google Scholar
D. Cialla et al.,
“Probing innovative microfabricated substrates for their reproducible SERS activity,”
ChemPhysChem., 9
(5), 758
–762
(2008). http://dx.doi.org/10.1002/cphc.v9:5 CPCHFT 1439-4235 Google Scholar
K. K. Hering et al.,
“Microarray-based detection of dye-labeled DNA by SERRS using particles formed by enzymatic silver deposition,”
ChemPhysChem., 9
(6), 867
–872
(2008). http://dx.doi.org/10.1002/(ISSN)1439-7641 CPCHFT 1439-4235 Google Scholar
D. Cialla et al.,
“Surface-enhanced Raman spectroscopy (SERS): progress and trends,”
Anal. Bioanal. Chem., 403
(1), 27
–54
(2012). http://dx.doi.org/10.1007/s00216-011-5631-x ABCNBP 1618-2642 Google Scholar
M. M. Harper, K. S. McKeating and K. Faulds,
“Recent developments and future directions in SERS for bioanalysis,”
Phys. Chem. Chem. Phys., 15
(15), 5312
–5328
(2013). http://dx.doi.org/10.1039/c2cp43859c PPCPFQ 1463-9076 Google Scholar
T. Vo-Dinh, H. N. Wang and J. Scaffidi,
“Plasmonic nanoprobes for SERS biosensing and bioimaging,”
J. Biophotonics, 3
(1–2), 89
–102
(2010). http://dx.doi.org/10.1002/jbio.200910015 JBOIBX 1864-063X Google Scholar
M. Vendrell et al.,
“Surface-enhanced Raman scattering in cancer detection and imaging,”
Trends Biotechnol., 31
(4), 249
–257
(2013). http://dx.doi.org/10.1016/j.tibtech.2013.01.013 TRBIDM 0167-7799 Google Scholar
X. Wang et al.,
“Detection of circulating tumor cells in human peripheral blood using surface-enhanced Raman scattering nanoparticles,”
Cancer Res., 71
(5), 1526
–1532
(2011). http://dx.doi.org/10.1158/0008-5472.CAN-10-3069 CNREA8 0008-5472 Google Scholar
S. Lee et al.,
“Surface-enhanced Raman scattering imaging of HER2 cancer markers overexpressed in single MCF7 cells using antibody conjugated hollow gold nanospheres,”
Biosens. Bioelectron., 24
(7), 2260
–2263
(2009). http://dx.doi.org/10.1016/j.bios.2008.10.018 BBIOE4 0956-5663 Google Scholar
H. Park et al.,
“SERS imaging of HER2-overexpressed MCF7 cells using antibody-conjugated gold nanorods,”
Phys. Chem. Chem. Phys., 11
(34), 7444
–7449
(2009). http://dx.doi.org/10.1039/b904592a PPCPFQ 1463-9076 Google Scholar
J.-H. Kim et al.,
“Nanoparticle probes with surface-enhanced Raman spectroscopic tags for cellular cancer targeting,”
Anal. Chem., 78
(19), 6967
–6973
(2006). http://dx.doi.org/10.1021/ac0607663 ANCHAM 0003-2700 Google Scholar
L. Y. Wu et al.,
“Bioinspired nanocorals with decoupled cellular targeting and sensing functionality,”
Small, 6
(4), 503
–507
(2010). http://dx.doi.org/10.1002/smll.v6:4 1613-6829 Google Scholar
M. Y. Sha et al.,
“Surface-enhanced Raman scattering tags for rapid and homogeneous detection of circulating tumor cells in the presence of human whole blood,”
J. Am. Chem. Soc., 130
(51), 17214
–17215
(2008). http://dx.doi.org/10.1021/ja804494m JACSAT 0002-7863 Google Scholar
W. Shi et al.,
“Detection of circulating tumor cells using targeted surface-enhanced Raman scattering nanoparticles and magnetic enrichment,”
J. Biomed. Opt., 19
(5), 056014
(2014). http://dx.doi.org/10.1117/1.JBO.19.5.056014 JBOPFO 1083-3668 Google Scholar
S. Schluecker,
“SERS microscopy: nanoparticle probes and biomedical applications,”
Chemphyschem., 10
(9–10), 1344
–1354
(2009). http://dx.doi.org/10.1002/cphc.v10:9/10 CPCHFT 1439-4235 Google Scholar
D. Graham et al.,
“Simple multiplex genotyping by surface-enhanced resonance Raman scattering,”
Anal. Chem., 74
(5), 1069
–1074
(2002). http://dx.doi.org/10.1021/ac0155456 ANCHAM 0003-2700 Google Scholar
C. L. Zavaleta et al.,
“A Raman-based endoscopic strategy for multiplexed molecular imaging,”
Proc. Natl. Acad. Sci. U. S. Am., 110
(25), E2288
–E2297
(2013). http://dx.doi.org/10.1073/pnas.1211309110 PNASA6 0027-8424 Google Scholar
M. Gellner, K. Kompe and S. Schlucker,
“Multiplexing with SERS labels using mixed SAMs of Raman reporter molecules,”
Anal. Bioanal. Chem., 394
(7), 1839
–1844
(2009). http://dx.doi.org/10.1007/s00216-009-2868-8 ABCNBP 1618-2642 Google Scholar
G. von Maltzahn et al.,
“SERS-coded gold nanorods as a multifunctional platform for densely multiplexed near-infrared imaging and photothermal heating,”
Adv. Mater., 21
(31), 3175
(2009). http://dx.doi.org/10.1002/adma.200803464 ADVMEW 0935-9648 Google Scholar
Q. Tu and C. Chang,
“Diagnostic applications of Raman spectroscopy,”
Nanomed. Nanotechnol. Biol. Med., 8
(5), 545
–558
(2012). http://dx.doi.org/10.1016/j.nano.2011.09.013 1549-9634 Google Scholar
K. C. Bantz et al.,
“Recent progress in SERS biosensing,”
Phys. Chem. Chem. Phys., 13
(24), 11551
–11567
(2011). http://dx.doi.org/10.1039/c0cp01841d PPCPFQ 1463-9076 Google Scholar
U. S. Dinish et al.,
“Actively targeted in vivo multiplex detection of intrinsic cancer biomarkers using biocompatible SERS nanotags,”
Sci. Rep., 4 4075
(2014). http://dx.doi.org/10.1038/srep04075 SRCEC3 2045-2322 Google Scholar
S. Lee et al.,
“Rapid and sensitive phenotypic marker detection on breast cancer cells using surface-enhanced Raman scattering (SERS) imaging,”
Biosens. Bioelectron., 51 238
–243
(2014). http://dx.doi.org/10.1016/j.bios.2013.07.063 BBIOE4 0956-5663 Google Scholar
Z. A. Nima et al.,
“Circulating tumor cell identification by functionalized silver-gold nanorods with multicolor, super-enhanced SERS and photothermal resonances,”
Sci. Rep., 4 4752
(2014). http://dx.doi.org/10.1038/srep04752 SRCEC3 2045-2322 Google Scholar
Z. L. Chen et al.,
“Tunable SERS-tags-hidden gold nanorattles for theranosis of cancer cells with single laser beam,”
Sci. Rep., 4 6709
(2014). http://dx.doi.org/10.1038/srep06709 SRCEC3 2045-2322 Google Scholar
M. Salehi et al.,
“Rapid immuno-SERS microscopy for tissue imaging with single-nanoparticle sensitivity,”
J. Biophotonics, 6
(10), 785
–792
(2013). http://dx.doi.org/10.1002/jbio.201200148 JBOIBX 1864-063X Google Scholar
S. Schlucker et al.,
“Immuno-surface-enhanced coherent anti-Stokes Raman scattering microscopy: immunohistochemistry with target-specific metallic nanoprobes and nonlinear Raman microscopy,”
Anal. Chem., 83
(18), 7081
–7085
(2011). http://dx.doi.org/10.1021/ac201284d ANCHAM 0003-2700 Google Scholar
I. Freitag et al.,
“Preparation and characterization of multicore SERS labels by controlled aggregation of gold nanoparticles,”
Vib. Spectrosc., 60 79
–84
(2012). http://dx.doi.org/10.1016/j.vibspec.2012.02.013 VISPEK 0924-2031 Google Scholar
D. Maetzel et al.,
“Nuclear signalling by tumour-associated antigen EpCAM,”
Nat. Cell Biol., 11
(2), 162
–117
(2009). http://dx.doi.org/10.1038/ncb1824 NCBIFN 1465-7392 Google Scholar
W. A. Osta et al.,
“EpCAM is overexpressed in breast cancer and is a potential target for breast cancer gene therapy,”
Cancer Res., 64
(16), 5818
–5824
(2004). http://dx.doi.org/10.1158/0008-5472.CAN-04-0754 CNREA8 0008-5472 Google Scholar
S. V. Litvinov et al.,
“Expression of Ep-CAM in cervical squamous epithelia correlates with an increased proliferation and the disappearance of markers for terminal differentiation,”
Am. J. Pathol., 148
(3), 865
–875
(1996). AJPAA4 0002-9440 Google Scholar
A. Natarajan et al.,
“Growth and electrophysiological properties of rat embryonic cardiomyocytes on hydroxyl- and carboxyl-modified surfaces,”
J. Biomater. Sci. Polymer Edition, 19
(10), 1319
–1331
(2008). http://dx.doi.org/10.1163/156856208786052399 JBSEEA 0920-5063 Google Scholar
K. Kneipp, H. Kneipp and J. Kneipp,
“Surface-enhanced Raman scattering in local optical fields of silver and gold nanoaggregates: from single-molecule Raman spectroscopy to ultrasensitive probing in live cells,”
Acc. Chem. Res., 39
(7), 443
–450
(2006). http://dx.doi.org/10.1021/ar050107x ACHRE4 0001-4842 Google Scholar
J. Kneipp et al.,
“In vivo molecular probing of cellular compartments with gold nanoparticles and nanoaggregates,”
Nano Lett., 6
(10), 2225
–2231
(2006). http://dx.doi.org/10.1021/nl061517x NALEFD 1530-6984 Google Scholar
A. S. D. S. Indrasekara et al.,
“Dimeric gold nanoparticle assemblies as tags for SERS-based cancer detection,”
Adv. Healthcare Mater., 2
(10), 1370
–1376
(2013). http://dx.doi.org/10.1002/adhm.v2.10 AHMDBJ 2192-2640 Google Scholar
K. O. Yu et al.,
“Toxicity of amorphous silica nanoparticles in mouse keratinocytes,”
J. Nanopart. Res., 11
(1), 15
–24
(2009). http://dx.doi.org/10.1007/s11051-008-9417-9 JNARFA 1388-0764 Google Scholar
A. S. Thakor et al.,
“The fate and toxicity of Raman-active silica-gold nanoparticles in mice,”
Sci. Transl. Med., 3
(79),
(2011). http://dx.doi.org/10.1126/scitranslmed.3001963 STMCBQ 1946-6234 Google Scholar
G. Sabatte et al.,
“Comparison of surface-enhanced resonance Raman scattering and fluorescence for detection of a labeled antibody,”
Anal. Chem., 80
(7), 2351
–2356
(2008). http://dx.doi.org/10.1021/ac071343j ANCHAM 0003-2700 Google Scholar
J. P. Nolan et al.,
“Single cell analysis using surface enhanced Raman scattering (SERS) tags,”
Methods, 57
(3), 272
–279
(2012). http://dx.doi.org/10.1016/j.ymeth.2012.03.024 MTHDE9 1046-2023 Google Scholar
C. M. MacLaughlin et al.,
“Surface-enhanced Raman scattering dye-labeled Au nanoparticles for triplexed detection of leukemia and lymphoma cells and SERS flow cytometry,”
Langmuir, 29
(6), 1908
–1919
(2013). http://dx.doi.org/10.1021/la303931c LANGD5 0743-7463 Google Scholar
BiographyIsabel Freitag studied biology at the Friedrich-Schiller University in Jena. She worked as a PhD student at IPHT in the Department of Spectroscopy and Imaging, Optical Cell Diagnostics Research Group, and received her PhD degree from the Friedrich-Schiller University Jena in 2015. Christian Matthäus studied chemistry at the Technical University in Berlin and the University of Oklahoma. He received his PhD degree in Professor Max Diem’s laboratories at the City University of New York. In 2006, the group moved to Northeastern University in Boston, where he was offered a postdoctoral position. In 2009, he started working as a research assistant at the IPHT. His research interests involve applying various spectroscopic techniques to characterize biological samples. Andrea Csáki received her PhD degree in molecular biology and nanotechnology in 2003 at the Friedrich-Schiller University Jena, Germany. Since then, she has been working as a research scientist at the IPHT in the field of molecular plasmonics and localized surface plasmon resonance (LSPR)-based bioanalytics, especially for DNA sensings. Joachim H. Clement received his PhD degree from the University of Ulm. Since 1995, he has been a laboratory manager of the Oncology Research Lab of the Department of Hematology and Oncology at the Jena University Hospital. His work focuses on the detection and identification of circulating tumor cells (CTCs) in general and the comprehensive molecular characterization of these cells, in particular. He is furthermore engaged in the introduction of innovative nanomaterials into biomedical applications. Dana Cialla-May received her PhD degree in physical chemistry from the Friedrich-Schiller University Jena in 2010. Since 2011, she and Karina Weber have been responsible for the Jena Biochip Initiative research group within the Department of Spectroscopy and Imaging at IPHT. Her work focuses on fundamental characterization of plasmonic devices employing different spectroscopic methods as well as new bioanalytical application fields based on plasmonics. Karina Weber obtained her PhD degree in analytical chemistry from the Clausthal University of Technology in 2006. From 2007 to 2011 she was a postdoc in the Department Spectroscopy and Imaging (IPHT Jena) under the supervision of Professor Dr. Jürgen Popp. Since 2011, she has been leading, together with her colleague Dr. Dana Cialla-May, the Jena Biochip Initiative research group within the Department of Spectroscopy and Imaging at IPHT. Her research is focused on innovative chip-based analytical methods in life sciences. Christoph Krafft received his PhD degree in biophysics from the Humboldt University of Berlin and his habilitation in analytical chemistry from the University of Technology of Dresden. From 2000 to 2006, he led the Molecular Endospectroscopy research group to develop and apply Raman and infrared spectroscopic imaging to biomedical and clinical-related problems. Since 2008, he has been leading the Optical Cell Diagnostics research group within the Department of Spectroscopy and Imaging at IPHT. Jürgen Popp received his PhD degree and his habilitation in physical chemistry from the University of Würzburg. Since 2001, he has held a chair of physical chemistry at the Friedrich-Schiller University Jena and was appointed as scientific director of the IPHT in 2006. He is directing the research in the Department Spectroscopy and Imaging at the IPHT. His work focuses on biophotonics, in general, and the development and application of linear and nonlinear Raman-based sensing and imaging, in particular. |
|||||||||||||||||||


