|
|
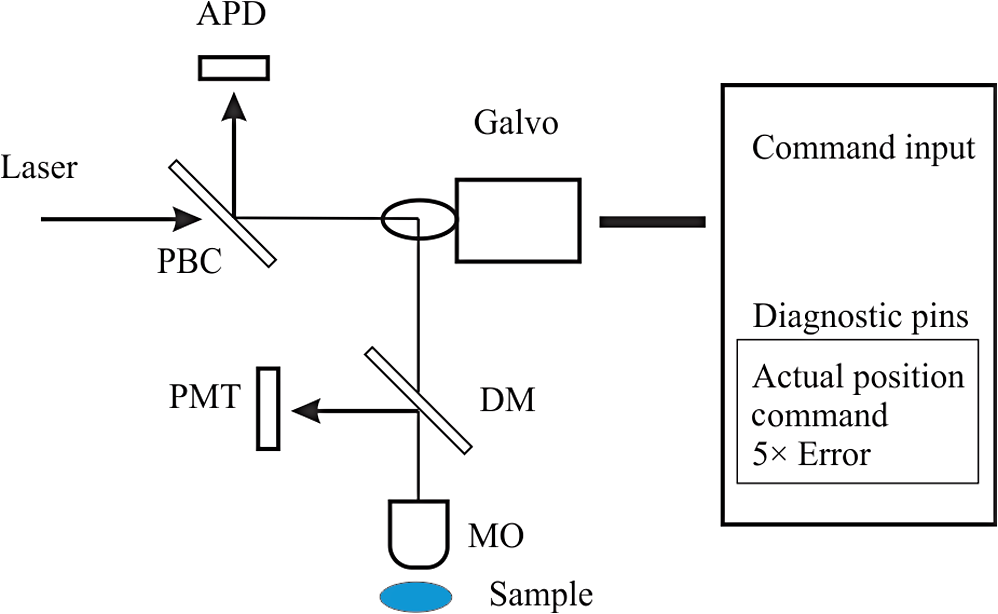
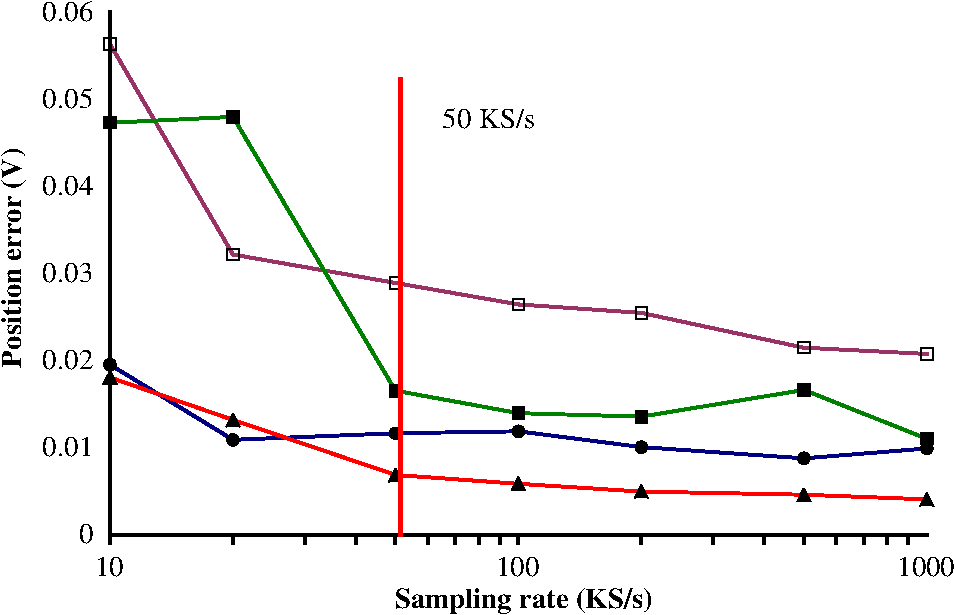
1.IntroductionLaser-scanning microscopy (LSM) is an indispensable imaging tool in biology and medicine.1,2 By eliminating scattered light from out-of-focus planes, LSM offers high spatial resolution images and the capability for “optical sectioning” of cells and tissues.3 Real-time LSM systems applied to in vivo and noninvasive skin imaging have been reported.4,5 Among various laser-beam-scanning technologies, acousto-optical deflector, rotating polygon mirrors, and resonant galvanometers are able to achieve video-rate scanning.6 The galvanometric scanner, also known as galvo, is a popular optical scanning device based on permanent magnetic motor principles and a resonant galvo typically has a maximal rotating frequency of 8 KHz.7 Besides its applications in real-time and in vivo tissue imaging, LSM is also useful in examining ex vivo samples for potential disease biomarkers. To explicitly characterize tissue, cellular morphology needs to be correlated with the underlying chemical composition, which requires spectra (fluorescence and/or Raman) to be acquired by allowing the excitation laser to dwell at focus points for a specified time period. A resonant galvanometer cannot be driven at frequencies other than its frequency and does not allow random access to individual scanning pixels.6 A closed-loop linear galvanometer allows arbitrary scan patterns with high accuracy at variable scanning speeds. Therefore, a linear galvanometer excels in providing precise control of scan angle and dwell time despite its slow speed. As a mechanical device, the inertia of a galvo rotor means a constant response time, which translates into position errors between commanded and actual scanner positions during continuous scanning. At a fast image update rate, the position errors lead to image distortions that complicate calibrating/focusing of the microscopy. Unlike a resonant scanner that comes with line scan synchronization trigger signals, a linear galvo scanner needs to eliminate the effect of inertia differently.8 One proposed method is to use the actual mirror position to synchronize data acquisition (DAQ) and limit the scanning range within the central linear scanning range.9 This method circumvents the effect of response time and also avoids the distortion due to the galvo’s limited bandwidth. However, its performance strongly depends on a proper image reconstruction algorithm. Another possible method is to shift pixels according to the time delay either in real time or after image acquisition.10 Shifting pixels always results in imprecise timing of the delayed response. In this paper, we discuss the scanning parameters that affect the reconstructed image quality at a moderate image update rate. We demonstrate a new method that offers precise and real-time error correction between the driving command and the actual galvo position. 2.Materials and Methods2.1.System SetupThe schematic setup for the LSM is shown in Fig. 1. A tunable femtosecond Ti:sapphire laser (720–950 nm, 80 MHz repetition rate, Chameleon, Coherent Inc., Santa Clara, California) provided excitation light. A polarizing beamsplitter cube deflected confocal reflectance light to the avalanche photodiode (APD) detector. A long-pass dichroic mirror (DM) directed the two-photon excited fluorescence (TPEF) signal to a photomultiplier tube (PMT). The microscopic objective (MO) (Olympus America Inc., Center Valley, Pennsylvania) was a water immersion type. The optical scanner was a small beam diameter scanning galvanometer mirrors system (GVS202, Thorlabs, Newton, New Jersey). The motor had a maximum angular scanning range of 12.5 deg, a repeatability of , and a step response time of . Within a small scan angle (), the maximum input frequency could go up to 1 KHz. The galvo driving board accepted external command input from a DAQ card. The driving board provided diagnostic pins with voltage signals proportional to the position of the scanner mirror. A multifunction DAQ card (NI USB-6363, National Instruments, Austin, Texas) drove the galvo, acquired APD and PMT output, and detected the galvo mirror position diagnostic signals. 2.2.Galvo Driving Patterns and Image ReconstructionSinusoidal and triangular driving patterns with variable amplitude, frequency, and sampling rate were tested. The symmetry of both sinusoidal and triangular driving patterns allowed bidirectional scanning within each cycle, allowing better utilization of laser scanning time.11 Only image lines belonging to the same scanning direction were used to reconstruct the image in order to minimize line shift distortion.10 2.3.Computing Program and SoftwareA program was developed using LabVIEW (National Instruments, Austin, Texas). Synchronization of galvo driving signal and acquisition of detector and driving board diagnostic outputs were achieved by sharing the start trigger signal of the analog output. The voltage output from detectors was acquired as a linear array with a length equivalent to the total number of pixels. Once each cycle of the scan was completed, the linear array was folded into images with the correct dimensions. Raw image data were further analyzed in MATLAB® (Mathworks, Natick, Massachusetts). 2.4.Resolution Target and Cell CultureA positive combined resolution and distortion test target (, R1L1S1P, Thorlabs, Newton, New Jersey) was used. The concentric sector star pattern was scanned to detect image distortions and to verify the effectiveness of correction. Hut78 suspension T lymphoma cells cultured in RPMI-1640 medium (R0883, Sigma-Aldrich Canada, Oakville, Ontario) and stained with FM1-43 fluorescence dye were imaged. The cell culture was kept in the dark before imaging. 3.Results and Discussion3.1.Driving Pattern, Frequency, and Position ErrorTo find out the position error varying pattern versus the driving frequency, the galvo mirror driving signal frequency changed from 100 Hz to 1 KHz at an interval of 100 Hz. Sampling rates ranged from 100 to . Results from the sinusoidal driving waveform showed that the position error varying pattern closely resembled the corresponding galvo mirror driving pattern, suggesting excellent linearity. The response time translated into a phase shift between commanded and actual movement patterns, thus it was possible to correct position error through phase compensation. The amplitudes for position error pattern with sinusoidal driving waveform were proportional to the sine values of the phase shift. The position errors for a triangular driving pattern were trapezoids. To find out the achievable minimum position error obviating the effect of response time (), a sequential step scan mode was implemented. Under this mode, the galvo scanner stayed for after each position command, then the actual position voltage signal was measured. The resulting position error was a combination of position error and the readout error of the DAQ card (). Calculated from 200 readings, the achievable minimum position error had an average of 0.68 mV and a maximum of 2.2 mV. 3.2.Position Error CorrectionFor a specific driving frequency and sampling rate combination, the phase shift remained fairly constant. Therefore, it was possible to counteract the phase shift effect by introducing an initial phase to the driving waveform. An advanced phase amount caused the galvo mirror to respond ahead of the commanded scanning position. Except for the initial starting period during which the galvo accelerated to follow the command voltage, the actual galvo mirror position eventually coincided with the commanded position after the galvo managed to synchronize with the input voltage. The initial phase shift is calculated using where (degrees) is the manually introduced phase shift, (s) is the response time, and (Hz) is the driving frequency.The galvo mirror inertia also prevented the galvo from following abrupt changes when the scanning direction reversed. The consequence was a reduced duty cycle. To compensate for the reduced scanning range, the driving voltages could be amplified with a factor. For a sinusoidal driving pattern, the positional error for the galvo mirror could be effectively lowered to manageable levels that were comparable to that of the sequential step scan mode. The triangular driving pattern suffered from a reduced duty cycle more severely when compared to the sinusoidal waveform. As the driving frequency went up from 200 to 500 Hz, the duty cycle went down rapidly from 85.4% to 65.8%. 3.3.UnderSampling of Driving Voltage PatternWhen galvo mirrors continuously scanned at a moderate rate, the position error suggested that precisely updating the command voltage at every scanning position did not necessarily translate into a more accurate galvo mirror position. Instead, it makes more sense to update the driving signal less frequently because the nonresonant galvo scanner has a rather limited bandwidth. For a resolution of , i.e., 500 command positions per image line, the sampling rates for the galvo driving signal were set at between and to find out whether lower sampling rates impacted position error significantly. In Fig. 2, both the average and the maximum position errors did not significantly decrease once the sampling rate for the galvo driving voltage went beyond , i.e., 50 voltage updates per image line. It was also evident that the triangular driving waveform generally resulted in a lower position error compared to the sinusoidal driving waveform. The average and maximum position errors for the triangular driving waveform were below 1.4 and 3.3 mV, respectively. The average and maximum position errors for the sinusoidal driving pattern were 2.3 and 5.8 mV, which almost doubled those of the triangular waveform. Therefore, the triangular driving waveform rendered a more accurate scanning position within the linear scanning range, which was important for spectral mapping. 3.4.Effect on Scanned Target ImagesThe scanned images of a sector star pattern in Fig. 3 demonstrate the phase shift effect and its correction. Essentially, the phase shift created a folding effect along the slow axis direction [Figs. 3(a) and 3(d)]. For a sinusoidal driving waveform, the effect created difficulty in subsequent image correction using a linearization technique.12 The image in Fig. 3(b) was further distorted due to the varying scanning speed using a sinusoidal waveform. For a triangular driving waveform, the folding effect could be virtually eliminated after phase compensation [Fig. 3(e)]. However, there still existed a certain amount of image distortions, e.g., elongation, along the edges due to the reduced duty cycle. An effective way to compensate for the reduced duty cycle was to scan a wider range by increasing the driving pattern’s amplitude and the number of sampling points accordingly. After the image was acquired with 1.5 times scanning range along the fast axis, the image was cropped to exclude regions displaying significant geometrical distortion due to the reduced duty cycle [Fig. 3(f)]. The resulting image was distortion free and there was no need for image linearization. It is also important to note that the triangular scanning mode preserved image geometry with high fidelity, whereas image restoration in the sinusoidal scanning resulted in a noticeable sawtooth pattern along the straight edges [Fig. 3(c)]. Fig. 3Distortion correction of a section star pattern image. For a sinusoidal driving waveform, image (a) without and (b) with phase shift corrected, (c) image corrected with pixel relocation algorithm. For a triangular driving waveform, image (d) without and (e) with phase shift corrected, (f) image acquired with increased scanning range showing the region of interest. (Image resolution acquired at 2 fps).  3.5.Live Cell ImagingReflectance confocal and TPEF images of live T lymphoma cells were taken. The confocal images [Figs. 4(a) and 4(c)] clearly show the cell membrane and cytoplasm. In the TPEF images, the cell membrane and nucleus membrane stained with FM1-43 fluorescence dye could be clearly distinguished from the rest of cell by their strong fluorescence. Cell images without phase correction show a folding effect similar to that of the section star target. Without prior knowledge of the individual cell shapes and spatial arrangement in the culture medium, the distortions might be otherwise considered as cells with abnormal morphology, undergoing mitosis, or simply overlapping with each other. 4.ConclusionsWithout adjunct imaging techniques such as white light microscopy within the same system, calibrating a linear galvanometric mirrors-based laser scanning microscope can be challenging at a low image update rate. To drive the galvanometric mirrors at a high frequency, e.g., 500 Hz, the effect of response time of the galvanometric scanner should not be neglected. Previously published correction methods had drawbacks such as imprecise pixel shifting. In this paper, it was found that the error magnitudes could be greatly reduced by compensating for the phase shift due to galvanometric mirror response time. The effective combined hardware and software approaches achieved a position error level comparable to that of the sequential point scanning mode, where the effect of response time was absent. It was also found that an update rate beyond 100 samples per cycle to drive the galvanometric mirror might not be useful in lowering the position error during a high speed scanning. The position error for a sinusoidal driving waveform is generally twice that of a triangular waveform. The image acquired using a triangular driving waveform achieved the best resolution and minimum image distortion. AcknowledgmentsThe authors wish to acknowledge the financial support provided by the Canadian Institutes of Health Research (CIHR) and the Canadian Dermatology Foundation. The authors also wish to thank Dr. Harvey Lui for providing helpful feedbacks to improve the manuscript. W.W. is supported by the CIHR—Skin Research Training Centre (SRTC) and the Engineer-in-Scrubs (EiS) training program at the University of British Columbia. Z.W. is supported through a CIHR-SRTC scholarship. ReferencesW. B. Amos and J. G. White,
“How the confocal laser scanning microscope entered biological research,”
Biol. Cell, 95
(6), 335
–342
(2003). http://dx.doi.org/10.1016/S0248-4900(03)00078-9 BCELDF Google Scholar
M. Oheim et al.,
“Principles of two-photon excitation fluorescence microscopy and other nonlinear imaging approaches,”
Adv. Drug Delivery Rev., 58
(7), 788
–808
(2006). http://dx.doi.org/10.1016/j.addr.2006.07.005 ADDREP 0169-409X Google Scholar
S. W. Paddock,
“Principles and practices of laser scanning confocal microscopy,”
Mol. Biotechnol., 16
(2), 127
–149
(2000). http://dx.doi.org/10.1385/MB:16:2 MLBOEO 1073-6085 Google Scholar
M. Rajadhyaksha et al.,
“In-Vivo Confocal Scanning Laser Microscopy of Human Skin—Melanin Provides Strong Contrast,”
J. Invest. Dermatol., 104
(6), 946
–952
(1995). JIDEAE 0022-202X Google Scholar
A. M. Lee et al.,
“In vivo video rate multiphoton microscopy imaging of human skin,”
Opt. Lett., 36
(15), 2865
–2867
(2011). http://dx.doi.org/10.1364/OL.36.002865 OPLEDP 0146-9592 Google Scholar
R. Y. Tsien and B. J. Bacskai,
“Video-rate confocal microscopy,”
Handbook of Biological Confocal Microscopy, 459
–478 Springer Science+Business Media New York, New York
(1995). Google Scholar
R. P. Aylward,
“Advanced galvanometer‐based optical scanner design,”
Sens. Rev., 23
(3), 216
–222
(2003). http://dx.doi.org/10.1108/02602280310481968 SNRVDY 0260-2288 Google Scholar
N. Callamaras and I. Parker,
“Construction of a confocal microscope for real-time x-y and x-z imaging,”
Cell Calcium, 26
(6), 271
–279
(1999). http://dx.doi.org/10.1054/ceca.1999.0085 CECADV 0143-4160 Google Scholar
T. A. Pologruto, B. L. Sabatini and K. Svoboda,
“ScanImage: flexible software for operating laser scanning microscopes,”
Biomed. Eng. Online, 2
(13),
(2003). http://dx.doi.org/10.1186/1475-925X-2-13 1475-925X Google Scholar
S. Chen et al.,
“Software controlling algorithms for the system performance optimization of confocal laser scanning microscope,”
Biomed. Signal Process., 5
(3), 223
–228
(2010). http://dx.doi.org/10.1016/j.bspc.2010.03.002 1746-8094 Google Scholar
Q. T. Nguyen et al.,
“Construction of a two-photon microscope for video-rate imaging,”
Cell Calcium, 30
(6), 383
–393
(2001). http://dx.doi.org/10.1054/ceca.2001.0246 CECADV 0143-4160 Google Scholar
M. J. Sanderson,
“Acquisition of multiple real-time images for laser scanning microscopy,”
Microsc. Anal., 18
(4), 17
–23
(2004). 0958-1952 Google Scholar
BiographyWenbo Wang is a postdoctoral fellow with BCCRC. His research focuses on developing noninvasive optical imaging systems and spectroscopy techniques for clinical diagnosis. Zhenguo Wu is a doctoral candidate with the interdisciplinary oncology program, University of British Columbia, under the supervision of professor Haishan Zeng and professor Harvey Lui. His research interest includes developing noninvasive multimodality microscopy imaging systems for in vivo human skin evaluation and skin cancer diagnosis. Haishan Zeng is a distinguished scientist with the Imaging Unit – Integrative Oncology Department at BCCRC and a professor of Dermatology, Pathology, and Physics of the University of British Columbia. His PhD was on biophysics from the University of British Columbia. His research focuses on developing optical imaging and spectroscopy techniques for early cancer detection. He has published over 134 referred journal papers, 1 book, 15 book chapters, and has 21 granted patents. |