
|
|
1.IntroductionThe methods of dynamic and static light scattering1–3 allow determining particle sizes and obtaining intensity size distributions (ISDs) in the nanometer range, as well as finding their shape and the molecular weight of biological molecules in a liquid.4–7 The basic advantages of these methods over others, such as electron microscopy, flow cytometry, gel chromatography, and so on, are their relatively low price, noninvasive nature, and the possibility of particle registration in a wide range of sizes (from 1 to 3000 nm) without disrupting sample integrity. Light scattering methods also retain the native chemical nature of the investigated samples, which renders them indispensable for examining native behavior (for example, aggregation of proteins).8,9 Light scattering techniques have been successfully applied to the study of blood serum and plasma samples. These methods give information about sizes, molecular weights, and second virial coefficients of the proteins and their complexes in these liquids. Investigation of such properties of proteins has already led to the development of special methods of diagnostics of various diseases (oncological, cardiovascular, and others).10–13 These methods are more developed for blood serum samples because they are more “clear” than blood plasma due to the absence of fibrin clots. However, investigation of blood plasma can give more information about the health of the donor because it represents the largest and the deepest version of the human proteome.14 It is known that blood plasma contains proteins (other substances, vesicles,15 and microparticles16–18) in a wide range of concentrations and, distinct from serum, the processes of fermentative degradation of fibrinogen into fibrin, peptides, and amino acids19,20 with a subsequent aggregation of the decay products (fibrin),21 take place there. Over time, these processes cause changes in blood plasma composition at the molecular level, but their effect on the particle size distributions obtained by dynamic light scattering (DLS) in blood plasma has not been studied yet. Furthermore, the change in the sizes and concentrations of particles in blood plasma after drawing can alter the picture of the distribution and lead to incorrect diagnosis based on the particle size distribution analysis. It is also important to know the stability of proteins and their aggregates in blood plasma during storage for transfusion. Therefore, a study of changes in the sizes of blood plasma particles over time can give valuable information for both diagnostics of different diseases and preservation of blood plasma for transfusion. In this work, we studied the dynamics of sizes and concentrations of particles (proteins, their aggregates, and microvesicles) in blood plasma samples by means of dynamic and static light scattering methods during 5-h periods, starting at 3 and 25 h after blood drawing. Towards this end, the temporal variations of the ISDs and the total intensity of scattered light were examined within specified time intervals. 2.Theoretical ConsiderationsThe DLS method is based on registration of scattered light intensity fluctuations due to particle concentration fluctuations generated by Brownian motion. The information on the coefficients of translational diffusion of these particles is reflected in the correlation function of the electric field of scattered light: where * indicates conjugation.The function is related through the Siegert relation22 to the experimentally obtained self-correlated function of the scattered light intensity: where and are the scattered light intensities at the instants of time and , and is the square of the average scattered light intensity over the entire storage time.Obtaining hydrodynamic radii of particles or the ISDs (in the case of multicomponent suspension) from the electric field correlation function is, generally speaking, a mathematically incorrect task. However, various programs, including the DynaLS program (Alango Ltd.)23 applied by us, have been developed that employ the histogram technique and Tikhonov regularization, allowing this problem to be solved. The program permits us to obtain the decomposition of the field correlation function in the exponents with powers , where is the correlation times or the relaxation times of fluctuations of concentration of particles of different hydrodynamic radii with diffusion coefficients : where is the coefficient from the Siegert relation determined by specific features of the setup geometry, is the noise of the autocorrelation intensity function, and is the amplitude of separate exponents that represent a histogram fraction in the ISD, in which particle sizes correspond to the characteristic correlation time : where is the hydrodynamic radius of the particles, and is the wave vector of scattering Here, is the refractive index of the particles, is the laser wavelength (in our case, 633 nm), and is the angle at which scattering is observed.The diffusion coefficient is assumed here to be related to the particle radius by the Stokes–Einstein relation.24,25 3.Methods and Materials3.1.Experimental SetupThe DLS investigations were conducted using the traditional setup consisting of a He–Ne laser (wavelength 633 nm, power 5 to 10 mV), an optical system ensuring spatial coherence of the recorded light, a goniometer to acquire measurements at various angles, a special photomultiplier, a Photocor-FCm correlator operating in the logarithmic regime of function accumulation (“Multiple tau”), and a PC with Photocor-FCm and DynaLS programs. For a more detailed description of the setup, see Ref. 26. To obtain autocorrelation functions of scattered light intensity, the cyclic regime of the correlator operation was chosen, which allowed accumulation of autocorrelation functions during a series of short time intervals (120 to 140 s) whose duration and number can be set manually. On cycle completion, functions coincident within given limits were summed up and averaged. The function coincidence criterion was also defined by the operator and so was the number of repetitions (the number of cycles) of this procedure. Such a technique for function accumulation avoided external occasional factors that could arise during accumulation (for example, dust particles in a laser beam) and obtaining autocorrelation functions virtually continuously during a long period. 3.2.MaterialsFresh blood taken from the donor’s ulnar vein via 10-mL syringe was used in the work. To slow down the blood coagulation, 1 mL of heparin (anticoagulant) was preliminarily added to the syringe. The blood plasma samples were obtained by centrifuging whole blood for 15 min in the lab centrifuge CLC-1 at a velocity of and further separating the supernatant (plasma) from blood corpuscles. Blood plasma samples of 3 to 4 mL in volume were placed in a dust-free cylindrical cuvette 15 mm in diameter and an immersion cuvette 34 mm in diameter to ease the setup adjustment. The measurements started in about 60 to 80 min, which was the minimum possible time after blood drawing. 4.Results and Discussion4.1.Obtaining the ISDs and Verifying the Correspondence of the Correlation Times in the Distributions to the Diffusion Modes of MotionTo determine the sizes of particles in the human blood plasma, the autocorrelation functions of scattered light intensity were obtained, and an ISD was found with the help of the DynaLS program. Figure 1 presents the results of the correlation function processing by the DynaLS program including the ISD in logarithmic scale (the upper portion of Fig. 1) and the table with the results of processing in numerical form (the lower portion of the figure). One can see that the ISD in the blood plasma sample is multimodal, i.e., it contains several peaks characterized by peak-mean hydrodynamic radii (“Mean” column in the table in Fig. 1) and the intensity fractions (“Area” column in the table in Fig. 1) that fall to their share. Fig. 1Result of correlation function processing using DynaLS program: upper portion shows ISD in logarithmic scale in blood plasma; lower portion is the table with parameters characterizing distribution: peak number, intensity fraction (area), peak-mean hydrodynamic radius (mean), peak position (position), and root-mean square deviation (STD). 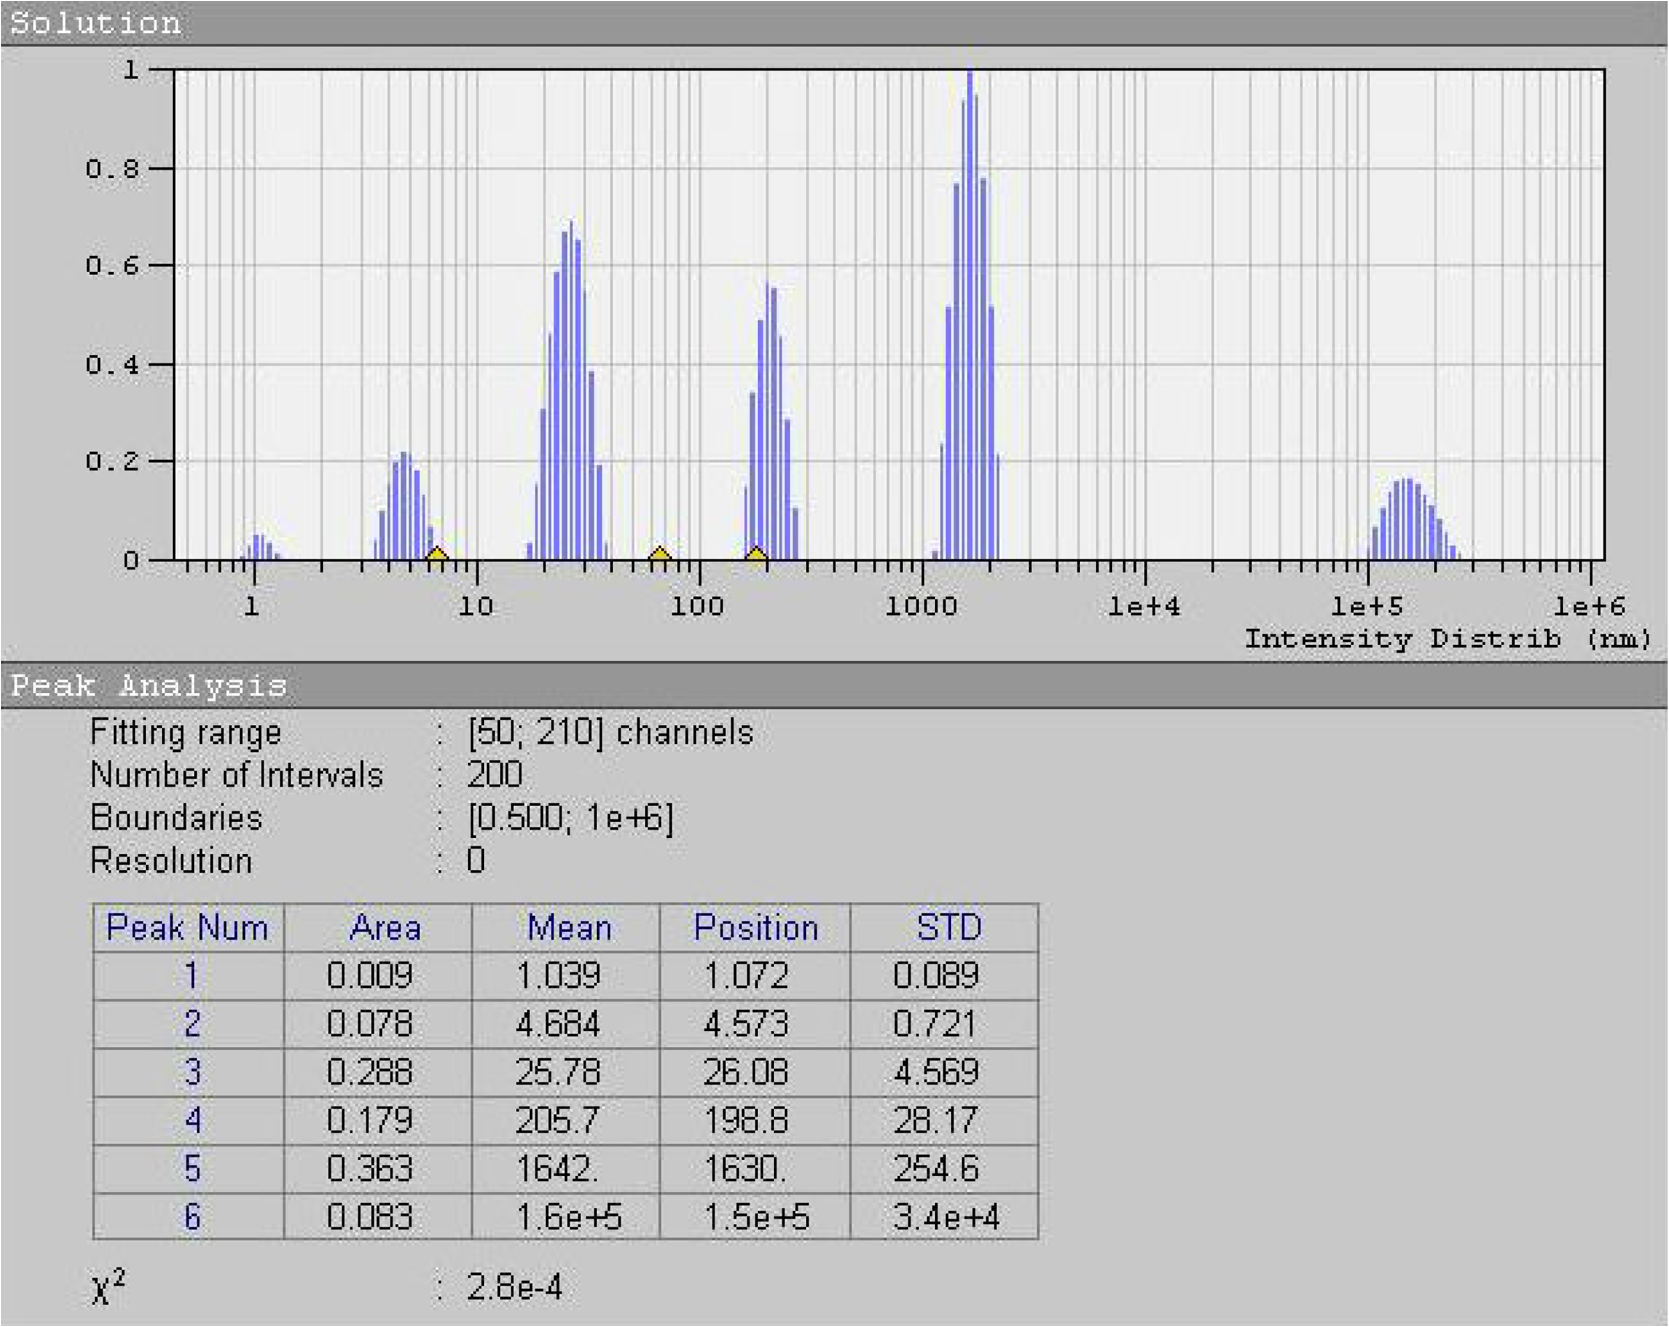 The dependences of on the scattering angle were obtained to verify the correspondence of the correlation times obtained in the distributions to the diffusion modes of motion. It is a known fact that for diffusion modes of motion, the relation holds true; hence, the measured diffusion coefficients and radii of particles remain unaltered with the change of the angle. For all of the investigated blood plasma samples, the mean sizes for each of the characteristic peaks in the ISD in the range from 1 to 3000 nm did not change with varying angle and were, therefore, due to the diffusion modes of motion. Thus, in the indicated range, the obtained dimensional characteristics corresponded to real particles in a liquid with different diffusion coefficients. For further studies of the dynamics of particle sizes in the blood plasma after the blood drawing, 40 deg was chosen as the main angle. 4.2.Obtaining the Histograms of Particle Size Registrations. Stability of Statistically Confident Particle Sizes in Blood Plasma over the Course of 30 hThe first results that we obtained in the examination of particle size changes in the blood plasma in large time intervals (2 h and more) are presented in Refs. 27 and 28. It is shown that in the blood plasma samples, the particle sizes averaged over several measurements varied with time, the variations being of quasiperiodic oscillatory character. To establish whether these variations were random or regular, the ISDs were examined in the minimum time intervals between measurements (2 min each). The distributions acquired ended up being unstable and different from one another in terms of the number of separated peaks, particle sizes, and in fraction of intensity falling on each of the peaks (Fig. 2). Fig. 2Intensity size distributions obtained for one blood plasma sample in equal time intervals (2 min).  The increase in the time of accumulation of the autocorrelation function of scattered light intensity (more than 300 s) did not yield a result unchanged from measurement to measurement. Hence, standard statistical data processing for the particle sizes determination by averaging over several measurements failed to hold in the blood plasma studies. We surmounted this obstacle by accumulating a large array of radii of peaks of ISDs and counting the number of registrations of each of the obtained particle sizes. We obtained the array of ISDs at different time during two 5-h periods, starting at 3 and 25 h after blood drawing. This array is presented in Fig. 3(b) in coordinates (the peak-mean size, nm, log-scale)– (the time of registration, h). Fig. 3(a) Log-scale histogram of particle size registrations; (b) dependence of particle sizes on time in blood plasma sample obtained in 5-h periods, starting at 3 and 25 h after blood drawing. 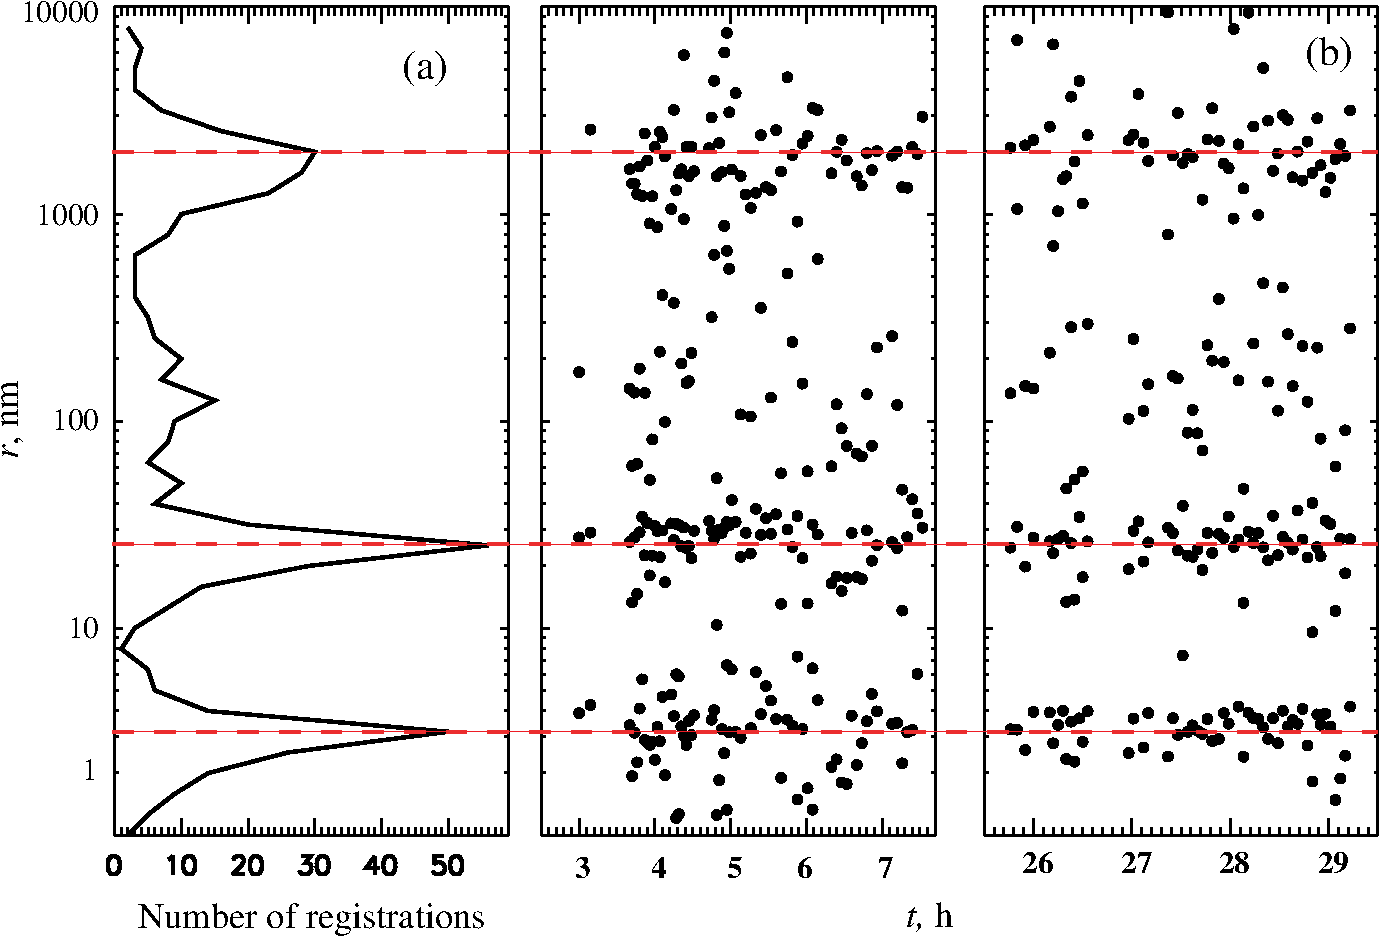 The experimental points of the array [Fig. 3(b)] arrange groups (crowding around certain mean values) in the range from 1 to 10 nm, from 10 to 100 nm, and from 1000 to 2000 nm. None of these groups show a tendency to increase or decrease the particle sizes with time, which suggests that the scatter of size values around the mean is random. Therefore, for further data processing, the number of particle size registrations was counted within the chosen step (bin), which was in our case 0.1 of the size in logarithm scale. Figure 3(a) illustrates the log-scale histogram of particle size registrations after smoothing. It has two distinct peaks in the range of 1 to 100 nm sizes and one peak in the region of large sizes (above 1000 nm). Several less distinct peaks are observed in the interval from 100 to 600 nm, which reveals a large spread of sizes registered in this range. For the given histogram , particle sizes corresponding to the positions of the maxima of histogram peaks were determined: for the first peak, for the second, for the third, and for the fourth peak. These particle sizes corresponding to the maxima of histogram peaks we consider as statistically confident sizes. The basis of the approach to data processing is as follows. When the array is partitioned to smaller subarrays (less than 20 ISDs), many subpeaks occur in the histogram, whereas for a larger number of data in the array (more than 40 ISDs), the histogram shows distinct peaks with maxima corresponding to those depicted in Fig. 3(a). Having divided the total amount of experimental points of Fig. 3(b) into two parts according to the interval of data acquisition (3 to 8 h and 25 to 30 h) and having processed them in the aforementioned manner, we obtained the corresponding log-scale histograms for these intervals. For convenience of comparison, they were normalized to the peak with the maximum number of registrations . Figure 4 demonstrates such histograms for 3 to 8 h (solid line) and for 25 to 30 h interval (dashed line) after blood drawing. Obviously, the particle sizes corresponding to the positions of the histogram peaks repeat each other with accuracy the half-height peak width. Fig. 4Normalized log-scale histograms of particle size registrations obtained for 3 to 8 h (solid line) and for 25 to 30 h interval (dashed line) after blood drawing.  The configurations of the histograms presented in Fig. 4 are similar. The difference only lies in the change in the first-to-second peak amplitude ratio and in the number of indistinct intermediate peaks in the range from 100 to 600 nm. The change in the amplitude ratio of the two most distinct peaks is due to the increase on the second day of the number of minimum-size particle registrations, which can be explained by the increase in their number as a result of large-particle degradation and smaller-particle appearance, i.e., redistribution of particle material between groups of their sizes in blood plasma. Tables 1 and 2 give the numerical information about the histograms presented in Fig. 4, namely, the positions of the peak maxima and peak half-height widths as well as the peak-mean sizes and the root-mean square deviation for them (for the first and second day of measurements). Comparison of the characteristics showed that the positions of the peak maxima remain unchanged at 30 h after blood drawing, which testifies to the stability of the particle sizes registered in spite of the processes proceeding in the investigated blood plasma sample. Table 1Characteristics of log-scale histograms of particle size registrations in blood plasma sample obtained for 3 to 8 h interval.
Table 2Characteristics of log-scale histograms of particle size registrations in a blood plasma sample obtained for 25 to 30 h interval.
4.3.Estimation of Particle Concentrations from Data About Total Scattered Light Intensity. Particle Concentration-to-Size RelationshipAlong with the ISDs, we obtained the total scattered light intensity. Figure 5 elucidates the scattered light intensity at the scattering angle as a function of the elapsed time for plasma sample. The mean value of the intensity was lowered by 30% 25 h after blood drawing. With unaltered particle sizes, such a changing of the total intensity could be due to the change in the concentrations of particles pertaining to different groups of sizes. Fig. 5Temporal variations of total scattered light intensity for blood plasma sample obtained in 5-h periods, starting at 3 and 25 h after blood drawing. 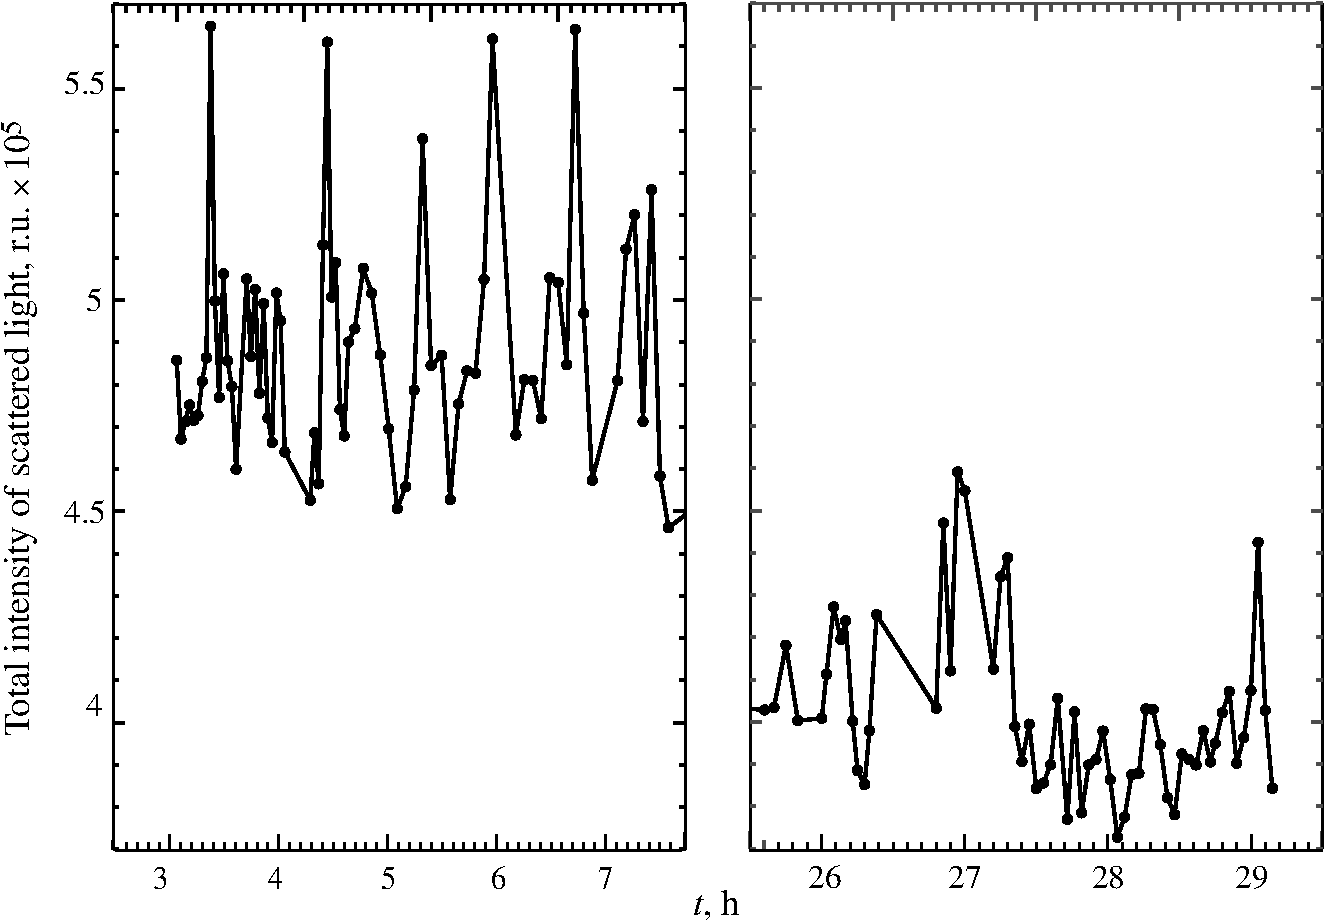 The concentration of particles for each of the registered sizes was estimated by the scattered light intensity under the assumption that the light is scattered independently by each optically “soft”29 particle with a certain hydrodynamic radius. Under this condition, the total intensity registered in experiment is the sum of contributions of the intensity of light scattered by particles of each size [we assume here also that the portion of intensity () attributable to a specific particle size is a delta function]. Then, according to the Rayleigh–Gans–Debye (RGD) approximation, the concentration of particles of each size is directly proportional to the fraction of the intensity of light scattered by particles with a given radius and inversely proportional to the form-factor of particles and the sixth power of their radius : where is the total light intensity registered in experiment, is the fraction of intensity of light scattered by particles with a given hydrodynamic radius (recalculated from the logarithmic scale of sizes), is the refractive index of particle (for all particle sizes, the same refractive index of 1.34 was used), is the refractive index of water, and is the form-factor of particles for spherical30 and cylindrical31 shapes. We determined unknown parameters (such as quantum efficiency of the photomultiplier cathode , scattering volume , and distance between the point of observation and scattering volume ), by comparing of our signal with the light scattering intensity signal of toluene, the scattering coefficient of which is known.32With allowance for all the coefficients of relation,6 the concentrations were defined as the number of particles of each size in unit volume (). Each obtained concentration was matched to the corresponding size (hydrodynamic radius in the case of spherical form or length in the case of cylindrical form). Figure 6(a) presents the results of such matching for the spherical and cylindrical shape of particles in the entire range of registered particle sizes in the form of log–log plot of the particle concentration-to-sizes relationship. It is seen that for sizes from 1 to 300 nm, the relation between the concentrations of particles and their sizes has a monotonically decreasing character close to the linear dependence typical of both models of particle shapes. Figure 6(b) presents the plot of relationship of particle concentrations and their sizes from 1 to 300 nm, where the obtained concentrations coincide for both models. The plot was approximated by the linear dependence with the slope in the range from 1 to 25 nm [Fig. 6(b), dashed line] and in the range from 25 to 300 nm [Fig. 6(b), dash-dot line]. Fig. 6Log–log plot of particle concentrations to their hydrodynamic radii relationship obtained in approximation of spherical (black points) and cylindrical (gray points) shape of particles: (a) in entire range of registered particle size; (b) in range from 1 to 300 nm where points coincide for two models; approximation of plot with two straight lines. 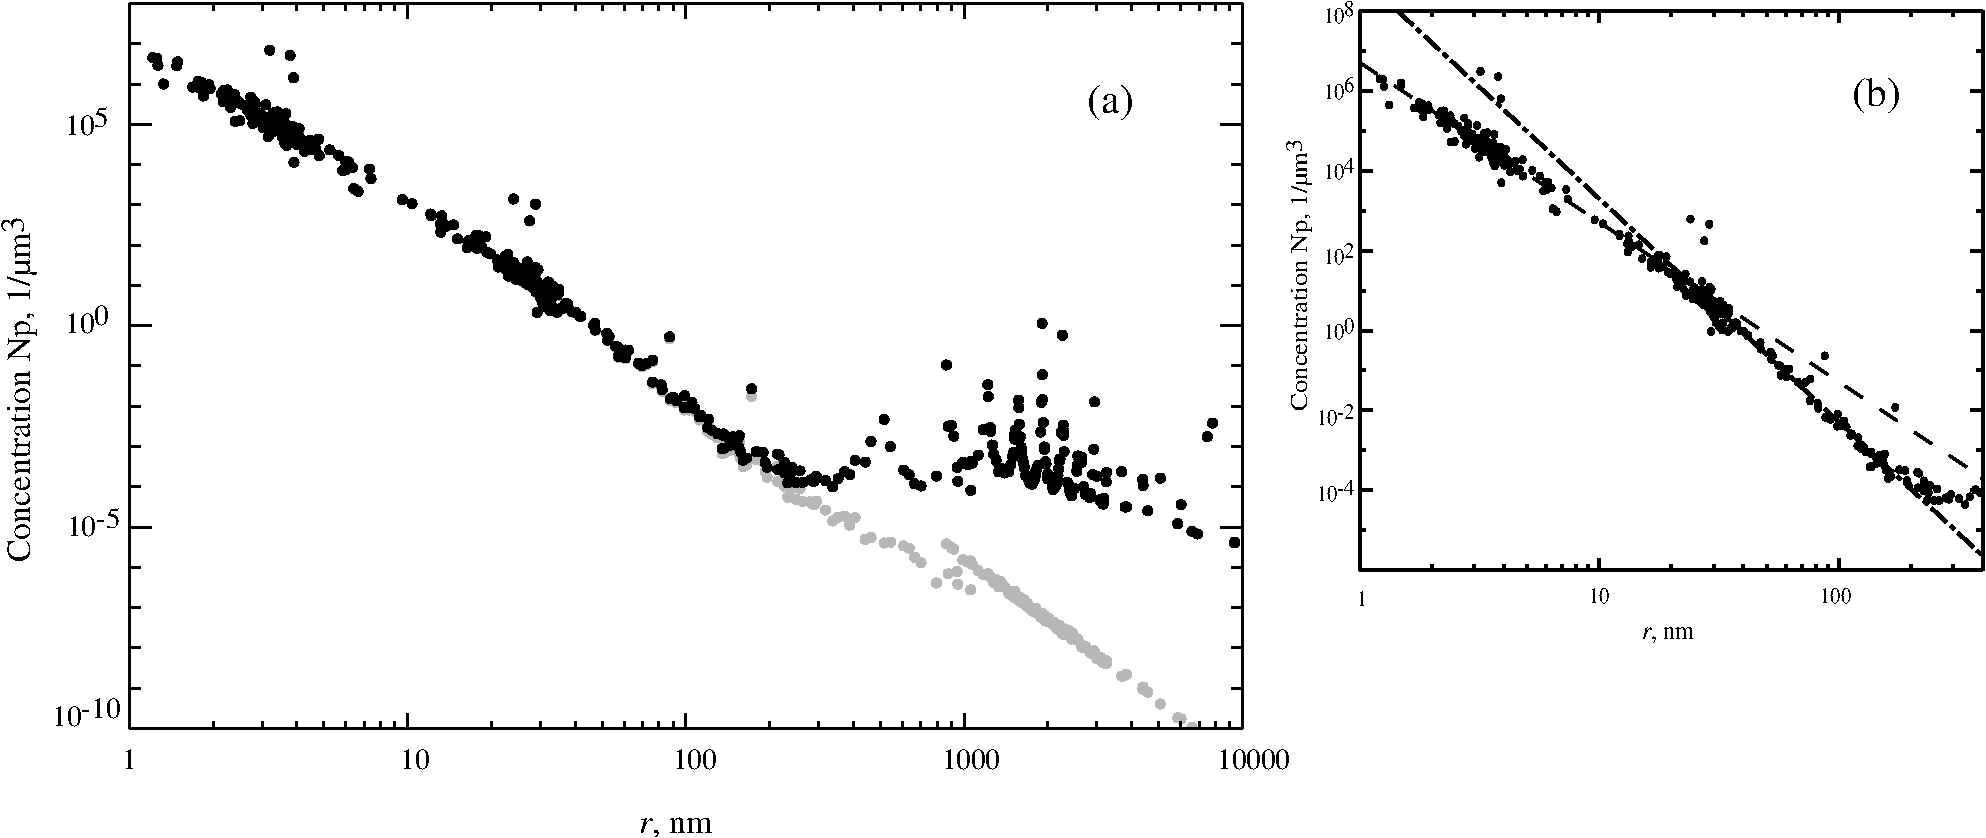 For the spherical model of particle of sizes above 300 nm, such monotonic behavior is not obverved. It may be due either to the real particles of these sizes having shapes different from spheres or the fact that the true particles whose sizes do not fall within the RGD approximation minima31 nevertheless can be registered with sizes that fall in the regions of one of zeros due to the instability of decomposition of the autocorrelation function by the exponents. For cylindrical particles in this range of sizes, the relation between the logarithm of particle concentrations and their radii is close to linear. 4.4.DiscussionWe have shown that in blood plasma study by the DLS method, the obtained ISDs are unstable from one measurement to another. An increase in the autocorrelation function accumulation time did not yield results that are stable over time. Such instability of distributions can be explained by the ill-posed mathematical problem of correlation function decomposition in exponents because small perturbations (noise) in it can lead to a change in the gathered distribution in the case of a multicomponent system. The question of the possible influence of processes of protein degradation and particle aggregation in blood plasma samples upon the true particle sizes in blood plasma needs additional research. Such studies must clearly be carried out in solutions with known rates of variation of the peptide–protein composition. Gathering a large array of experimental data and its processing by the previously discussed method allowed us to eliminate the instabilities of separate distributions and to obtain the log-scale histogram of particle size registrations . We found that the positions of peak maxima (statistically confident sizes) appeared to be stable within 30 h after blood drawing. From a biophysical point of view, such stability of the blood plasma particle sizes can be explained by the fact that although the degradation process affects the sizes of separate protein molecules, they fail to alter the registered sizes of particles. The decrease in the total scattered light intensity by 30% on the second day of measurements, the decrease in the concentrations of largest particles from to (for the cylindrical model), and the increase in the concentrations of smaller particles from to (for the spherical and cylindrical models) testify to material redistribution between the registered sizes of particles. The increase in the number of registrations of smaller-size particles and the decrease in the number of registrations of larger-size particles 25 h after the first measurements (Fig. 4) also provide evidence of particle material redistribution. Using the proposed approach to obtain and process the data of blood plasma research by the DLS method, we could estimate particle concentrations in each of the registered sizes. The particle concentrations and sizes turned out to be related, the relation being expressed by the empirical formula , where . This relation with the given value holds for the spherical and cylindrical models of particles in the range from 1 to 25 nm with a tendency toward the straight-line slope increase in the range of 25 to 300 nm. Such a form of the particle concentration-to-size relationship can be explained by the fact that the shifts in sizes in the ISDs are accompanied by proportional changes of the area of the peaks in them. Note that the previously described decrease in the number of large particles and the increase in the number of small particles leading to a 30% change in intensity within 25 h are insignificant on the scale of the diagram of Fig. 5. The change in the slope of the straight lines in the concentration-to-size relationship plot can be due to the fact that to estimate the concentrations of particles of all the registered sizes, we chose the same refractive index . However, blood plasma particles of different sizes can differ in composition and structure; thus, the refractive index of different particles can decrease in accordance with enlarging aggregate. Therefore, the differences in the refractive indices of blood plasma particles should be analyzed elsewhere. 5.ConclusionsThe proposed new method of blood plasma examination by the DLS method based on data array formation and calculation of the number of particle size registrations rendered it possible to find statistically confident blood plasma particle sizes that appeared to be stable within 30 h after drawing human blood. The method helped to reveal the relation between the blood plasma particle sizes and their concentrations, as well as the particle material redistribution with time towards an increase of small particle numbers and a decrease of large particle numbers, and the stability of statistically confident sizes despite protein degradation and particle aggregation. The proposed approach widens the utility of the DLS method in the study of various liquid systems with multimodal particle size distributions, excluding instability of the results of individual measurements. ReferencesR. Pecora and B. J. Berne, Dynamic Light Scattering: With Applications to Chemistry, Biology, and Physics, Wiley, New York
(1976). Google Scholar
B. J. Pecora, Dynamic Light Scattering: Applications of Photon Correlation Spectroscopy, Plenum Press, New York and London
(1985). Google Scholar
N. A. Clark, J. H. Lunachek and G. B. Benedek,
“A study of Brownian motion using light scattering,”
Am. J. Phys., 38
(5), 575
–585
(1970). http://dx.doi.org/10.1119/1.1976408 AJPIAS 0002-9505 Google Scholar
R. Murphy,
“Static and dynamic light scattering of biological macromolecules: what can we learn?,”
Curr. Opin. Biotechnol., 8
(1), 25
–30
(1997). http://dx.doi.org/10.1016/S0958-1669(97)80153-X CUOBE3 0958-1669 Google Scholar
D. Arzenšek,
“Dynamic light scattering and application to proteins in solutions,”
1
–18
(2010). Google Scholar
K. Ahrer et al.,
“Analysis of aggregates of human immunoglobulin G using size-exclusion chromatography, static and dynamic light scattering,”
J. Chromatogr. A, 1009
(1–2), 89
–96
(2003). http://dx.doi.org/10.1016/S0021-9673(03)00433-3 JCRAEY 0021-9673 Google Scholar
W. Burchard,
“Static and dynamic light scattering from branched polymers and biopolymers,”
Adv. Polym. Sci., 48 1
–124
(1983). http://dx.doi.org/10.1007/3-540-12030-0 APSIDK 0065-3195 Google Scholar
N. V. Artemova et al.,
“Acceleration of protein aggregation by amphiphilic peptides: transformation of supramolecular structure of the aggregates,”
Biotechnol. Prog., 27
(2), 359
–368
(2011). http://dx.doi.org/10.1002/btpr.574 BIPRET 8756-7938 Google Scholar
N. V. Artemova et al.,
“Opioid peptides derived from food proteins suppress aggregation and promote reactivation of partly unfolded stressed proteins,”
Peptides, 31 332
–338
(2010). http://dx.doi.org/10.1016/j.peptides.2009.11.025 PPTDD5 0196-9781 Google Scholar
S. G. Alekseev et al.,
“Multiparametrical testing of blood proteins solutions with diagnostic purpose,”
Proc. SPIE, 5973 597301
(2005). http://dx.doi.org/10.1117/12.639939 PSISDG 0277-786X Google Scholar
I. M. Papok et al.,
“Using the dynamic light-scattering method for the analysis of a blood-serum model solution,”
Moscow Univ. Phys. Bull., 67
(5), 452
–456
(2012). http://dx.doi.org/10.3103/S0027134912050104 MUPBAC 0027-1349 Google Scholar
Y. M. Petrusevich and G. P. Petrova,
“The method of light scattering measurement in tumor diagnostics,”
Proc. SPIE, 2728 2
–9
(1996). http://dx.doi.org/10.1117/12.229473 PSISDG 0277-786X Google Scholar
N. L. Anderson,
“The human plasma proteome: history, character, and diagnostic prospects,”
Mol. Cell. Proteomics, 1
(11), 845
–867
(2002). http://dx.doi.org/10.1074/mcp.A300001-MCP200 MCPOBS 1535-9476 Google Scholar
E. van der Pol et al.,
“Classification, functions, and clinical relevance of extracellular vesicles,”
Pharmacol. Rev., 64
(3), 676
–705
(2012). http://dx.doi.org/10.1124/pr.112.005983 PAREAQ 0031-6997 Google Scholar
B. A. Ashcroft et al.,
“Determination of the size distribution of blood microparticles directly in plasma using atomic force microscopy and microfluidics,”
Biomed. Microdevices, 14
(4), 641
–649
(2012). http://dx.doi.org/10.1007/s10544-012-9642-y BMICFC 1387-2176 Google Scholar
B. György et al.,
“Detection and isolation of cell-derived microparticles are compromised by protein complexes resulting from shared biophysical parameters,”
Blood, 117
(4), 39
–48
(2011). http://dx.doi.org/10.1182/blood-2010-09-307595 BLOOAW 0006-4971 Google Scholar
A. S. Lawrie et al.,
“Microparticle sizing by dynamic light scattering in fresh-frozen plasma,”
Vox Sang., 96
(3), 206
–212
(2009). http://dx.doi.org/10.1111/vox.2009.96.issue-3 VOSAAD 0042-9007 Google Scholar
J. Yi et al.,
“Intrinsic peptidase activity causes a sequential multi-step reaction (SMSR) in digestion of human plasma peptides research articles,”
J. Proteome Res., 7 5112
–5118
(2008). http://dx.doi.org/10.1021/pr800396c Google Scholar
J. Yi, C. Kim and C. A. Gelfand,
“Inhibition of intrinsic proteolytic activities moderates preanalytical variability and instability of human plasma research articles,”
J. Proteome Res., 6 1768
–1781
(2007). http://dx.doi.org/10.1021/pr060550h JPROBS 1535-3893 Google Scholar
P. N. Walsh and S. S. Ahmad,
“Proteases in blood clotting,”
Essays Biochem., 38 95
–111
(2002). http://dx.doi.org/10.1016/B978-0-12-378630-2.00020-7 ESBIAV 0071-1365 Google Scholar
H. Cummins and E. R. Pike, Photon Correlation and Light Beating Spectroscopy, 504 Plenum Press, New York
(1974). Google Scholar
“Software for Particle Size Distribution Analysis in Photon Correlation Spectroscopy,”
(2002) http://www.photocor.com/download/dynals/dynals-white-paper.htm ( March ). 2002). Google Scholar
M. Smoluchowski,
“Zur kinetischen Theorie der Brownschen Molekularbewegung und der Suspensionen,”
Ann. Phys., 326
(14), 756
–780
(1906). http://dx.doi.org/10.1002/(ISSN)1521-3889 ANPYA2 0003-3804 Google Scholar
A. Einstein,
“Zur Theorie der Brownschen Bewegung,”
Ann. Phys., 324
(2), 371
–381
(1906). http://dx.doi.org/10.1002/(ISSN)1521-3889 ANPYA2 0003-3804 Google Scholar
K. V. Kovalenko et al.,
“Correlation spectroscopy measurements of particle size using an optical fiber probe,”
Bull. Lebedev Phys. Inst., 36
(4), 95
–103
(2009). http://dx.doi.org/10.3103/S1068335609040010 BLPIEN Google Scholar
M. N. Maslova, L. L. Chaykov and A. R. Zaritsky,
“The usage of proteolitic enzymes inhibitors in studies of the blood plasma particle size distribution by the dynamic light scattering,”
Biophys. J., 104
(2), 577a
(2013). http://dx.doi.org/10.1016/j.bpj.2012.11.3203 BIOJAU 0006-3495 Google Scholar
M. Maslova, A. Zaritskiy and L. Chaykov,
“The blood plasma particles sizes oscillations observed by dynamic light scattering,”
Biophys. J., 106
(2), 457a
–458a
(2014). http://dx.doi.org/10.1016/j.bpj.2012.11.3203 BIOJAU 0006-3495 Google Scholar
P. W. Barber and D. S. Wang,
“Rayleigh-Gans-Debye applicability to scattering by nonspherical particles,”
Appl. Opt., 17
(5), 797
–803
(1978). http://dx.doi.org/10.1364/AO.17.000797 APOPAI 0003-6935 Google Scholar
J. W. S. Rayleigh, Proc. Roy. Soc. London, Ser. A, 84 25
–38
(1911). http://dx.doi.org/10.1017/S0950797300013020 PRSLAZ 0370-1662 Google Scholar
T. Neugebauer,
“Berechnung der Lichtzerstreuung von Fadenkettenlösungen,”
Ann. Phys., 42
(7–8), 509
–533
(1943). http://dx.doi.org/10.1002/(ISSN)1521-3889 ANPYA2 0003-3804 Google Scholar
I. L. Fabelinskii, Molecular Scattering of Light, 622 Plenum Press, New York
(1968). Google Scholar
BiographyLeonid L. Chaikov is the head of the laboratory for nonlinear optics and light scattering at the Lebedev Physical Institute of the Russian Academy of Sciences. He received his PhD in optics from the Lebedev Physical Institute in 1987. He is the author of more than 70 journal papers. His current research interests include light scattering in turbid media, critical phenomena, nanoparticle sizing, and bio-optics. Marina N. Kirichenko is the research associate in the laboratory for nonlinear optics and light scattering at the Lebedev Physical Institute of the Russian Academy of Sciences. She is a young scientist who is ready to defend her dissertation in optics. She is the author and co-author of more than 10 journal papers. Her current research interests are blood plasma proteins, light scattering, and applying of light scattering methods to biological liquids. Svetlana V. Krivokhizha is the leading researcher in the laboratory for nonlinear optics and light scattering at the Lebedev Physical Institute of the Russian Academy of Sciences. She received her PhD in optics from the Lebedev Physical Institute in 1970 and worked in the group led by Immanuil L. Fabelinskii. She is the author and co-author of more than 100 journal papers. Her current research interests are colloid physics and molecular scattering of light. Alexander R. Zaritskiy is the senior researcher in the laboratory for nonlinear optics and light scattering at the Lebedev Physical Institute of the Russian Academy of Sciences. He is the author and co-author of more than 60 journal papers. He has devoted most of his scientific life to the study of the kinetics of energy metabolism of the erythrocytes. His current research interests include evolution, the origins of life, and the phenomenon of time. |


