|
|
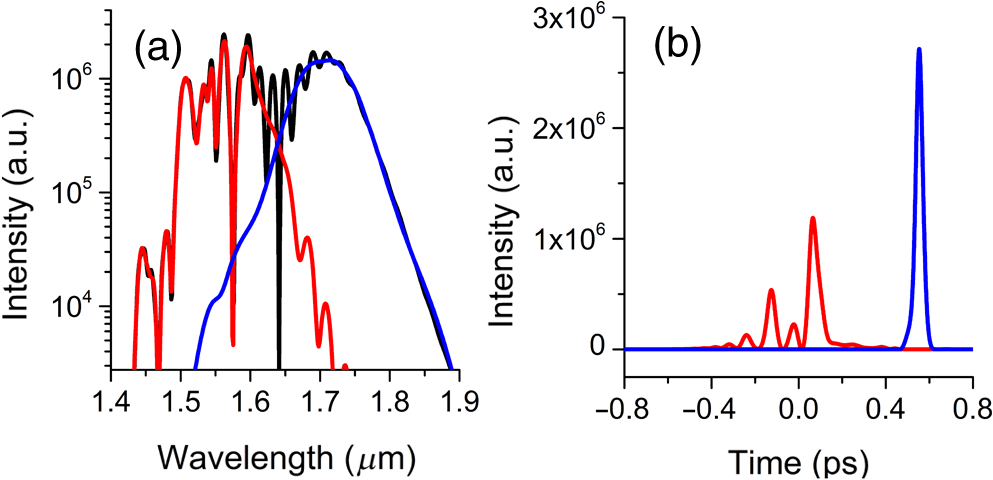
1.IntroductionThe phenomenon of soliton self-frequency shift (SSFS) in optical fibers and waveguides has been widely exploited to fabricate frequency-tunable, femtosecond pulse sources.1–11 SSFS is due to intrapulse stimulated Raman scattering, which continuously transfers energy from higher to lower frequencies and leads to a red shift of the soliton wavelength. Various fibers designed with anomalous dispersion, including standard single mode fibers (SSMFs), index-guided photonic crystal fibers (PCFs), air-core photonic band-gap fibers (PBGFs), and large-mode-area (LMA) fibers, have all been used to obtain SSFS. The corresponding soliton energy ranges from picojoules in index-guided PCFs to microjoules in air-core PBGFs, whereas the soliton pulse width is typically in the ~100 fs range. Among all the applications of optical solitons generated using the SSFS technique, multiphoton microscopy (MPM) has benefited remarkably due to the following merits: (1) mathematically, the intensity profile of the isolated fundamental soliton is a Sech2 function,12,13 which means the pulse quality is superb without sidelobes or pedestals.9 During excitation, this superb pulse quality avoids extra energy deposition onto the sample and the accompanying photodamage. (2) The wavelength can be tuned over 1000 nm,4 making virtually all commonly used fluorophores, both exogenous and endogenous, accessible with a soliton source. (3) The ultrashort pulse width () of solitons is essential for boosting the MPM signal. For example, two-photon (2P) and three-photon (3P) signals are proportional to and , respectively, where is the pulse width. So, a shorter pulse width is favored in terms of higher signal level. (4) The soliton source based on a fiber laser can be extremely compact14 and robust, rendering it a more favorable candidate for clinical use than its solid-state counterparts. Besides, fiber delivery is an inborn virtue which makes endoscopy a reality. (5) Multicolor excitation pulses can be readily generated due to multicolor soliton generation in a single fiber, which is ideal for simultaneously mapping multiple fluorophores.8,15 Experimentally, optical solitons due to SSFS have found numerous applications in various MPM modalities, such as fluorescence imaging,8,11,16–18 harmonic generation imaging,9,11 coherent Raman scattering imaging,19,20 etc. MPM using high-energy solitons customized to the optimum imaging window at 1700 nm even breaks the white matter barrier and reveals the hippocampus in mouse brain in vivo for the first time.11,14 When applying solitons to MPM, a long-pass filter (LPF) is typically used to isolate the soliton with the longest wavelength from the residual. If the solitons are well separated from the residual in a spectrum, the filtering is trivial. For example, experimentally, it has been shown that if the intensity of the overlapping region is order(s) of magnitude smaller than that of the soliton peak, the filtered soliton is rather clean with a time–bandwidth product close to that of the transform limited.9 However, such a well-defined soliton whose spectrum is widely separated from the residual may not always be obtained, especially when the length of the fiber or photonic crystal rod (PC rod) is short. A shorter length favors a higher soliton energy at the cost of more spectral overlapping with the residual.11,21,22 Long-pass filtering in this case leads to noticeable sidelobes in the interferometric autocorrelation trace. This extra power deposition inevitably introduces more photoabsorption, especially for deep-tissue imaging at 1700 nm (water absorption length is 1.7 mm), and raises the risk of photodamage. The dilemma with long-pass filtering in this case is: on one hand, an LPF with a longer cut-on wavelength () cuts off more residual, also sacrificing soliton energy and MPM signal; on the other, an LPF with a shorter cut-on wavelength maintains as much soliton energy and MPM signal as possible, at the cost of more photoabsorption from the residual. Then the fundamental physical question arises: what is the criterion for choosing the best LPF cut-on wavelength in isolating the soliton from the residual when there is dramatic spectral overlapping? Furthermore, the criterion should be based on physically measurable quantities. In this paper, we propose maximizing , as the criterion for optimal spectral filtering, with and being the -photon signal and total filtered pulse energy, respectively. First, we will elucidate the problem of spectral overlapping on soliton isolation. Then we will analyze the physics underlying the choice of this criterion. Finally, numerical simulation will be performed to theoretically investigate how to perform such an optimization procedure under conditions corresponding to those encountered in experiments. 2.Modeling DetailsIn our simulation, we numerically solve the propagation equation of ultrashort pulses in optical fibers in the frequency domain23 where FT is the Fourier transform and is the dispersion coefficient associated with the Taylor series expansion of the propagation constant about carrier frequency . Additionally, is the complex amplitude in the frequency domain, and is the frequency-dependent nonlinear coefficient. is the nonlinear response function of the fiber, which includes both the instantaneous nonlinear response due to the electronic contribution and the delayed Raman response due to molecular vibration.In our simulation, we assume that the input is a 1550-nm femtosecond laser source. Fiber dispersion is dominated by the material dispersion of fused silica, and we expand to the 12th order (). We also neglect dispersion of the nonlinear coefficient by assuming . In accordance with the experiment, we set the effective mode area (PC rod11), and assume the input pulse is a Gaussian pulse with a pulse width . 3.Spectral OverlappingIn this section, we will elucidate the problem of spectral overlapping and its influence on spectral filtering. If the length of the PC rod is short, then the soliton is not well separated from the residual and shows dramatic spectral overlapping with the residual. This overlapping manifests itself as spectral modulation, as shown in Fig. 1(a). To comprehend the origin of this spectral modulation, it is imperative to simultaneously map the spectral–temporal distribution of the soliton and the residual. Thus, we resort to the spectrogram analysis based on the following equation:23 is the variable-delay gate function with a delay value . In accordance with Ref. 23, we assume that is a 50 fs Gaussian pulse. The calculated spectrogram [Fig. 1(b)] reveals dramatic spectral overlapping between the soliton and the residual. Since the soliton is delayed in time with respect to the residual, it introduces a phase difference between the same spectral content in the soliton and the residual in the overlapping region. It is this phase difference that causes remarkable spectral modulation, as shown in Fig. 1(a).Fig. 1(a) Output spectrum after SSFS in 36 cm PC rod. The input pulse energy is 250 nJ. (b) Spectrogram of the output pulse plotted in logarithmic scale. 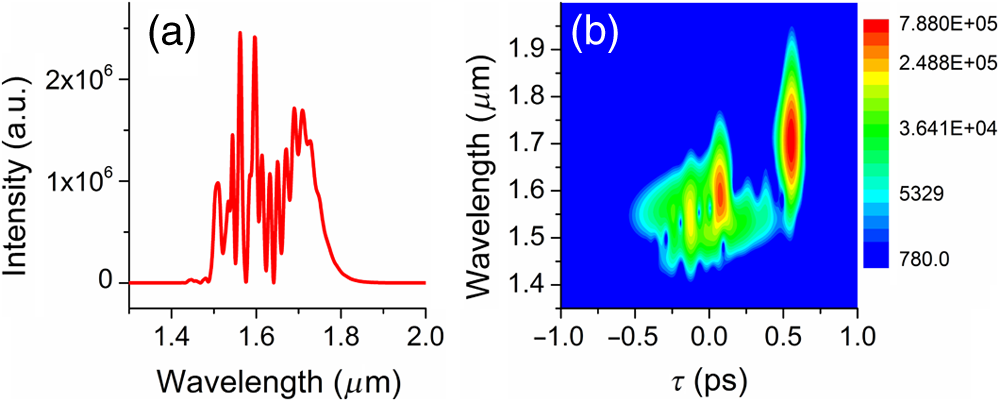 To elucidate the problem of this spectral overlapping for long-pass filtering, we performed temporal filtering in our simulation to approximately isolate the soliton spectrum and the residual spectrum. Specifically, we isolated the soliton pulse in time and calculated its spectrum and then performed the same procedure for the residual. Admittedly, such temporal filtering is not feasible in experiments due to the lack of an ultrashort shutter in the femtosecond range. Figure 2 clearly shows that the soliton spectrum (blue curve) extends below , and the residual spectrum extends beyond . This poses a dilemma for spectral filtering as mentioned in Sec. 1 and consequently, a reasonable choice of is required. 4.as the Criterion for Optimal Spectral FilteringIn MPM, signal is given by the following formula,24 omitting some constants irrelevant of the temporal property of the pulse where is an integer accounting for the -photon absorption, is a dimensionless quantity depending on the pulse shape, is the average power, is the repetition rate of the laser, and is the pulse width. If we recall that is the pulse energy , and is constant and can be omitted, then Eq. (5) is given byIf and remain constant, then is proportional to , or equivalently, should be a constant. Experimentally, measuring the relationship between and is typically used to identify multiphoton absorption and the order . In this paper, we propose to maximize as the criterion for optimal filtering. Contrary to the assumption that and remain constant, if we continuously tune the cut-on wavelength , both the pulse shape and the pulse width change. Consequently, is no longer constant for an -photon process. For example, as decreases from the longer wavelength side, it can be speculated that more soliton energy is admitted through the LPF. Furthermore, the soliton pulse width will decrease since more bandwidth is allowed to pass. These two factors will lead to an increase in . However, as further decreases, more residual energy leaks through the filter. This part, however, suffers from both a long pulse width and poor pulse quality compared with the soliton [Fig. 2(b)]. As a result, the signal increase no longer scales with the energy increase and the will drop. Our choice of as the criterion for optimal filtering is based on the principle of maximal signal generation efficiency. Less efficient deviation from the apparent -photon process (i.e., drops) will be deemed as introducing extra energy, because this part of the power does not lead to a presumed increase in signal. The advantages of such a criterion for optimal filtering include the following: (1) It is based on the physical foundation of the most efficient signal generation as explained above. (2) It is based on physical quantities that can be easily measured experimentally. Specifically, filtered pulse energy can be measured with a power meter given that the repetition rate is known. The -photon signal can be measured even without a labeled biological sample, e.g., a photodiode with a proper cut-off wavelength is sufficient to generate the -photon current needed to optimize . Besides, LPFs with variable are off-the-shelf (see, e.g., linear variable filter products DELTA). Next, we perform simulation to show how this works under conditions corresponding to those encountered in experiments. In our simulation, we assume that 2P and 3P signals are generated, corresponding to 2PM and 3PM, respectively. and are given by where is the intensity profile of the pulse.If we assume the output pulse is the same as that in Fig. 2, the calculated and both reach their maximum at [Figs. 3(a) and 3(b)]. As decreases toward 1627 nm, both and increase monotonously. According to our previous analysis, it is because both the soliton energy increases and its pulse width shrinks, leading to efficient signal generation. Below 1627 nm, more residual passes and leads to an inefficient increase of the signal given in the same increment of energy. Comparing the filtered spectrum at the optimal spectral filtering proposed here [red line, Fig. 3(c)] to that of the soliton [blue line, Fig. 2(a)], it can be seen that the majority of the soliton spectrum is maintained, while some residual inevitably passes. Fig. 3(a) and as a function of . (b) and as a function of . (c) Spectrum before (black line) and after (red line) optimal spectral filtering at . Simulation conditions correspond to those in Fig. 2.  Experimentally, if an LPF with a fixed is to be designed to filter the soliton, it is also beneficial and enlightening to investigate the sensitivity of the multiphoton signal on , as there may be some deviation from the designed value. Figures 3(a) and 3(b) also show variations of and as a function of . Quantitatively, the maximum relative deviations of and are 6.5% and 10.6%, respectively, within from the designed value of 1627 nm. We also note that in this case, both and reach local maxima at an optimal of 1627 nm. We also performed simulations with various input energies. At a lower input energy where the soliton shifts less, versus and the optimal spectral filtering are shown in Fig. 4. The soliton only shifts to in this case, and both the and reach their maximum at . Thus, we consider 1593 nm as the cut-on wavelength for optimal spectral filtering. Fig. 4(a) and (b) as a function of . (c) Spectrum before (black line) and after (red line) optimal spectral filtering at . The input is a 360 fs, 180 nJ Gaussian pulse, and the PC rod is 36-cm long.  At a higher input energy, the situation is a bit more complicated because more solitons may be generated due to the fission of a higher-order soliton.25 Consequently, the soliton with the largest wavelength shift spectrally overlaps the next soliton with the second largest wavelength shift, rather than the residual pump. Figures 5(a) and 5(b) show the simulated spectrum and temporal intensity profile for an input pulse energy of 350 nJ. Apparently, two solitons emerge after SSFS in the 36-cm PC rod, the first one at and the second at . There is a dramatic spectral overlapping between the two solitons as well. The calculated peaks at [Fig. 5(c)] with a filtered spectrum, as shown in Fig. 5(e). The calculated , however, reaches its maximum at a slightly different (1681 nm) from that of . Additionally, the increase in is no longer monotonous as decreases, contrary to the instances when the input energy is smaller (Figs. 3 and 4). When decreases, first reaches its local maximum at (optimal for ), decreases a little bit, and then rises again to its global maximum at . We still regard this global maximum position as the for optimal spectral filtering. According to our simulation, this behavior is typical for an even higher input with more solitons generated (not shown). The filtered spectrum with incorporates slightly more energy from the second soliton [Fig. 5(f)] than that with . Fig. 5(a) Simulated spectrum and (b) temporal intensity profile of multi-soliton generation. (c) and (d) as a function of . Spectrum before (black line) and after (red line) optimal spectral filtering at (e) and (f) , corresponding to the peak position in (c) and (d), respectively. The input is a 360 fs, 350 nJ Gaussian pulse, and the PC rod is 36-cm long.  Admittedly, as mentioned above, there is indeed an alternative to increase the separation between the soliton and the residual or the second soliton, i.e., by using a longer fiber or PC rod.21 For example, using a 100-cm PC rod, the soliton shifts to 1700 nm with only a 120 nJ input energy and shows little spectral overlapping with the residual (Fig. 6) compared with that of SSFS in 36-cm PC rod (Fig. 3) for the same soliton wavelength. and calculations indicate an optimal spectral filtering wavelength of 1595 nm, which introduces a negligible spectrum from the residual [Fig. 6(c)]. However, the problem with this method is that the filtered soliton suffers from both lower pulse energy and longer pulse width compared with that of a shorter PC rod. Specifically, at optimal spectral filtering, the filtered soliton energy and pulse width after SSFS in a 1 m PC rod are 73 nJ and 60 fs, respectively, much worse than those in a 36 cm PC rod (114 nJ and 49 fs, respectively). This leads to a sharp decrease in both 2P and 3P signals given the relationship in Eq. (6). Another practical issue with a long PC rod, which supports solitons with very high energy, is that it is rigid and cannot be bent like optical fibers. A longer PC rod is much more difficult to fix or align and is more susceptible to instability introduced by vibration. To get a soliton with higher energy and shorter pulse width suitable for MPM, especially deep-tissue microscopy, a shorter PC rod is still a sensible choice. 5.ConclusionsSSFS is a highly versatile technique capable of generating femtosecond pulses with a customized wavelength, multicolor or high energy. These merits have found widespread applications for solitons in various modalities of MPM, and have recently made solitons the enabling tool for deep-tissue MPM. The soliton generated through SSFS may not always be well separated from the rest of the spectrum, neither the residual pump nor the second soliton, especially for high-energy solitons generated in a short PC rod. In order to get both a high soliton energy and reduce energy deposition on the sample, here, we propose maximizing as a criterion for choosing in an optimal spectral filtering. This criterion both maximizes signal generation efficiency and necessitates the measurement of readily measurable physical quantities. We expect that the criterion proposed in this paper may both increase the signal level and incur minimal extra energy deposition on the sample, which may well facilitate future experiments such as deep-tissue MPM. AcknowledgmentsThis work was supported by the National Science Foundation of China (Grants Nos. 61475103 and 11404218); the Natural Science Foundation of SZU (Grant No. 00002701); and the National Key Scientific Instrument and Equipment Development Projects of China (Grant No. 2012YQ150092). ReferencesB. Zysset, P. Beaud and W. Hodel,
“Generation of optical solitons in the wavelength region ,”
Appl. Phys. Lett., 50
(16), 1027
–1029
(1987). http://dx.doi.org/10.1063/1.97959 APPLAB 0003-6951 Google Scholar
N. Nishizawa and T. Goto,
“Compact system of wavelength-tunable femtosecond soliton pulse generation using optical fibers,”
IEEE Photonics Technol. Lett., 11
(3), 325
–327
(1999). http://dx.doi.org/10.1109/68.748223 IPTLEL 1041-1135 Google Scholar
J. van Howe et al.,
“Demonstration of soliton self-frequency shift below 1300 nm in higher-order mode, solid silica-based fiber,”
Opt. Lett., 32
(4), 340
–342
(2007). http://dx.doi.org/10.1364/OL.32.000340 OPLEDP 0146-9592 Google Scholar
M. Chan et al.,
“ tunable Raman soliton source based on a Cr:forsterite-laser and a photonic-crystal fiber,”
IEEE Photonics Technol. Lett., 20
(11), 900
–902
(2008). PSISDG 0277-786X Google Scholar
D. G. Ouzounov et al.,
“Generation of megawatt optical solitons in hollow-core photonic band-gap fibers,”
Science, 301
(5640), 1702
–1704
(2003). http://dx.doi.org/10.1126/science.1088387 SCIEAS 0036-8075 Google Scholar
F. Luan et al.,
“Femtosecond soliton pulse delivery at 800 nm wavelength in hollow-core photonic bandgap fibers,”
Opt. Express, 12
(5), 835
–840
(2004). http://dx.doi.org/10.1364/OPEX.12.000835 OPEXFF 1094-4087 Google Scholar
S. A. Dekker et al.,
“Highly-efficient, octave spanning soliton self-frequency shift using a specialized photonic crystal fiber with low OH loss,”
Opt. Express, 19
(18), 17766
–17773
(2011). http://dx.doi.org/10.1364/OE.19.017766 OPEXFF 1094-4087 Google Scholar
K. Wang et al.,
“Three-color femtosecond source for simultaneous excitation of three fluorescent proteins in two-photon fluorescence microscopy,”
Biomed. Opt. Express, 3
(9), 1972
–1977
(2012). http://dx.doi.org/10.1364/BOE.3.001972 BOEICL 2156-7085 Google Scholar
K. Wang and C. Xu,
“Tunable high-energy soliton pulse generation from a large-mode-area fiber and its application to third harmonic generation microscopy,”
Appl. Phys. Lett., 99 071112
(2011). http://dx.doi.org/10.1063/1.3628337 APPLAB 0003-6951 Google Scholar
K. Wang and C. Xu,
“Wavelength-tunable high-energy soliton pulse generation from a large-mode-area fiber pumped by a time-lens source,”
Opt. Lett., 36
(6), 942
–944
(2011). http://dx.doi.org/10.1364/OL.36.000942 OPLEDP 0146-9592 Google Scholar
N. G. Horton et al.,
“In vivo three-photon microscopy of subcortical structures within an intact mouse brain,”
Nat. Photonics, 7
(3), 205
–209
(2013). http://dx.doi.org/10.1038/nphoton.2012.336 1749-4885 Google Scholar
J. P. Gordon,
“Theory of the soliton self-frequency shift,”
Opt. Lett., 11
(10), 662
–664
(1986). http://dx.doi.org/10.1364/OL.11.000662 OPLEDP 0146-9592 Google Scholar
G. Agrawal, Nonlinear Fiber Optics, Elsevier Science, Amsterdam
(2010). Google Scholar
K. Wang et al.,
“Advanced fiber soliton sources for nonlinear deep tissue imaging in biophotonics,”
IEEE J. Sel. Top. Quantum Electron., 20
(2), 6800311
(2014). IJSQEN 1077-260X Google Scholar
P. Qiu and K. Wang,
“Wavelength-separation-tunable two-color-soliton-pulse generation through prechirping,”
Phys. Rev. A, 90
(4), 043813
(2014). Google Scholar
J. R. Unruh et al.,
“Two-photon microscopy with wavelength switchable fiber laser excitation,”
Opt. Express, 14
(21), 9825
–9831
(2006). http://dx.doi.org/10.1364/OE.14.009825 OPEXFF 1094-4087 Google Scholar
L. V. Doronina et al.,
“Tailoring the soliton output of a photonic crystal fiber for enhanced two-photon excited luminescence response from fluorescent protein biomarkers and neuron activity reporters,”
Opt. Lett., 34
(21), 3373
–3375
(2009). http://dx.doi.org/10.1364/OL.34.003373 OPLEDP 0146-9592 Google Scholar
G. McConnell and E. Riis,
“Photonic crystal fibre enables short-wavelength two-photon laser scanning fluorescence microscopy with fura-2,”
Phys. Med. Biol., 49
(20), 4757
–4763
(2004). http://dx.doi.org/10.1088/0031-9155/49/20/007 PHMBA7 0031-9155 Google Scholar
A. F. Pegoraro et al.,
“All-fiber CARS microscopy of live cells,”
Opt. Express, 17
(23), 20700
–20706
(2009). http://dx.doi.org/10.1364/OE.17.020700 OPEXFF 1094-4087 Google Scholar
E. R. Andresen, P. Berto and H. Rigneault,
“Stimulated Raman scattering microscopy by spectral focusing and fiber-generated soliton as Stokes pulse,”
Opt. Lett., 36
(13), 2387
–2389
(2011). http://dx.doi.org/10.1364/OL.36.002387 OPLEDP 0146-9592 Google Scholar
K. Wang et al.,
“Multi-color femtosecond source for simultaneous excitation of multiple fluorescent proteins in two-photon fluorescence microscopy,”
Proc. SPIE, 8588 85882I
(2013). http://dx.doi.org/10.1117/12.2000583 PSISDG 0277-786X Google Scholar
K. Wang et al.,
“Tunable megawatt soliton pulse generation covering the optimum wavelength window for tissue penetration,”
in CLEO: Science and Innovations,
(2014). Google Scholar
J. M. Dudley and J. R. Taylor, Supercontinuum Generation in Optical Fibers, Cambridge University Press, Cambridge
(2010). Google Scholar
C. Xu and W. Webb, Topics in Fluorescence Spectroscopy, Kluwer Academic Publisher, New York
(2002). Google Scholar
A. Husakou and J. Herrmann,
“Supercontinuum generation of higher-order solitons by fission in photonic crystal fibers,”
Phys. Rev. Lett., 87 203901
(2001). http://dx.doi.org/10.1103/PhysRevLett.87.203901 PRLTAO 0031-9007 Google Scholar
BiographyKe Wang received his PhD in optics from Fudan University, Shanghai, China, in 2009. In 2009, he worked as a postdoctoral associate and later as a research associate at the School of Applied and Engineering Physics, Cornell University, United States. Since July 2013, he has been a professor in the College of Optoelectronic Engineering, Shenzhen University, Shenzhen, China. His research interests include ultrashort laser sources and their application to nonlinear optical microscopy. |