

|
|
1.IntroductionAlzheimer’s disease (AD) is a progressive neurodegenerative disorder that gradually destroys brain cells, causing changes in memory, thinking, and other brain functions.1 Amyloid beta (Aβ; plaques), the primary constituent of senile plaques, and tau tangles are hypothesized to play a primary role in the pathogenesis of AD, but it is still hard to identify the fundamental mechanisms.2–4 Several recent research papers reported that γ-aminobutyric acid (GABA) is an another important pathological hallmark of the AD brain.5,6 According to a recent World Alzheimer’s report, the number of people globally suffering from AD in 2013 is estimated to be 35 million, and epidemiological studies predict that this number will grow at an alarming rate.7 This number is estimated to approximately double every 20 years to 65 million by 2030 and 115 million by 2050. AD is a major global health issue; therefore, reliable diagnosis and early detection are important.7 Since none of the techniques for the clinical diagnosis of AD have achieved effectiveness, definitively diagnosing and examining patients suffering from AD are possible only postmortem. Currently, several diagnostic techniques, including magnetic resonance imaging and positron emission tomography, are employed for observing AD.8 However, these potential AD diagnostic methods have low spatial resolution, low sensitivity, and low specificity. Most importantly, subjective factors exist because they depend on a doctor’s clinical experience; therefore, they are not suitable for early diagnosis. Multiphoton nonlinear optical microscope imaging systems using ultrafast lasers have powerful advantages such as label-free detection, deep penetration of thick samples, high sensitivity, subcellular spatial resolution, three-dimensional optical sectioning, chemical specificity, and minimum sample destruction.9,10 In particular, the three techniques of coherent anti-Stokes Raman scattering (CARS), two-photon excited fluorescence (TPEF), and second-harmonic generation (SHG) microscopy are most widely employed for biomedical imaging.11–13 Because each modality has different contrast mechanisms and images different biomolecular components, combining those multiphoton microscopies in one platform would make it possible to observe the proportions of various biomolecules. Several pioneering AD research groups have imaged senile plaque, one type of lesion in AD, using multiphoton microscopy. Christie et al. successfully demonstrated in vivo imaging of senile plaque over several months using multiphoton laser scanning microscopy,14 but they used thioflavine-S fluorescent dye stained senile plaques in an AD mouse model. Another study by Kwan et al. visualized senile plaque and collagen in AD mouse tissue with autofluorescence and SHG images and also characterized the intrinsic emission spectrum of senile plaque.15 However, this research has several limitations, such as offering no chemical information on the sample and observing only restricted senile plaque biomolecules. Although multiphoton microscopies are very useful tools, they usually have limited applications to superficial tissues such as the skin or to surgically exposed internal organs because large objective lenses are required. Hence, to overcome the limitation, an endoscopy technique should be combined with multiphoton microscopy, which will accelerate the biomedical study of in vivo tissue. Several research groups have proposed preliminary concepts for endoscopy combined with CARS or two-photon microscopy.16–20 In particular, two research groups have demonstrated different approaches using gradient-index (GRIN) lenses for endoscopic imaging, called a GRIN endoscope system, or microendoscopy.21,22 In this study, we developed a multimodal multiphoton nonlinear optical microspectroscopy imaging system combining CARS, TPEF, and SHG into one platform. In particular, we developed a preliminary endoscope imaging system based on a small-diameter probe with GRIN lenses because multiphoton microscopy needs to be combined with an endoscopy technique, and we applied our imaging modality to the diagnosis of unstained AD brain samples. We compared multimodal microendoscopic images from two hippocampal regions, the cornus ammonis-1 (CA-1) and dentate gyrus (DG), in normal and AD brains. In addition, we also measured the spectral difference in the vibration stretching mode in normal and AD samples using CARS spectroscopy. 2.Experimental Setup and Methods2.1.Multimodal Multiphoton Nonlinear Optical Microspectroscopy Imaging SystemFigure 1 shows a schematic of our multimodal multiphoton nonlinear optical microspectroscopy imaging system based on a small GRIN lens probe. This multimodal multiphoton microendoscope imaging modality was modified and developed from a previously described system.23–25 The laser system used a home-made Ti:sapphire femtosecond oscillator pumped by a green laser source (Verdi V5, Coherent). The output beam from the oscillator generates a 120 fs, 56.1 MHz pulse train, and a 460 mW average output power with a center wavelength of 800 nm. Our laser system is described in greater detail in our previous paper.25 The laser beam passed through an optical isolator (IO-5-NIR-LP, Thorlabs) and was divided into two beams (3:1) by a beam splitter (BP133, Thorlabs). The reflected beam was transmitted via a series of optical components for spatial filtering, and a “pump beam” in a narrow band for the CARS process, with a pulse of 0.8 nm and center wavelength of 800 nm, was generated by combining two filters (LL01-808-12.5, Semrock and custom-made filter from Andover Corporation). The transmitted pulse, in contrast, was coupled into the photonic crystal fiber (FemtoWHITE 800, NKT Photonics) via an objective lens to make ultrabroadband “Stokes pulses.” Both the narrowband pump and broadband Stokes pulses were spatially and temporally overlapped by a long-wavelength pass filter (BLP01-785R-25, Semrock), and the two beams were passed through galvanometric mirrors and microendoscope. We demonstrated multiphoton microendoscopy by using a GRIN lens [GT-MO-080-018-810, 0.8 numerical aperture (NA), , WD: , GRINTECH], which was fixed under the microscope by a clamp (VK250, Micro V-Clamps, Thorlabs) attached to a three-axis stage. The objective lens (MPlanFLN, 0.3 NA, , Olympus) was used to inject light into the GRIN lens, and the total magnification of the microendoscope was . We used a comparable microscope objective lens (CFI Plan Fluor, 0.8 NA, , W, Nikon) to compare optical images obtained by an objective lens and endoscopy. The backwards-scattered nonlinear signals were collected by an epi-detection configuration. They were separated from the excitation beams by a dichroic mirror (custom-made mirror from CVI) and passed through the short-pass filter (FF01-775/SP-25, Semrock). The CARS, TPEF, and SHG signals were spectrally separated by dichroic mirrors and bandpass filters (CARS: HQ650/20 m, Chroma, TPEF: FF01-550/88, SHG: FF01-390/18, Semrock) to obtain multimodal nonlinear images. All of their signals were simultaneously recorded by two different photomultiplier tubes, one for CARS and the other for TPEF and SHG (H-8249-102, H-7827-012, Hamamatsu). A monochromator (DM500i, DongWoo) was used to obtain the CARS spectrum, and a CCD camera (iDus DV401A-BV, Andor) having an effective spectral resolution of was used to record it. To convert the signals to nonlinear optical images, a data acquisition program written in LabVIEW 8.6 was used. Typically, powers of 20 mW for the pump and 3 mW for the Stokes pulses were used at the sample for imaging. Fig. 1Schematic of a multimodal multiphoton microspectroscopy imaging system based on gradient-index (GRIN) lenses for simultaneous coherent anti-Stokes Raman scattering (CARS), two-photon excited fluorescence (TPEF), and second-harmonic generation (SHG) microendoscopic imaging observations. ISO, isolator; BS, beam splitter; OL, objective lens; PCF, photonic crystal fiber; LPF, long-wavelength pass filter; NBPF, narrow bandpass filter; GS, galvanometer scanner; DM, dichroic mirror; SPF, short-wavelength pass filter; PMT, photomultiplier tube; and FM, flip mirror.  2.2.Brain Tissue Preparation and Immunohistochemistry MethodAll the experiments were performed according to the provisions of the Gwangju Institute of Science and Technology (GIST) Animal Care and Use Committee. Transgenic mice ( FAD) were obtained originally from the Jackson Laboratory, and as a kind gift from professor Woo Jin Park (GIST). For brain sample preparation, 29-weeks old wildtype and FAD mice were transcardially perfused with 4% paraformaldehyde in phosphate-buffered saline (PBS) solution under anesthesia with isoflurane. The whole brain was obtained, fixed in 10% neutral formalin solution (Biochemical, BBC), and embedded in paraffin via a Leica EG1140C. Coronal hippocampal sections in thickness were obtained with a Leica RM2135 microtome. After sectioning, brain tissue was dewaxed and rehydrated. It is reported that the formalin and paraffin fixed methods do not substantially affect the CARS spectra on lipids in brain tissue samples.26 For the detection of amyloid beta (Aβ) oligomers, sections were first rehydrated then endogenous peroxidase activity was quenched using 3% (Dako), and subjected to block with 1% bovine serum albumin in PBS for 1 h RT. Sections were incubated in amyloid beta 6E10 primary antibody (1:500, Covance) at 4°C for 24 h followed by biotin-labeled secondary antibodies, horseradish peroxidase-labeled avidin–biotin complex, and 3,3′-diaminobenzidine (Dako). Sections were counterstained with hematoxylin (Harris), mounted, and covered with Deckgläser coverslips. The hippocampus was visualized with a Zeiss upright light microscope in , , and (Zeiss). 3.Experimental Results3.1.Comparison of Multiphoton (CARS/TPEF/SHG) Images Taken with Objective Lens and MicroendoscopeWe focused on the hippocampal CA-1 and DG regions in our measurements because these two areas are damaged during AD and are well-known to be involved in learning and memory. Figure 2 compares the multimodal multiphoton images from the same position in the CA-1 region in AD samples taken with the objective lens (a)–(d) and microendoscope (e)–(h). CARS, TPEF, and SHG images were obtained simultaneously with the objective lens in Figs. 2(a)–2(c) and with the microendoscope in Figs. 2(e)–2(g), respectively, and the corresponding merged CARS, TPEF, and SHG images are shown in Figs. 2(d) and 2(h), respectively. Each image was (); the acquisition time per image was within 5 s, and the size of the scale bar was . The CARS images were obtained from the resonant CARS signal of the aliphatic stretching vibration mode region from lipids. The TPEF and SHG images were observed using the autofluorescence signal from amyloid fibers and collagen, respectively.15,27–29 TPEF Figs. 2(i) and 2(j) compare the CARS intensity profiles of the - and -axes along the white dotted line in the objective lens image in Fig. 2(a) (red line in profiles) and the endoscope image in Fig. 2(e) (blue line in profile). The CARS signal strength for the objective lens is 23% higher, but the optical resolutions are similar owing to their identical NA. Figure 2 confirms that our microendoscope system maintains the image quality and spatial resolution of images obtained using an objective lens. Fig. 2Comparison of multimodal multiphoton nonlinear images from the same Alzheimer’s disease (AD) brain tissue region taken with (a)–(d) objective lens and (e)–(h) microendoscope. (a, e) CARS images, (b, f) TPEF images, (c, g) SHG images, and (d, h) merged images. (i), (j) Intensity profiles of - and -axes along the white dotted line for (a) objective lens and (e) endoscope images. All scale bars are . 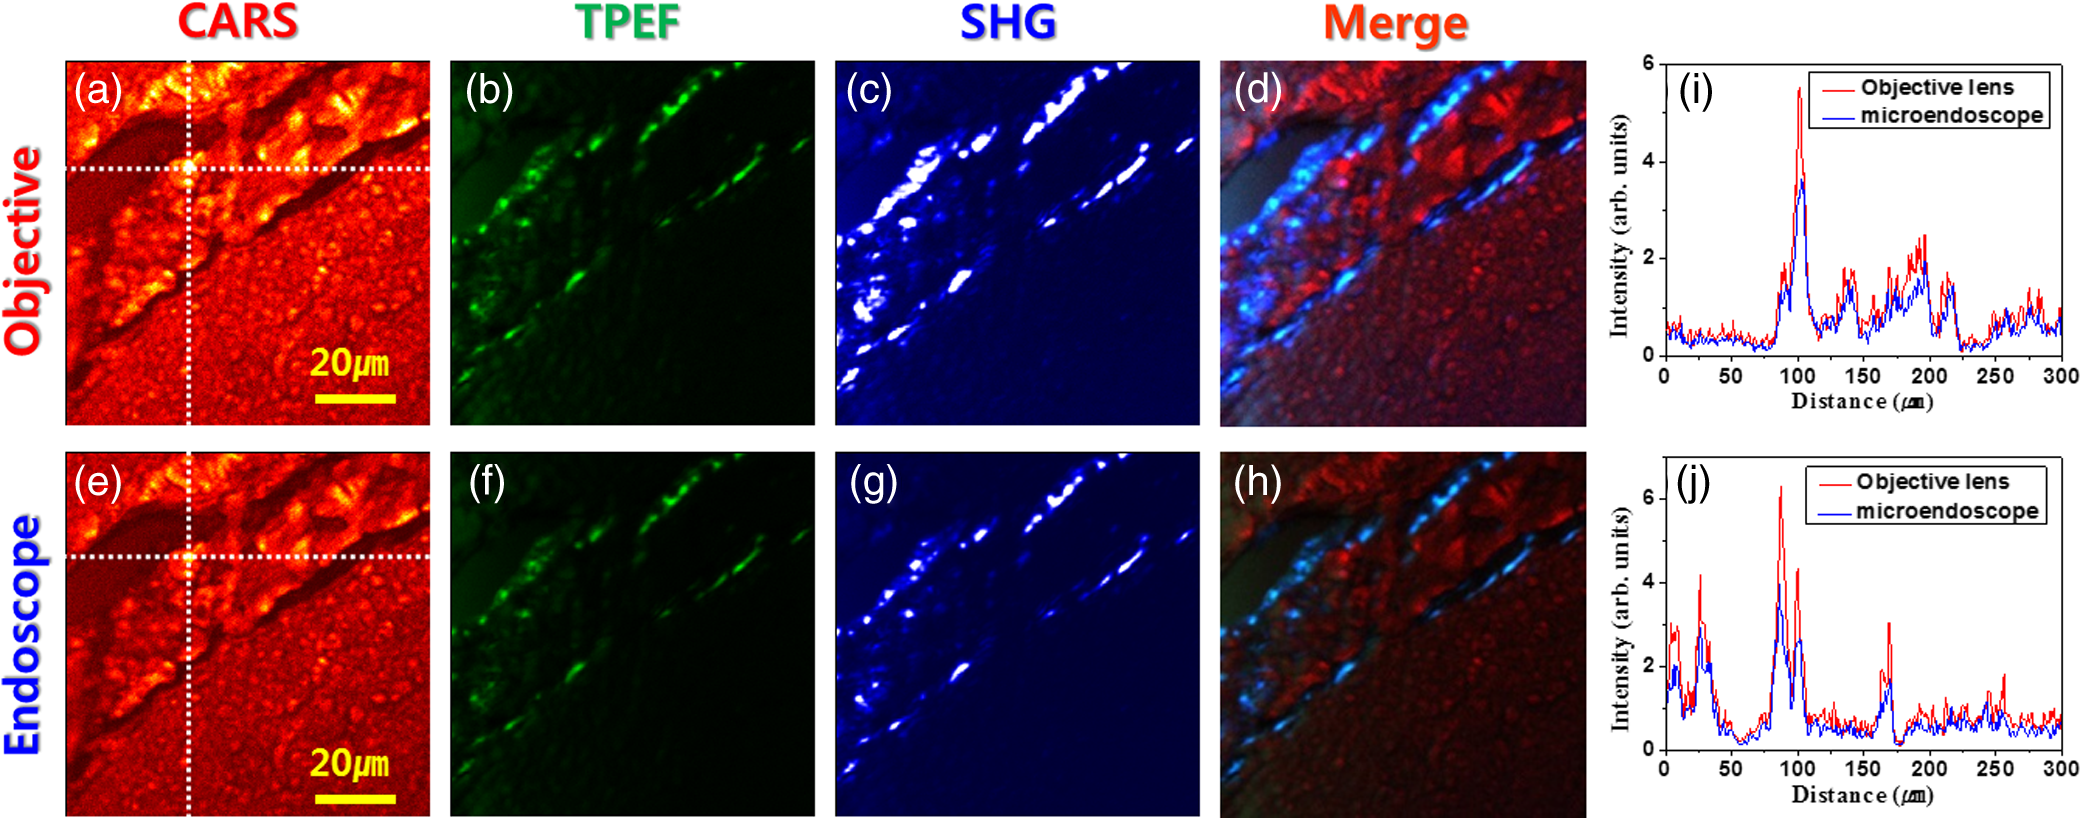 3.2.Comparison of Microendoscopic Multiphoton Images of Normal and AD Samples in CA-1 RegionIn Fig. 3, we compare simultaneously observed multimodal multiphoton (CARS/TPEF/SHG) microendoscopic images of normal (a)–(d) and AD (e)–(h) samples from the CA-1 region of each sample. Each image was (); the acquisition time per image was within 5 s, and the size of the scale bar was . In the normal sample, we observed a low signal from lipids in Fig. 3(a) and low concentrations of amyloid beta fiber in Fig. 3(b) and collagen in Fig. 3(c) in the CA-1 region. In contrast, in the AD sample, we confirmed an increased CARS signal from lipids and very high amounts of amyloid beta fiber (white arrows) and collagen (yellow arrows), with large differences from the normal sample. Fig. 3Comparison of typical multimodal multiphoton microendoscope images of (a)–(d) normal and (e)–(h) AD samples from hippocampal brain CA-1 region. (a, e) CARS images, (b, f) TPEF images, (c, g) SHG images, and (d, h) merged images. Red: CARS (lipid-rich structure). Green: TPEF (amyloid fiber or other fluorescent particles, yellow arrows). Blue: SHG (collagen, yellow arrows). All scale bars are .  In order to prove our results, we observed amyloid beta fiber, which is known as a representative hallmark of AD, in normal and AD samples by using immunostaining method. Figure 4 indicates the representative histology images of normal and AD samples. Dark brown color represents amyloid beta fiber (black arrows). As a result, we confirmed that amyloid beta fiber is observed in AD samples much more than in normal samples as shown in Fig. 4. Amyloid beta plaques are regularly developed and observed in 29-week old AD mice. 3.3.Comparison of Microendoscopic Multiphoton Images of Normal and AD Samples in DG RegionFigure 5 shows our observations of the DG region, a different region in the hippocampus, and compares multiphoton microendoscopic images of normal (a)–(d) and AD (e)–(h) samples. The image size, acquisition time, and size of the scale bar in Fig. 5 are the same as in Fig. 3. Figures 5(a) and 5(e) are CARS images of the normal and AD samples obtained using the resonant CARS signals of the aliphatic stretching vibration mode region, as described previously. In the normal tissue, we observed a well-distributed CARS signal, but in the AD sample, there were high signals in some areas [yellow in Fig. 5(e)] due to GABA, a neurotransmitter reported as the most prominent feature in AD in many research papers.5–7,30–32 This means that GABA is more highly accumulated in the DG in the AD sample than in the normal sample. We also observed higher autofluorescence signals, as shown in Fig. 5(f) (white arrows) than in Fig. 5(b), and these come from amyloid beta fiber (red dotted circle) and fluorescent particles such as NAD(P)H. Amyloid fiber is also an important hallmark of the AD brain.33 In addition, we obtained very strong SHG signals (yellow arrows) from collagen as shown in Fig. 5(g). Fig. 5Comparison of typical multimodal multiphoton microendoscope images of (a)–(d) normal and (e)–(h) AD samples from hippocampal DG region. (a, e) CARS images, (b, f) TPEF images, (c, g) SHG images, and (d, h) merged images. Red: CARS (lipid-rich structure). Green: TPEF (amyloid beta fiber or other fluorescent particles, yellow arrows). Blue: SHG (collagen, yellow arrows). All scale bars are .  We confirmed the increased amounts of lipids, amyloid fiber, and collagen in the AD samples compared to normal brain samples. In particular, higher multiphoton signals (CARS/TPEF/SHG) are generated in the DG region than in CA-1. Several research papers showed that DG is the primary gateway for cortical input to the hippocampus and is crucial during memory formation and recall.6,7 Therefore, in AD, the DG region has more prominent markers than CA-1, and our microendoscope system will be a powerful technique for observing these markers. 3.4.Quantitative Analysis of Spectral Difference Between Normal and AD Samples with CARS Microendoscope SpectroscopyWe measured the spectral difference between the normal and AD samples using CARS microendoscope spectroscopy. We performed the experiment with 20 normal and 20 AD samples each day and repeated it four times, so a total of 160 spectra were measured. Figure 6 compares typical CARS spectra of representative normal (blue squares) and AD (red triangles) samples obtained from the region in the blue dotted circles in Figs. 5(a) and 5(e), which were overlapped as shown in Fig. 6(a). The CARS spectra were measured near the stretching vibration mode and were obtained at an arbitrary point of lipids inside the tissue, not by integrating the entire tissue area. Each point in the normal and AD groups had the same spectral pattern group by group except for the height of the intensity. The exposure time for taking a CARS spectrum was 1 s. In the normal brain sample, two main peaks were observed, at 2845 and , which correspond to the symmetric stretching vibration and symmetric stretching vibration, respectively. On the other hand, in the AD brain sample, only one peak was strongly observed, at , which corresponds to the symmetric stretching vibration mode, whereas symmetric stretching vibration mode was clearly weakened. Typically, the CARS signal intensity of AD samples is almost six times stronger than the intensity of the control sample at the symmetric stretching vibration as shown in Fig. 6(a). This is because considerable GABA, the chemical characteristics of which are responsible for the symmetric stretching mode, accumulates as AD progresses.5,6,30–32 Fig. 6(a) Comparison of typical CARS spectra of control (blue squares) and AD (red triangles) in stretching vibration region. (b) Normalized version of CARS spectra in Fig. 5(a). 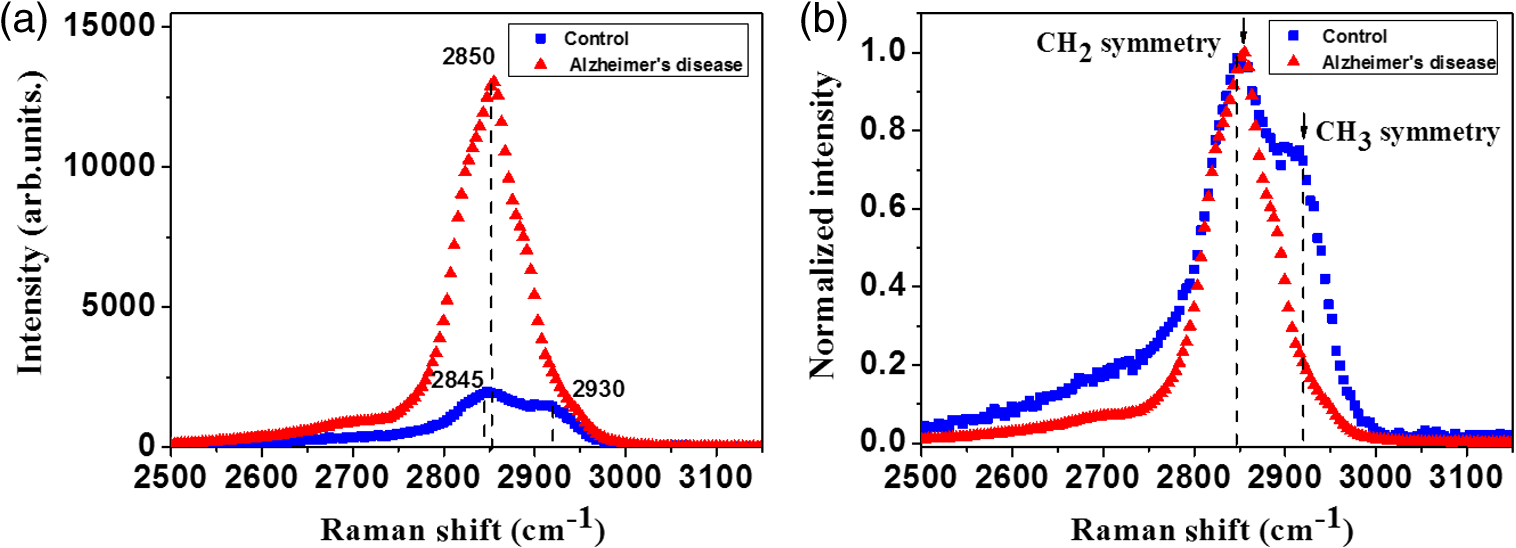 To analyze quantitatively the difference in the CARS spectra of the control and AD brain samples, all the data were normalized by setting the peak equal to 1.0. Figure 6(b) shows the normalized versions of the spectra in Fig. 6(a). For the normalized CARS spectra from 80 normal and 80 AD brain samples, the peak intensity was divided by the peak intensity, . Table 1 shows the average and standard deviation of the values of for each group. The AD:normal ratio of the values of is , indicating that symmetric stretching is suppressed in the AD brain sample. We speculate that this is due to changes in the chemical structure of lipids during the process of oxidative stress, which is implicated as a cause of AD.30,31 Table 1Average and standard deviation of I2845/I2930 in control (normal brain) and Alzheimer’s disease (AD) brain.
4.ConclusionIn this work, we demonstrated a multimodal multiphoton nonlinear optical microspectroscopy imaging system based ona small probe with a GRIN lens for preliminary endoscope imaging that combines CARS, TPEF, and SHG observing capability in one platform and applied it to unstained AD brain samples. We confirmed that our imaging system maintains the image quality and spatial resolution of images obtained using an objective lens of similar NA [Figs. 2(a) and 2(e)]. The multimodal microendoscopic images show distinct molecular structures and components (lipids, amyloid beta fiber, and collagen) of brain tissue associated with AD transformation. We compared multimodal microendoscopic images from two different hippocampal regions, CA-1 and DG, in normal and AD brains. We proved that the amount of lipids, amyloid fibers, and collagens is greater in AD samples than in normal samples. In particular, higher multiphoton signals (CARS/TPEF/SHG) are generated in the DG region than in CA-1. In addition, we also measured the spectral difference in the vibration stretching mode in normal and AD samples using CARS microendoscope spectroscopy. As a result, normal and AD brain were clearly distinguished by a large difference using CARS spectra with high-spectral resolution obtained via a narrowband pump beam. We expect that our imaging system will be an diagnosis in vivo imaging tool at the tissue level for diseases such as neurological disorders. Our next goal is to develop an multimodal multiphoton in vivo imaging system using optical fiber bundles; this research is in progress. We expect that using multimodal multiphoton endoscopy with optical fibers will provide a powerful tool for real-time in vivo diagnosis of various diseases in the near future. AcknowledgmentsThis work was supported by National Research Foundation of Korea (NRF) grants funded by the Ministry of Science, ICT, & Future Planning (2011-0015520, R15-2008-006-02001-0, and 2011-0020956), and by grants from the Bio-Imaging Research Center at GIST. References
“Alzheimer’s disease facts and figures,”
Alzheimer’s Dementia, 8 131
–168
(2012). http://dx.doi.org/10.1016/j.jalz.2012.02.001 Google Scholar
I. Benilova, E. Karran and B. De Strooper,
“The toxic Aβ oligomer and Alzheimer’s disease: an emperor in need of clothes,”
Nat. Neurosci., 15 349
–357
(2012). http://dx.doi.org/10.1038/nn.3028 NANEFN 1097-6256 Google Scholar
D. M. Walsh et al.,
“Naturally secreted oligomers of amyloid beta protein potently inhibit hippocampal long-term potentiation in vivo,”
Nature, 416 535
–539
(2002). http://dx.doi.org/10.1038/416535a NATUAS 0028-0836 Google Scholar
E. D. Roberson et al.,
“Reducing endogenous tau ameliorates amyloid beta-induced deficits in an Alzheimer’s disease mouse model,”
Science, 316 750
–754
(2007). http://dx.doi.org/10.1126/science.1141736 SCIEAS 0036-8075 Google Scholar
Z. Wu et al.,
“Tonic inhibition in dentate gyrus impairs long-term potentiation and memory in an Alzheimer’s disease model,”
Nat. Commun., 5 4159
(2014). http://dx.doi.org/10.1038/ncomms5159 NCAOBW 2041-1723 Google Scholar
S. Jo et al.,
“GABA from reactive astrocytes impairs memory in mouse models of Alzheimer’s disease,”
Nat. Med., 20 886
–896
(2014). http://dx.doi.org/10.1038/nm.3639 1078-8956 Google Scholar
M. Prince, M. Prina and M. Guerchet, World Alzheimer’s Report 2013, Alzheimer’s Disease International, London
(2013). Google Scholar
C. Catana et al.,
“PET/MRI for neurological applications,”
J. Nucl. Med., 53 1916
–1925
(2012). http://dx.doi.org/10.2967/jnumed.112.105346 JNMEAQ 0161-5505 Google Scholar
W. R. Zipfel, R. M. Williams and W. W. Webb,
“Nonlinear magic: multiphoton microscopy in the biosciences,”
Nat. Biotechnol., 21 1369
–1377
(2003). http://dx.doi.org/10.1038/nbt899 NABIF9 1087-0156 Google Scholar
R. S. Lim et al.,
“Multimodal CARS microscopy determination of the impact of diet on macrophage infiltration and lipid accumulation on plaque formation in ApoE-deficient mice,”
J. Lipid Res., 51 1729
–1737
(2010). http://dx.doi.org/10.1194/jlr.M003616 JLPRAW 0022-2275 Google Scholar
N. Billecke et al.,
“Chemical imaging of lipid droplets in muscle tissues using hyperspectral coherent Raman microscopy,”
Histochem. Cell Biol., 141 263
–273
(2014). http://dx.doi.org/10.1007/s00418-013-1161-2 HCBIFP 0948-6143 Google Scholar
Y. J. Lee et al.,
“Quantitative, label-free characterization of stem cell differentiation at the single-cell level by broadband coherent anti-Stokes Raman scattering microscopy,”
Tissue Eng. Part C, 20 562
(2014). http://dx.doi.org/10.1089/ten.tec.2013.0472 1937-3384 Google Scholar
T. T. Le, S. Yue and J.-X. Cheng,
“Shedding new light on lipid biology with coherent anti-Stokes Raman scattering microscopy,”
J. Lipid Res., 51 3091
–3102
(2010). http://dx.doi.org/10.1194/jlr.R008730 JLPRAW 0022-2275 Google Scholar
R. H. Christie et al.,
“Growth arrest of individual senile plaques in a model of Alzheimer’s disease observed by in vivo multiphoton microscopy,”
J. Neurosci., 21
(3), 858
–864
(2001). JNRSDS 0270-6474 Google Scholar
A. C. Kwan et al.,
“Optical visualization of Alzheimer’s pathology via multiphoton-excited intrinsic fluorescence and second harmonic generation,”
Opt. Express, 17 3679
–3689
(2009). http://dx.doi.org/10.1364/OE.17.003679 OPEXFF 1094-4087 Google Scholar
F. Légaré et al.,
“Towards CARS endoscopy,”
Opt. Express, 14 4427
–4432
(2006). http://dx.doi.org/10.1364/OE.14.004427 OPEXFF 1094-4087 Google Scholar
M. T. Myaing, D. J. MacDonald and X. Li,
“Fiber-optic scanning two-photon fluorescence endoscope,”
Opt. Lett., 31 1076
–1078
(2006). http://dx.doi.org/10.1364/OL.31.001076 OPLEDP 0146-9592 Google Scholar
S. Tang et al.,
“Design and implementation of fiber-based multiphoton endoscopy with microelectromechanical systems scanning,”
J. Biomed. Opt., 14
(3), 034005
(2009). http://dx.doi.org/10.1117/1.3127203 JBOPFO 1083-3668 Google Scholar
D. R. Rivera et al.,
“Compact and flexible raster scanning multiphoton endoscope capable of imaging unstained tissue,”
Proc. Natl. Acad. Sci. U. S. A., 108 17598
–17603
(2011). http://dx.doi.org/10.1073/pnas.1114746108 PNASA6 0027-8424 Google Scholar
E. R. Andresen et al.,
“Two-photon lensless endoscope,”
Opt. Express, 21 20713
–20721
(2013). http://dx.doi.org/10.1364/OE.21.020713 OPEXFF 1094-4087 Google Scholar
D. M. Huland et al.,
“In vivo imaging of unstained tissues using long gradient index lens multiphoton endoscopic systems,”
Biomed. Opt. Express, 3 1077
–1085
(2012). http://dx.doi.org/10.1364/BOE.3.001077 BOEICL 2156-7085 Google Scholar
E. Bélanger et al.,
“Live animal myelin histomorphometry of the spinal cord with video-rate multimodal nonlinear microendoscopy,”
J. Biomed. Opt., 17 021107
(2012). http://dx.doi.org/10.1117/1.JBO.17.2.021107 JBOPFO 1083-3668 Google Scholar
D. S. Choi et al.,
“High-speed imaging of broadband multiplex coherent anti-Stokes Raman scattering microscopy using a supercontinuum source,”
Jpn. J. Appl. Phys., 50 022401
(2011). http://dx.doi.org/10.7567/JJAP.50.022401 JJAPA5 0021-4922 Google Scholar
J. H. Lee et al.,
“Comparative study of breast normal and cancer cells using coherent anti-Stokes Raman scattering microspectroscopy imaging,”
Appl. Phys. Express, 5 082401
(2012). http://dx.doi.org/10.1143/APEX.5.082401 1882-0778 Google Scholar
J. H. Lee et al.,
“Rapid diagnosis of liver fibrosis using multiphoton nonlinear optical microspectroscopy imaging,”
J. Biomed. Opt., 18 076009
(2013). http://dx.doi.org/10.1117/1.JBO.18.7.076009 JBOPFO 1083-3668 Google Scholar
R. Galli et al.,
“Effects of tissue fixation on coherent anti-Stokes Raman scattering images of brain,”
J. Biomed. Opt., 19 071402
(2014). http://dx.doi.org/10.1117/1.JBO.19.7.071402 JBOPFO 1083-3668 Google Scholar
J. H. Dowson,
“A sensitive method for demonstration of senile plaques in the dementing brain,”
Histopathology, 5 305
–310
(1981). http://dx.doi.org/10.1111/his.1981.5.issue-3 HISTDD 1365-2559 Google Scholar
D. R. Thal et al.,
“UV light-induced autofluorescence of full-length abeta-protein deposits in the human brain,”
Clin. Neuropathol., 21
(1), 35
–40
(2002). CLNPDA Google Scholar
M. Diez et al.,
“Neuropeptides in hippocampus and cortex in transgenic mice overexpressing V717F beta-amyloid precursor protein-initial observations,”
Neuroscience, 100
(2), 259
–286
(2000). http://dx.doi.org/10.1016/S0306-4522(00)00261-X NRSCDN 0306-4522 Google Scholar
A. I. Duarte et al.,
“Insulin affects synaptosomal GABA and glutamate transport under oxidative stress conditions,”
Brain Res., 977 23
–30
(2003). http://dx.doi.org/10.1016/S0006-8993(03)02679-9 BRREAP 1385-299X Google Scholar
P. H. Axelsen, H. Komatsu and I. V. Murray,
“Oxidative stress and cell membranes in the pathogenesis of Alzheimer’s disease,”
Physiology, 26 54
–69
(2011). http://dx.doi.org/10.1152/physiol.00024.2010 PHYSCI 1548-9213 Google Scholar
R. W. Irwin et al.,
“Neuroregenerative mechanisms of allopregnanolone in Alzheimer’s disease,”
Front. Endocrinol., 2 117
(2012). http://dx.doi.org/10.3389/fendo.2011.00117 1664-2392 Google Scholar
T. Tomiyama et al.,
“A new amyloid beta variant favoring oligomerization in Alzheimer’s-type dementia,”
Ann. Neurol., 63 377
–387
(2008). http://dx.doi.org/10.1002/ana.v63:3 ANNED3 0364-5134 Google Scholar
|
||||||||||||||||||||||||||||||||||||||||


