
|
|
1.IntroductionSickle cell disease (SCD) is the most common hereditary blood disorder worldwide and causes a number of health complications including chronic pain, anemia, chronic infection, and stroke. It is caused by a single point mutation resulting in an amino acid substitution in the oxygen transport molecule hemoglobin (Hb) which, upon deoxygenation, polymerizes into rigid fibers that deform red blood cells.1,2 These deformed, or sickled, red blood cells (RBCs) have shortened circulation life, irregular surface properties, are mechanically inflexible, and are thought to contribute to clotting.2,3 Reliable DNA, biochemical, and cytological assays are routinely performed for initial diagnosis of the sickle cell mutation and to quantify the severity of anemia.4 Several studies have made efforts to quantify the differences between SCD that presents with severe recurrence of infection by analyzing leukocyte distributions, immune cell surface protein variations, and various cytokine and chemokine quantities in mice models as well in human samples.5–7 While these traditional analytical methods provide important insight into factors contributing to immune dysregulation, variations in symptom severity, and effectiveness of treatments,8 none of these biochemical/analytical methods can be performed in vivo or yield structural information regarding the physiological sources of dysfunction. Currently, there are no available biomarkers for SCD disease progression; therefore, finding a biomarker, even a semi-invasive one, would be useful for several key reasons. First, a fundamental understanding of SCD and its impact on immune function even in rodent models is still lacking. Therefore, the development of technologies and biomarkers to gain insight into the fundamentals of SCD is an important point of basic research. Further, it is difficult to determine the proper therapeutic intervention for patients with SCD. Hydroxyurea, one of the few therapies utilized, has several problems; including that it is successful in only of patients, is toxic and is difficult to optimally dose using the highest tolerated dose. Finding connections between what type of patient responds to hydroxyurea and biomarkers identified by in vivo studies could help to determine optimal dosing. Similarly, the only current cure for SCD is a hematopoietic stem cell transplant.9 However, this is a complex procedure that carries numerous risks, including possible graft-versus-host disease. Using multiphoton microscopy (MPM) to monitor the disease, first in models and potentially later in patients, to better determine high risk patients who might benefit most from such an extreme intervention, could be performed. Another key reason for MPM concerns sickle cell pain crises. These are one of the most challenging features of SCD for clinicians to manage, as they are nearly impossible to predict and are a major cause of morbidity in the SCD population. They are also responsible for many emergency department visits that are a factor in the high cost of the disease. If a method such as MPM could track oxygenation and sickling damage and predict when a crisis might occur, intervention with transfusions and analgesic therapy before the crisis became overwhelming might be attempted. Therefore, it is of value to develop methods that allow for in vivo monitoring of the disease in association with standard biochemical analysis to develop a full picture of the mechanisms of interest resulting in immune dysfunction in SCD as the disease progresses. This study proposes to monitor intrinsic and optically detectable disease markers in mouse models, which will provide insight into physical factors responsible for symptoms of SCD. MPM has found increasing value in recent years as a high resolution three-dimensional (3-D) imaging platform. In the case of two-photon excited fluorescence (TPEF), two photons, of frequency , are simultaneously absorbed to excite electronic states which decay radiatively re-emitting photons at , as well as nonradiatively along normal fluorescent decay paths. Emission is then quadratically dependent on excitation intensity, among other systems and sample parameters. Excitation primarily occurs at the focal spot and out of focus absorption is minimized reducing photobleaching and increasing penetration depths, lending MPM to be subject to 3-D imaging where the focus is raster scanned through a sample.10 Though extrinsic contrast agents can be used in MPM including fluorescein, rhodamine, and fluorescent proteins,11,12 MPM can also image intrinsic tissue TPEF. Several endogenous fluorophores have been characterized and have been used in the study of biological functions such as lung cancer and stem cell differentiation.13–19 Additionally, MPM systems can be used to detect other nonlinear optical signals such as second-harmonic generation (SHG), which is a result of a coherent frequency sum of electric field components generated via second-order nonlinear electric susceptibly term found in noncentrosymmetric, structured material, e.g., collagen.20–22 Though intrinsic fluorescence lacks specificity and is a major source of noise associated with the use of external fluorophores, there exist a number of naturally occurring fluorophores which can provide a good starting insight into the system of interest. Since intrinsic flourophore MPM imaging requires no stains or genetically modified animals to express fluorescent proteins, the intrinsic environment presents a notable advantage in simplicity. Additionally, imaging the intrinsic fluorescent background enables imaging tissue structure, redox state and metabolic activities,19 and a limited chemical-functional environment without having to alter the chemical or physical environment of the system. Therefore, MPM imaging of naturally occurring TPEF and SHG signals allows for simple and true in situ optical biopsy compatible with in vivo studies. However, to establish the usefulness of this technique, it is imperative to characterize the photophysics of fluorophores in tissue and associate them with relevant biological processes. Table 1 shows the summary of several known intrinsic fluorophores relevant to the study of SCD, the associated emission peak and some notes on the biological relevance of each.23 Table 1Summary of sickle cell disease (SCD) relevant fluorophores found in biological material.12,23,24
Given the readily available set of information through the study of the fluorophores listed in Table 1, MPM is well suited for in vivo applications where intrinsic emission can provide physiological information of an unaltered and unprocessed system. While there has been work pertaining to the feasibility of MPM in direct human applications, this work primarily focuses on the demonstration of MPM as a useful research tool in basic SCD model studies. Here, ex vivo, MPM imaging is demonstrated and endogenous distinctions between healthy and SCD tissue are identified. These newly identified intrinsic biomarkers can be mapped to physiological conditions and used in future work to image over the course of disease progression in vivo to study the impact on immune system functions. The intrinsic TPEF studied here is partially attributed to known intrinsic fluorophores such as cellular NADH and FAD, as well as heme and porphyrin molecules commonly found in higher concentrations in cellular repair and inflammation such as leukocyteas. Porphyrin molecules are also found in iron-binding complexes such as heme and ferritin containing hemosiderin deposits.25,26 Both porphyrins and iron complexes are expected to be found at higher concentrations in SCD spleen and emit at longer wavelengths than intrinsic cellular TPEF (i.e., 500–660 nm),18,27,28 and thus can be spectrally identified. These physiological features identified by optically sectioned intrinsic MPM in whole tissue are also identified and compared via traditional mechanical sectioning, chemical labeling, and optical microscopy. In Sec. 2, the methods concerning the mouse models, tissue preparation, imaging, image processing, and statistic calculations are detailed. In Sec. 3, the results of intrinsic emission spectra, initial tissue observations, and object analysis are reported. Section 4 discusses some of the results previously shown and Sec. 5 summarizes the conclusions made based on the results discussed as well as areas of future work. 2.Methods2.1.Mouse Models and Sample PreparationMice transgenic for all three human globin genes were utilized [B6;129-Hbatm1(HBA)Tow Hbbtm2(HBG1,HBB*)Tow/Hbbtm3(HBG1,HBB)Tow/J, Jackson Laboratory #013071].29 SCD mice exclusively expressed human sickle beta globin, alpha globin, and gamma globin. Littermate control mice or wild type (WT) exclusively expressed normal human beta globin, alpha globin, and gamma globin. Mice examined here ranged in age from 30 to 40 weeks. Younger mice (approximately 8 weeks) samples were analyzed, but found to already present splenic disruption which is not fully characterized here, but indicates that a proper disease progression study must be carried out at even earlier stages of development. Under IACUC protocol 100677-0516, animals were euthanized by ketamine-xylazine overdose and exsanguinated after becoming unresponsive to toe pinch. Additionally, it should be stated that no effort was made to distinguish between signals associated with SCD and those associated with hypoxia since hypoxia itself is associated with SCD in these models and in humans, and therefore, information gained from a study of hypoxia-induced biomarkers is important to understanding SCD. Four spleens from each tissue type, i.e., SCD and WT, were examined via MPM and two of the spleen samples from each sample type were histologically processed after MPM imaging. For MPM imaging, samples were placed, unstained and unprocessed, on coverslips in a pool of phosphate buffered saline to prevent drying while imaging and placed on the stage of the inverted microscope. Following MPM imaging, two spleen samples from each tissue type were prepared by standard histological methods (i.e., mechanical sectioning and staining) for white light microscopy. Tissues were fixed with 10% neutral buffered formalin and processed for paraffin wax embedding. Sections were cut in thick sections and stored at room temperature overnight for drying. The slides were then stained with hematoxylin and eosin (H&E). H&E slides are included in this study as a “gold standard” tissue analysis method for comparison with MPM. Additionally, histology slides were prepared to label iron deposits in tissue with Prussian Blue (PB) stain (Sigma Aldrich). Slides were deparaffinized and hydrated to distilled water. Immediately following hydration, the slides were incubated in working PB staining solution for 20 min at room temperature. The slides were then rinsed in several changes of distilled water and counterstained with nuclear fast red, cleared, and finally cover slipped using resinous mounting medium. PB slides were included in this study as a direct iron-complex detection method to compare with MPM objects. 2.2.Image and Spectra AcquisitionMPM imaging was performed on a Nikon A1R-MP Confocal system using a , 1.15 NA, water-immersion, or . 75 NA MIMM objective detecting 3 channels (Blue: , Green: , and Red: ) by Episcopic GaAsP PMTs. Excitation was performed at 800 nm at modest laser power levels (10–50 mW) generated by femtosecond pulsed Mai Tai HP DeepSee laser. An IR stop filter (680 nm short pass, OD 8+) was used to pass TPEF photons and reject reflected/scattered excitation light. Samples were excited at , corresponding to a maximum in the two-photon excited florescence rate as well as readily available pulsed laser. Three-channel imaging was performed with the following set of collection parameters: frame rate:, line averaging: , () frame size, equal detector gain and offset settings for each channel which are comparable to other intrinsic fluorescence MPM studies.18,19 To ensure that these parameters did not result in visible photo damage or photobleaching, single frames were imaged for several minutes (much longer than the typical acquisition time) and qualitatively assessed for decrease in brightness or tissue damage with time. Spectrum analysis was performed using 32-channel PMT collecting from 400 to 650 nm at a 10-nm wavelength resolution. Bright field imaging was performed on a Nikon 90i Upright with a , 0.75 NA objective to acquire () images. Postprocessing, e.g., file type conversion, object segmentation and analysis, pseudocoloring, cropping, z-stacking, intensity mapping, and spectrum smoothing, was performed on images and data after acquisition via MATLAB® (Mathworks, Natick, Massachusetts), ImageJ (NIMH, Bethesda, Maryland) and Imaris (Zurich, Switzerland). 2.3.Image Processing and Object SegmentationObjects which could be spectrally distinguished were segmented, and associated morphological properties were extracted by the following method. The algorithm employed for this task is summarized in Fig. 1. Raw image files (.ND2) were pseudo colored and scaled with proper pixel-per-micron scaling factors for analysis in ImageJ. The scaling factor for images acquired by MPM was and for images acquired by standard optical microscopy was . Thirty images from each of the three imaging modalities employed to image the two sample types were used for a total of 180 images processed by this procedure. Each RBG colored image was then transformed to LAB color space by the makecform and applycform functions where is the lightness of the pixel, is a number associated with a color on the magenta-green color scale, and is a similar number assigned to colors based on its position on the blue–yellow color scale. This allows segmentation by color while ignoring modest variations in intensity which may result from slight changes in acquisition parameters. The different colors present in the image are then clustered via a -means minimization algorithm with respect to square Euclidean distance. MPM and PB images were clustered well using only 5 colors and 6 repetitions, whereas H&E segmentation required 10 colors and 13 repetitions to achieve satisfactory color segmentation as summarized in Table 2. The distance between colors in LAB space between objects of interest in the H&E samples is smaller than that between colors for PB (which specifically stains iron blue for contrast) and MPM. Colors are segmented into individual images and viewable as RBG images. The images containing the color cluster of objects of interest are chosen for further processing based on the mean red (R), green (G), and blue (B) values of the cluster compared to the predetermined values of objects of interest. For example, clusters from an MPM dataset were automatically selected based on the highest R and lowest B of the mean cluster values. Selected cluster images are converted into black and white binary files where noise removal and other binary functions can be performed. Isolated objects of less than (scaled according to image type) in diameter were excluded as noise. The morphology of each connected component is extracted by the regionprops function and analyzed for statistical significance. Success in segmenting objects of interest was facilitated and visualized by highlighting connected components. Figure 2 graphically summarizes the image processing algorithm. Table 2Table summarizing color segmentation and cluster selection variables.
Fig. 1Process flow of color segmentation algorithm demonstrated on a single frame of sickle cell disease (SCD) splenic tissue. The original image is segmented using a -means clustering method in which the RGB images are converted into LAB color space and the square Euclidean distance between A and B points is minimized according to a given number of colors. The cluster containing the object of interest is selected using a previously determined set of color criterion and converted into a binary image. The connected components are analyzed for morphology of each object and labeled in the original image with highlighting to facilitate analysis of the accuracy of the segmentation process. Object densities are computed using appropriate scaling factors. Images are then zoomed and crop for convenient viewing.  Fig. 2Emission spectra of SCD tissue and common intrinsic fluorophores. NADH, FAD, and bilirubin are shown in solid lines as reported in Refs. 12 and 24 and experimentally measured intrinsic emission spectra of bulk tissue relevant to sickle cell disease are shown in dashed lines. While NADH and FAD are thought to be the dominant contributors of autofluorescence in tissue, two-photon excited fluorescence (TPEF) of spleen tissue excited by 800 nm (green dashed) light is a combination of multiple fluorophores partially explained by FAD, small regions of long-wave emission (maroon dashed) and intrinsic emission of splenic pulp (blue dashed). The emission spectra of extracted and solid hemin (purple dashed) also present with a unique fluorescence spectra similar in trend to the spectra of long-wave emission nodules.  2.4.Computations and Statistical MethodsAll statistics reported here are computed using built in MATLAB functions. The densities reported in Sec. 3.3 were based on object counts per frame, converted into objects per area reported in square mm and averaged over several frames belonging to the same individual sample. To determine the statistical significance of resulting densities, test2 was used to compare the mean density vectors of each tissue type imaged by MPM without assuming equal variances. The results of the two- sample test determine acceptance or rejection of the null hypothesis, which states that two independent samples come from distributions with equal means. A here has been used to indicate significant difference. To identify these spectral features, spleens from four WT and four SCD mice were imaged at unique locations throughout the intact spleen by MPM. Two of the WT and two of the SCD spleens were then mechanically sectioned and stained with PB and H&E and imaged by standard microscopy. A total of 180 images, i.e., two sample types imaged by three imaging methods, were processed by the method described in Sec. 2.3 to generate the densities presented in Sec. 3.3. 3.Results3.1.Intrinsic Emission in Splenic TissueFor the study of SCD, splenic tissue was chosen as it known to be compromised by SCD and is important to immune system function, serving as a blood filtration organ that surveys circulating blood for evidence of pathogens.6,30,31 Importantly, the spleen suffers severe damage in SCD, with accumulation of tissue damage and autoinfarction leading to functional asplenia in most adults with SCD. In Fig. 2, the normalized emission spectra of known intrinsic fluorophores and the measured spectra of splenic tissue are presented. While NADH and FAD are considered to be the dominant fluorophores responsible for autofluorescence in most tissues, the emission of bulk splenic tissue presents as a combination of fluorescent emissions only partially explained by the presence of FAD and NADH. Figure 3 shows the example images of SCD spleen tissue and solid hemin both imaged by MPM. In splenic tissue, of note are the broad emission peaking at 550 nm and the long-wave emission growing at 650 nm as well as the clear SHG peak at 400 nm caused by connective tissues largely composed of structured collagen of the spleen outer capsule.32 Additionally, when the spectra are measured over smaller regions of interest that appear to be homogenous, indicated by colored arrows and boxes in Fig. 3, emission from these regions can be isolated as spectrally distinct. The long-wave emission of nodules found in spleen tissue is measured and shown as a dashed maroon line in Fig. 3. The emission spectra of solid hemin, an iron-binding heme compound, were also measured and are indicated in Fig. 2 with a dashed purple line. When the normal iron-storage mechanisms of ferritin are exceeded, iron will deposit adjacent to the ferritin-iron complexes in the cell. Histologically, these amorphous iron deposits are referred to as hemosiderin and though are chemically not well characterized, are thought to be composed of ferritin, denatured ferritin, other iron-binding heme complexes with similar structures as hemin, and other poorly defined materials.26 Fig. 3Characteristic multiphoton microscopy (MPM) images of intrinsic fluorescence in tissue. (a) Bulk spleen tissue of SCD mouse excited at 800 nm and (b) solid hemin with salt crystals. Colored box and arrows indicate regions correlated with spectra measured in Fig. 2. Green dotted box shows a region of representative bulk spleen tissue, maroon arrows show long-wave nodules, cyan arrows indicate splenic pulp regions, and purple arrows indicate deposits of solid hemin. Scale bar indicates . 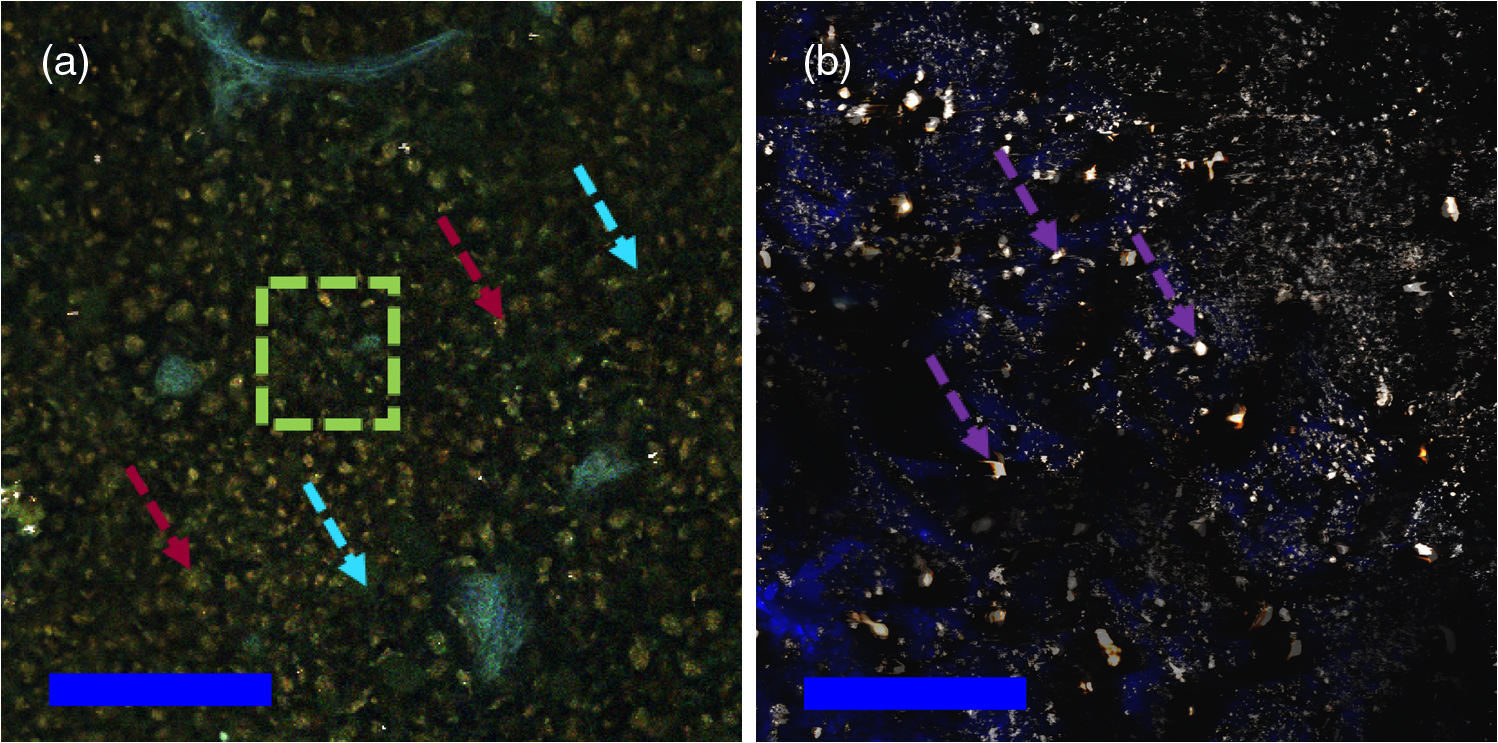 In order to further characterize the TPEF signals and the diagnostic relevance of MPM in the study of SCD, the samples were analyzed according to traditional biological methods to determine and identify specific observed optical signatures which can be used to study immune dysregulation in SCD. 3.2.Splenic Tissue in Sickle Cell DiseaseThe spleen is involved in filtering blood and red blood cells and represents an important immune organ.32 It has been suggested elsewhere6,7 that the spleen plays a significant role in the high incidence of chronic infection in SCD, and a deeper study of this organ may lead to answers concerning immune dysregulation. Macroscopically, even in young mice, the SCD spleen is greatly enlarged compared to WT spleen. However, the mechanisms by which this organ becomes less functional are unknown. MPM investigations could provide in vivo measurements of this system in order to begin identifying some of the mechanisms at the cellular and subcellular levels for splenic dysfunction. Figure 4 is an example of spleen tissue imaged first by MPM and then compared to PB and H&E stained slices of tissue in similar regions. These examples are representative of the dataset. SCD and WT images are shown for comparison. Though several potential optical biomarkers were observed, the distinction of disease-state tissue chosen to be analyzed further in this study is the notable increase of nodules of long-wave emission (Fig. 4 white arrowheads). The additional biomarkers include: higher fluorescence intensity in the SCD tissue, indicating higher cellular density; morphological features such as voids (Fig. 4 arrows); the demonstration of a higher degree of disruption of cellular organization; and higher hemosiderin deposition in SCD tissue. In order to analyze some of the features pointed out in this section, an object counting algorithm as described above was developed to segment objects by color for direct and repeatable object counting and morphological analysis. Fig. 4Comparison of (top) typical wild type (WT) and (bottom) SCD depth resolved splenic tissue (a, e) imaged by MPM and (b, f) single slices, (c, g) stained with Prussian blue (PB) and (d, h) stained with hematoxylin and eosin. Voids (white arrows) were observed in the SCD tissue. Nodules of long-wave emission (white arrowheads) were observed in both samples types, but at higher density in SCD samples compared to WT. In the histologically prepared slices, brown hemosiderin deposits (white arrowheads) and blue stained iron deposits (yellow arrowheads) were also observed and were suspected to be the same object identified as nodules of long-wave emission in MPM. Scale bar indicates . Rotating z-stacks of spleen tissue, (still shown on the left) are available as multimedia files. Video 1, (MPEG, 6568 KB) [URL: http://dx.doi.org/10.1117/1.JBO.20.6.066001.1] shows the WT, and Video 2 (MPEG, 4798 KB) [URL: http://dx.doi.org/10.1117/1.JBO.20.6.066001.2] shows the SCD.  3.3.Object AnalysisThe iron deposits, first spectrally distinguished, were analyzed and compared to iron deposits found via mechanical sectioning and optical microscopy methods. Objects identified as potential optical signatures associated with disease state were compared by basic morphological aspects. Figure 5 shows the representative results of the object segmentation algorithm described in Sec. 2.3. The cross-sectional area of the nodules of long-wave emission in MPM images of SCD tissue and the blue-stained iron deposits of PB images of SCD tissue were measured. The cross-sectional area of MPM long-wave nodules was determined to be and the area of PB stained iron deposits was found to be . Further, object densities were computed for each frame and individual sample densities were computed by averaging over several frames. Consistently, the mean object density in this exploratory population for SCD tissue by any imaging method was higher than densities computed for WT samples. The mean object densities for each mouse found for each imaging method are shown in Table 3. Fig. 5Examples of typical object segmentation results for each imaging method and tissue type. (b–l) Iron deposits are highlighted as such: (a–d) pink for MPM, (e–h) yellow for PB and (i–l) green for H&E. It can be seen from (b–l) the highlighted regions that the SCD (bottom of each block) image contains higher numbers of iron-complex deposits when compared with the WT (top of each block). Scale bars are .  Table 3Object densities computed for each sample according to imaging method. Densities are computed as the mean object density of several frames from each sample and reported as thousand objects per square mm along with standard error in parenthesis.
The significance of these results, including the spectral emission, size of objects and density of objects, is discussed further in the next section. 4.DiscussionDemonstrated here is the use of multiphoton microscopy and microspectroscopy in the investigative study of unlabeled SCD tissue. In this study, MPM spectral signals and images were compared with signals and images acquired via traditional histopathological methods, and a number of initial observations were established. Among the first signals to be observed, were regions of long-wave emission which were found to include aspects similar to the TPEF emission of hemin. The similarities between these two spectra suggest the compound responsible for the nodules observed in splenic tissue may be structurally similar to the iron binding porphyrin, hemin. Additionally, after the use of a color segmentation image processing algorithm, the objects found in MPM images were found to be similar in size to iron deposits found by PB, iron-specific staining. The density of these objects throughout spleen samples was computed from several measurements from a small population of SCD and WT mice, and it was generally found that SCD tissue presented with higher object densities than WT by both MPM and standard histological processing. This trend again indicates a likely relationship in the physiological structures observed by each method. Further, our results shown in a small sample size of individual mice () imaged by MPM, SCD tissue can be distinguished from WT mice (), and every SCD mouse exhibited MPM long-emission nodule , while every WT mouse had a nodule , suggesting that this signal can be used as an optical biomarker related to the disease state in future studies. This preliminary investigation demonstrates the utility of MPM in the research of SCD and provides a basis for future investigations including the full characterization of the TPEF emission spectrum of the nodules observed, an expansion of morphology comparisions, and a full morphology coorelation study as well confirmation of object density trends and coorelation between object densities found by traditional methods in larger sample sizes. Identification of this optical biomarker enables future studies to focus on questions concerning the mechanism and age at which this build-up of residual iron becomes detrimental. Given that the spleen is involved in red blood cell filtration and the known short lifetime of sickled red blood cells, these nodules may be the result of trapped RBCs or RBC breakdown products and a source of structure and functional disruption in SCD. RBCs may be accumulating without proper disassembly and processing by splenic macrophages, interfering with normal splenic function.33 5.Conclusions and Future WorkIn this exploratory investigation of SCD using MPM, diagnostically relevant signals were identified in the spleen. By comparing MPM imaging with conventionally prepared, mechanically sectioned, and stained spleen samples, the accumulation of iron or iron-binding complexes of heme-hemosiderin, which may be partially responsible for organ dysfunction, were identified as the possible sources of the signal observed by MPM. The origin of the signal is thought to be related to iron deposits and this claim is supported by (1) comparing the emission spectra to iron-binding hemin (2) comparing morphological characteristics between MPM and iron-complex labeled PB, and (3) by trends observed in object densities between SCD and WT tissue. Preliminary studies of the nodules of long-wave emission found by MPM show distinguishable densities between SCD and WT tissue even in small populations. This indicates that the nodules of long-wave emission may serve as a useful optical biomarker related to the disease state and can be further investigated to understand the impact on immune suppression and interaction with other mechanisms of SCD. Future studies aim to directly observe the progression of this splenic function disruption in developing and young ( weeks) mice models. It is also likely that an MPM exploration of other SCD-impacted tissues, such as blood, lymph, and brain, which are known to be compromised by SCD, will produce other intrinsic optical biomarkers useful to the understanding of SCD. Further evaluation of oxygen distribution using multiphoton fluorescent/phosphorescent lifetime imaging34–37 may also prove a useful research tool in understanding SCD mechanisms. This work might be implemented with endoscopic MPM techniques and evaluated for potential clinical studies,38–41 which may further provide answers and direct diagnostics for the SCD mechanisms and potential interventions. AcknowledgmentsThe authors would like to thank Dr. Suckow of the Notre Dame Freimann Life Science Center for histopathology assistance. BA was supported by a grant from the Connecticut Institute for Clinical and Translational Science. ReferencesQ. Yang and R. S. Olney,
“Sickle hemoglobin (Hb S) allele and sickle cell disease: a huge review,”
Am. J. Epidemiol., 151 839
–845
(2000). http://dx.doi.org/10.1093/oxfordjournals.aje.a010288 AJEPAS 0002-9262 Google Scholar
D. C. Rees, T. N. Williams and M. T. Gladwin,
“Sickle-cell disease,”
Lancet, 376 2018
–31
(2010). http://dx.doi.org/10.1016/S0140-6736(10)61029-X LANCAO 0140-6736 Google Scholar
O. Galkin and P. G. Vekilov,
“Mechanisms of homogeneous nucleation of polymers of sickle cell anemia hemoglobin in deoxy state,”
J. Mol. Biol., 336 43
–59
(2004). http://dx.doi.org/10.1016/j.jmb.2003.12.019 JMOBAK 0022-2836 Google Scholar
M. J. Stuart, R. L. Nagel and T. Jefferson,
“Sickle-cell disease,”
Lancet,
(2004). LANCAO 0140-6736 Google Scholar
J. A. Chiesand and N. B. Nardi,
“Sickle cell disease: a chronic inflammatory condition,”
Med. Hypotheses, 57 46
–50
(2001). http://dx.doi.org/10.1054/mehy.2000.1310 MEHYDY 0306-9877 Google Scholar
S. M. Szczepanek et al.,
“Splenic morphological changes are accompanied by altered baseline immunity in a mouse model of sickle-cell disease,”
Am. J. Pathol., 181 1725
–1734
(2012). http://dx.doi.org/10.1016/j.ajpath.2012.07.034 AJPAA4 0002-9440 Google Scholar
S. M. Szczepanek et al.,
“Transgenic sickle cell disease mice have high mortality and dysregulated immune responses after vaccination,”
Pediatr. Res., 74 141
–147
(2013). http://dx.doi.org/10.1038/pr.2013.85 PEREBL 0031-3998 Google Scholar
O. S. Platt et al.,
“Mortality in sickle cell disease—life expectancy and risk factors for early death,”
N. Engl. J. Med., 330 1639
–1644
(1994). http://dx.doi.org/10.1056/NEJM199406093302303 NEJMAG 0028-4793 Google Scholar
M. M. Hsieh et al.,
“Allogeneic hematopoietic stem-cell transplantation for sickle cell disease,”
N. Engl. J. Med., 361 2309
–2317
(2009). http://dx.doi.org/10.1056/NEJMoa0904971 NEJMAG 0028-4793 Google Scholar
A. Diaspro, G. Chirico and M. Collini,
“Two-photon fluorescence excitation and related techniques in biological microscopy,”
Q. Rev. Biophys., 38 97
–166
(2005). http://dx.doi.org/10.1017/S0033583505004129 QURBAW 0033-5835 Google Scholar
C. Xu and W. W. Webb,
“Measurement of two-photon excitation cross sections of molecular fluorophores with data from 690 to 1050 nm,”
J. Opt. Soc. Am. B, 13 481
(1996). http://dx.doi.org/10.1364/JOSAB.13.000481 JOBPDE 0740-3224 Google Scholar
C. Xu et al.,
“Multiphoton excitation cross‐sections of molecular fluorophores,”
Bioimaging, 4 198
–207
(1996). http://dx.doi.org/10.1002/1361-6374(199609)4:3<198::AID-BIO10>3.0.CO;2-X BOIMEL 0966-9051 Google Scholar
A. Pena et al.,
“Spectroscopic analysis of keratin endogenous signal for skin multiphoton microscopy: erratum,”
Opt. Express, 13 6667
(2005). http://dx.doi.org/10.1364/OPEX.13.006667 OPEXFF 1094-4087 Google Scholar
M. C. Skala et al.,
“Multiphoton microscopy of endogenous fluorescence differentiates normal, precancerous, and cancerous squamous epithelial tissues,”
Cancer Res., 65 1180
–1186
(2005). http://dx.doi.org/10.1158/0008-5472.CAN-04-3031 CNREA8 0008-5472 Google Scholar
N. D. Kirkpatrick et al.,
“Endogenous optical biomarkers of ovarian cancer evaluated with multiphoton microscopy,”
Cancer Epidemiol. Biomarkers Prev., 16 2048
–2057
(2007). http://dx.doi.org/10.1158/1055-9965.EPI-07-0009 CEBPE4 1055-9965 Google Scholar
T. Makino et al.,
“Multiphoton tomographic imaging: a potential optical biopsy tool for detecting gastrointestinal inflammation and neoplasia,”
Cancer Prev. Res. (Phila)., 5 1280
–1290
(2012). http://dx.doi.org/10.1158/1940-6207.CAPR-12-0132 CPRACC 1940-6207 Google Scholar
I. Pavlova et al.,
“Multiphoton microscopy as a diagnostic imaging modality for lung cancer,”
Proc. SPIE, 7569 756918
(2010). http://dx.doi.org/10.1117/12.841017 SPIECJ 0361-0748 Google Scholar
I. Pavlova et al.,
“Multiphoton microscopy and microspectroscopy for diagnostics of inflammatory and neoplastic lung,”
J. Biomed. Opt., 17 036014
(2012). http://dx.doi.org/10.1117/1.JBO.17.3.036014 JBOPFO 1083-3668 Google Scholar
W. L. Rice, D. L. Kaplan and I. Georgakoudi,
“Quantitative biomarkers of stem cell differentiation based on intrinsic two-photon excited fluorescence,”
J. Biomed. Opt., 12
(6), 060504
(2007). http://dx.doi.org/10.1117/1.2823019 JBOPFO 1083-3668 Google Scholar
P. J. Campagnola et al.,
“Second-harmonic imaging microscopy of living cells,”
J. Biomed. Opt., 6 277
–86
(2001). http://dx.doi.org/10.1117/1.1383294 JBOPFO 1083-3668 Google Scholar
P. Stoller et al.,
“Polarization-dependent optical second-harmonic imaging of a rat-tail tendon,”
J. Biomed. Opt., 7 205
–214
(2002). http://dx.doi.org/10.1117/1.1431967 JBOPFO 1083-3668 Google Scholar
E. Brown et al.,
“Dynamic imaging of collagen and its modulation in tumors in vivo using second-harmonic generation,”
Nat. Med., 9 796
–800
(2003). http://dx.doi.org/10.1038/nm879 1078-8956 Google Scholar
M.-A. Mycek and B. Pougue, Handbook of Biomedical Fluorescence, 231
–243 Marcel Dekker, Inc., Vol. 215, pp. 2003). Google Scholar
S. Devanesan et al.,
“Fluorescence spectral classification of iron deficiency anemia and thalassemia,”
J. Biomed. Opt., 19 027008
(2014). http://dx.doi.org/10.1117/1.JBO.19.2.027008 JBOPFO 1083-3668 Google Scholar
C. A. Finch,
“Iron metabolism: the pathophysiology of iron storage,”
J. Hematol., 5
(1950). JCHODP 0162-9360 Google Scholar
M. W. King,
“Porphyrin and heme metabolism,”
1452-8258 Google Scholar
W. R. Zipfel et al.,
“Live tissue intrinsic emission microscopy using multiphoton-excited native fluorescence and second harmonic generation,”
Proc. Natl. Acad. Sci. U. S. A., 100
(12), 7075
–7080
(2003). http://dx.doi.org/10.1073/pnas.0832308100 PNASA6 0027-8424 Google Scholar
A. C. Kwan et al.,
“Optical visualization of Alzheimer’s pathology via multiphoton-excited intrinsic fluorescence and second harmonic generation,”
Opt. Express, 17 3679
(2009). http://dx.doi.org/10.1364/OE.17.003679 OPEXFF 1094-4087 Google Scholar
T. M. Ryan,
“Knockout-transgenic mouse model of sickle cell disease,”
Science, 278 873
–876
(1997). http://dx.doi.org/10.1126/science.278.5339.873 SCIEAS 0036-8075 Google Scholar
E. J. Brown, S. W. Hosea and M. M. Frank,
“The role of the spleen in experimental pneumococcal bacteremia,”
J. Clin. Invest., 67 975
–82
(1981). http://dx.doi.org/10.1172/JCI110148 JCINAO 0021-9738 Google Scholar
A. Di Sabatino, R. Carsetti and G. R. Corazza,
“Post-splenectomy and hyposplenic states,”
Lancet, 378
(9785), 86
–97
(2011). http://dx.doi.org/10.1016/S0140-6736(10)61493-6 LANCAO 0140-6736 Google Scholar
R. E. Mebius and G. Kraal,
“Structure and function of the spleen,”
Nat. Rev. Immunol., 5 606
–616
(2005). NRIABX Google Scholar
C. E. Scott-Conner and J. B. Grogan,
“The pathophysiology of biliary obstruction and its effect on phagocytic and immune function,”
J. Surg. Res., 57 316
–336
(1994). JSGRA2 0022-4804 Google Scholar
V. Giorgi et al.,
“Combined non-linear laser imaging (two-photon excitation fluorescence microscopy, fluorescence lifetime imaging microscopy, multispectral multiphoton microscopy) in cutaneous tumours: first experiences,”
J. Eur. Acad. Dermatol. Venereol., 23
(3), 314
–316
(2009). http://dx.doi.org/10.1111/j.1468-3083.2008.03045.x JEAVEQ 0926-9959 Google Scholar
S. Sakadzić et al.,
“Two-photon high-resolution measurement of partial pressure of oxygen in cerebral vasculature and tissue,”
Nat. Methods, 7
(9), 755
–759
(2010). http://dx.doi.org/10.1038/nmeth.1490 1548-7091 Google Scholar
S. S. Howard et al.,
“Frequency-multiplexed in vivo multiphoton phosphorescence lifetime microscopy,”
Nat. Photonics Lett., 7 33
–37
(2012). http://dx.doi.org/10.1038/nphoton.2012.307 NPAHBY 1749-4885 Google Scholar
J. Spencer et al.,
“Direct measurement of local oxygen concentration in the bone marrow of live animals,”
Nature, 508 269
–273
(2014). http://dx.doi.org/10.1038/nature13034 NATUAS 0028-0836 Google Scholar
K. König et al.,
“Clinical two-photon microendoscopy,”
Microsc. Res. Tech., 70 398
–402
(2007). http://dx.doi.org/10.1002/(ISSN)1097-0029 MRTEEO 1059-910X Google Scholar
K. König,
“Clinical multiphoton tomography,”
J. Biophotonics, 1 13
–23
(2008). http://dx.doi.org/10.1002/(ISSN)1864-0648 JBOIBX 1864-063X Google Scholar
S. Tang et al.,
“Design and implementation of fiber-based multiphoton endoscopy with microelectromechanical systems scanning,”
J. Biomed. Opt., 14 034005
(2009). http://dx.doi.org/10.1117/1.3127203 JBOPFO 1083-3668 Google Scholar
D. R. Rivera et al.,
“Multifocal multiphoton endoscope,”
Opt. Lett., 37 1349
–51
(2012). http://dx.doi.org/10.1364/OL.37.001349 OPLEDP 0146-9592 Google Scholar
BiographyGenevieve D. Vigil completed her bachelor’s degree in electrical and electronic engineering from the University of Washington, Seattle, in June 2011. She spent a year researching technology for the developing world at Intellectual Ventures Inc. before embarking on a PhD at the University of Notre Dame in the Department of Electrical Engineering. She currently works as a member of the Biomedical Photonics Group, studying nonlinear optics for biology and medical applications. Alexander J. Adami previously attended Rensselaer Polytechnic Institute and is currently a trainee in the MD/PhD program at the University of Connecticut. Tahsin Ahmed completed his bachelor’s degree in electrical and electronic engineering from Bangladesh University of Engineering and Technology, Bangladesh, in 2009. He joined the University of Notre Dame in the Electrical Engineering Department as a PhD student in 2011. He is currently working in the Biomedical Photonics Lab, mainly engaged in the research of chip-to-chip optical coupling and label free mid-infrared detection of phospholipids. Aamir Khan attended NED University of Engineering and Technology for his undergraduate degree till 2007. Later, he attended Munich University of Technology for his master’s degree till 2010. Since 2011, his PhD research at the University of Notre Dame has involved developing two-photon probes for quantitative oxygen imaging in vivo. He received a graduate fellowship from the Berry Family Foundation in 2013 and currently serves as the treasurer of the SPIE student chapter at Notre Dame. Sarah Chapman has worked for the University of Notre Dame since 2004, first as a research technician and then as the histology imaging core program manager. Through the facility, she actively engages in a number of collaborative projects and has thus acquired broad experience in surgical techniques bench-top work for various biological and high-quality histological applications. Biree Andemariam is an academic hematologist/oncologist and director of the Adult Sickle Cell Clinical and Research Program at the University of Connecticut. Roger S. Thrall is a basic scientist, professor of immunology, who has progressed into translational and clinical research. He was fortunate to be awarded a grant from the Connecticut Department of Public Health in 2005 to perform a statewide needs assessment for individuals with sickle cell disease. Since that time, he has had continuous DPH support for a statewide SCD initiative and was also awarded a HRSA grant regarding individuals with sickle cell trait. Scott S. Howard is an assistant professor of electrical engineering at the University of Notre Dame. He received his PhD in electrical engineering from Princeton University in 2008 and was a postdoctoral research associate in applied and engineering physics at Cornell University until 2011. His work focuses on advancing high chemical, spatial, and temporal resolution imaging with specific interest in multiphoton, florescence lifetime, and mid-infrared imaging. |


