|
|
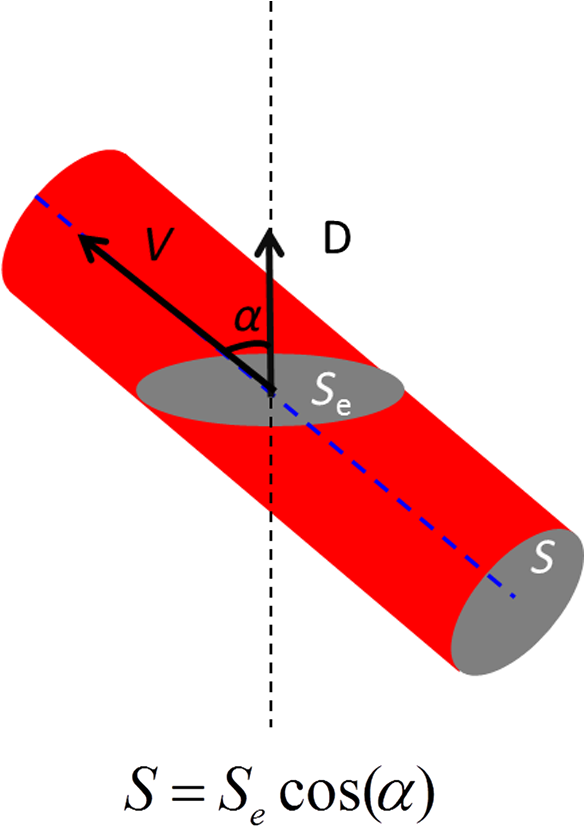
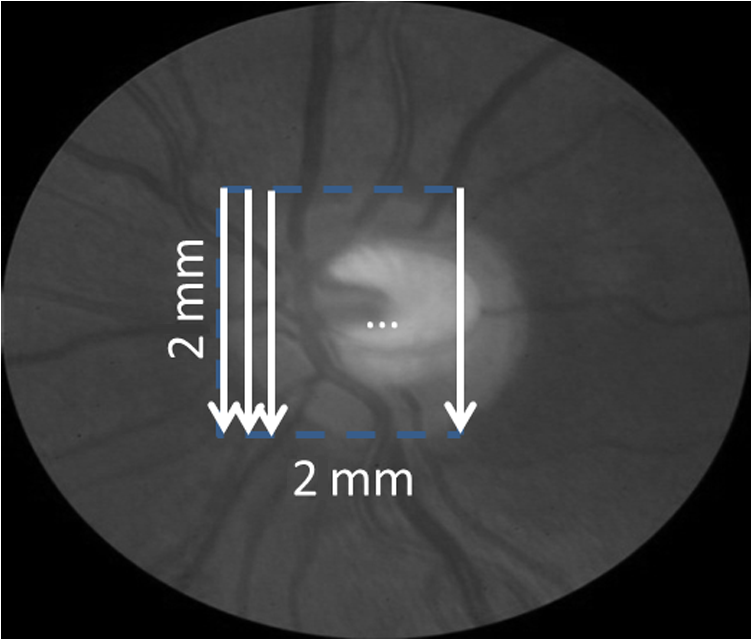
1.IntroductionRetinal blood flow is an important clinical parameter for the assessment of many ocular diseases, such as age-related macular degeneration, diabetic retinopathy, glaucoma, and retinal vein occlusions.1–8 Many techniques have been used for assessing ocular circulation, such as a laser Doppler flowmeter, fluorescein, indocyanine green angiographies, ultrasound color Doppler imaging, magnetic resonance imaging, and Doppler optical coherence tomography (OCT).9–19 Doppler OCT is of high clinical interest due to the widespread availability of OCT instrumentation in eye clinics. Doppler OCT detects Doppler shifts generated by light scattering particles. The Doppler shift is proportional to the axial component (parallel to the axis of beam propagation) of the velocity vector. In order to integrate flow in a blood vessel sectioned on an OCT B-scan, the angle between the OCT beam and the direction of blood flow is needed. This angle could be obtained by obtaining two or more cross-sectional images to establish the vessel orientation,20–28 but this introduces additional measurement error associated with the angle determination, such as error due to vessel detection or eye motion. Alternatively, a multibeam OCT with a known angular offset between beams could be used,28–33 but this requires special multibeam optics not available on commercial OCT instruments. To obviate the need for angle determination, one can employ high-speed three-dimensional (3-D) volumetric OCT and then integrate flow across an en face section of the blood vessel. The simplest en face approach would measure the central retinal veins and artery in the optic nerve head (ONH). However, these vessels have very high axial velocity and the Doppler shift would exceed the multiple phase wrapping limit (Doppler phase shift of more than between consecutive axial scans) unless very-high-speed (200 kHz or higher) OCT systems are employed.34–36 We would like to adopt the en face Doppler OCT approach using clinical retinal OCT systems currently on the market. Unfortunately, the fastest commercially available retinal OCT in the US is a 70-kHz spectral OCT system (RTVue-XR, Optovue, Inc., Fremont, California). This system is too slow to determine the Doppler phase shift of central retinal artery or vein due to the fringe washout and phase wrapping limits.37 Therefore, in this paper, we describe a more complex image processing approach that finds suitable branches of the retinal vein within the ONH, where the en face Doppler OCT flow measurement could be applied without exceeding the phase wrapping limit. The image processing algorithm overcomes problems with the oblique orientation and complex branching pattern of the retinal venous vascular tree. The automated algorithm outputs the total retinal blood flow (TRBF) based on a consecutive series of five volumetric Doppler scans obtained in 3.0 s. We tested the new algorithm in terms of repeatability and the ability to detect reduced TRBF in glaucomatous eyes, compared to age-matched normal control eyes. 2.Methods2.1.Theory of En Face Method for TRBF MeasurementThe theory of flow calculation using Doppler OCT and en face plane has been previously described.34,36 Briefly (Fig. 1), the Doppler phase shift is proportional to the axial component of velocity, or , where is Doppler phase shift, is velocity, and is the angle between the axial component and vessel. The true vessel area, which is perpendicular to the velocity vector in vessels, is equal to the product of vessel area in the en face plane and , or . Here, is the area of a vessel in the direction perpendicular to the vessel segment and is the area of the vessel in the en face plane. When we do the integration of V in , the two components cancel each other. Thus, blood flow in a vessel is proportional to the integration of Doppler phase shift in the vessel region and en face plane. 2.2.Doppler OCT and Scan PatternThe OCT system that we used in this study was RTVue-XR spectral OCT. RTVue-XR has a 70-kHz scan rate, a laser source with central wavelength of 840 nm and depth resolution. The phase wrapping velocity limit of RTVue-XR is using the formula and wavelength , refraction index and axial scan (A-scan) time interval . The highest blood velocity in the central retinal veins has been quoted as up to using ultrasound.38 Because the central retinal vein lies along the axial direction, the axial speed would exceed multiple phase wrapping limit of the 70-kHz OCT system. On the other hand, the average speed in peripapillary veins is 15 to as assessed by Doppler OCT.6,39 In this area, the vessels are closer to perpendicular to the axial direction. Thus, the axial speed in peripapillary veins might be too small to be measured precisely. Therefore, we targeted vein branches near the disc boundary, in which speeds are between peripapillary veins and center retinal veins. The axial speed in these branches can be reliably measured when the angle is appropriate in some en face planes. The scan pattern for TRBF measurement contained five volume scans covering area around the optic disc. The volume scan contained 80 B-scans and each B-scan contained 500 axial scans. The scan depth was 2.3 mm. The volume scan was repeated five times in the scan pattern and took 3 s to obtain (Fig. 2). 2.3.Doppler Phase Shift Calculation and Bulk Motion RemovalThe Doppler phase shift was calculated based on the phase-resolved technique.18,23 With a faster scan rate, the noise is more than last generation of RTVue system.40 In order to reduce the noise in OCT image, we applied the split spectrum method, which applied a filter bank to divide the full-spectrum fringe into different bands.41,42 The key of split spectrum method is to average Doppler phase shift in all bands and reduce the noise. The cost is lower depth resolution due to the smaller spectral bandwidth in each band. First, we generated the split spectrum by passing full-spectrum fringe through filter bank. Then, we applied the fast Fourier transform (FFT) transform to each band separately [Eq. (1)]: Here, is the spectrum obtained for ’th A-scan in k-space, is the ’th band pass filter, and is the complex signal of ’th band of the ’th A-scan. Doppler phase shift was then averaged in all bands and neighboring A-scans [Eq. (2)]: Here, is the Doppler phase shift of the ’th A-scan at depth position , ARG is a function to give the angle of a complex number, is the number of A-scans in the neighbor, is the number of bands, and is the time difference between ’th and ()’th A-scans. By averaging the A-scans and bands, the noise of the Doppler OCT image was reduced. Bulk motion due to eye movement along the depth direction was calculated and removed using the averaged Doppler phase shift of the static retinal tissue as the bulk motion induced phase shift. Here, a revised histogram estimation method for bulk motion was used.43 The original method calculated the histogram of the Doppler phase shift in static retinal tissue for an A-scan and used the value of the maximum bias bulk motion. In regions with less effective data points such as regions with large vessels and a thin retina, the method may not be precise. As each B-scan was acquired in less than 10 ms and the bulk motion changed gradually along the B-scan, a weighted polynomial fitting was applied on the bulk motion estimated by original method. To reduce error, weights were set to 0 for A-scans with less effective points. 2.4.Doppler Phase Shift Calibration ExperimentBeyond the phase wrapping limit, fringe washout reduces the OCT signal strength and increases phase noise. Therefore, phase-unwrapping algorithms often do not recover the full Doppler shift signal and have a tendency to underestimate flow speed. It has been reported that the relationship between Doppler shift obtained from the phase-unwrapping method and the actual speed was not perfectly linear.44 On the other hand, when the space interval between two consecutive axial scans increases, the correlation between two axial scans becomes weak and noise of the estimated Doppler phase shift increases. Therefore, the summation of Doppler phase shift in the vessel area will be smaller than the actual Doppler phase shift produced by blood flow. It was called the step-size factor and needs to be compensated.23 In this study, we compensated for both bias by empirical calibration using a physical flow phantom. A syringe was filled with fresh bovine blood (Animal Technologies, Inc., Tyler, Texas) and then pumped by a syringe pump (11 plus, Harvard Apparatus, Holliston, Massachusetts). The blood was pumped with a constant speed through a plastic tube with a inner diameter [Fig. 3(a)]. The tube was fixed in front of the OCT scanner. The angle between the tube and laser beam could be adjusted using an articulating base [SL20, Thorlabs, Inc., Newton, New Jersey, Fig. 3(b)]. An achromatic doublet (AC254-030-B, Thorlabs, Inc.) was placed between the OCT scanner and tube in order to focus the laser beam on to the tube. The same scan pattern described earlier for TRBF measurement was used to obtain the 3-D image of the tube. In the experiment, the pump flow rate was set to be , which correspond to an average velocity of in the tube. The speed was specifically chosen to simulate the blood flow rate in retina vessels inside optic disc. We first adjusted the vertical and horizontal position of the tube to center it with laser beam [Fig. 3(c)]. Then, we changed the incident angle from 0 to 18 deg with steps of 3 deg. The angle was limited to 18 deg because the reflectance signal is too weak due to fringe washout when the angle is larger than 18 deg. Fig. 3Flow phantom to calibrate Doppler phase shift and speed. (a) Flow phantom and OCT scanner; (b) articulating bases for rotation; (c) centration of OCT scan on tube of flow phantom (left: en face projection, right: a horizontal OCT scan at the center of 3-D scan pattern). (d) Parabolic distribution of blood flow in the tube. The velocity at the center of tube is about two times the overall average speed ; and (e) transverse position of three frames (or B-scans) and the corresponding cross-section image.  We used the same TRBF scan pattern for the phantom test in order to keep the same A-scan space interval as in vivo. Therefore, we need not consider compensation for the step-size factor after the calibration. The Doppler phase shift was calculated using the method described in the last section. Due the difference of reflectance index between air, tube, and blood, there is significant shape distortion at the edges of the tube where the incident angle is much larger than zero. To avoid this distortion, we only used the signal in the center of the tube, where the incident angle is close to 0 and the distortion is negligible. The flow in the tube followed a parabolic distribution [Fig. 3(d)] along the tube radial direction in theory. Therefore, the Doppler shift in the center of tube was larger than at the edges. We recalculated the theoretical average speed in the central region with radius to be . The average velocity was obtained by averaging the Doppler shift in the center part of tube in the Doppler OCT image. Image segmentation was applied on reflectance image to find the top position of tube on each B-scan. Then, we estimated the beam incident angle based on the 3-D orientation of the tube [Fig. 3(e)]. The phase unwrapping algorithm is used when it is necessary. The axial speed was then calculated based on the Doppler shift and estimated incident angle. 2.5.Pulsatility in VesselsPulsatility during the cardiac cycle makes the blood flow in the retina variable. To obtain repeatable TRBF, we needed multiple volumetric scans to match different time points in a cardiac cycle. It was difficult to obtain a high volumetric scan rate in the system used in this study. In order to cover the entire optic disc, the scan size needed to be about . We needed to limit the A-scan interval to ensure the correlation of neighboring A-scans and also to limit the B-scan interval to ensure that we included middle size vessels (). Based on these constraints, we chose a scan pattern with 80 B-scan A-scans, covering a area. The volumetric scan rate is 1.7 Hz. The pulsatility of an artery cannot be compensated with such a volumetric scan rate. We compared the pulsatility profile of a retinal artery and vein using a rapidly repeating circular scan. In this experiment, eyes were scanned by repeating circular scans with 1.5-mm diameter at 30 Hz. In each cross-sectional image, the Doppler phase shift in the artery and vein was summated in the vessel area and normalized by its own mean. The start position of each cardiac cycle was detected using the maximum change in artery flow profile. Then, the profile of all cardiac cycles was aligned and averaged. By this method, we get an average pulsatility profile of artery and vein in one cardiac cycle (Fig. 4). We found that the variance in an artery was quite large compared to its mean (), whereas the variance in a vein was relatively small compared to its mean (). Thus, the pulsatility variation can be compensated for if we measure only venous flow and average enough number of volumes. The slower flow speed in veins also caused less phase wrapping than in arteries. 2.6.Vessel Detection and Phase UnwrappingIn order to detect veins, we developed an automated algorithm [Fig. 5(a)]. First, the retina was detected based on the reflectance image [Fig. 5(c)]. A level-set method was applied to obtain a smooth binary retinal mask.45 If there was an extra tissue above the retina, the method sometimes created multiple regions that were not connected. Therefore, we classified the region with maximum volume as the retina. Next, vessels were detected as voxels with large Doppler phase shifts inside the retina mask. The threshold was defined as 2.33 times the standard deviation of Doppler phase shift in the static retinal tissue. A morphological operation was then used to exclude small regions and connect nearby regions in the vessel mask. Because spatial interval between two adjacent B-scans was , it was difficult to decide if a region with one to two pixels was noise or signal. Therefore, we removed any region with diameter [Fig. 5(e)]. Fig. 5Detection of veins in Doppler OCT image. (a) Flow chart for vessel detection; (b) Doppler phase shift and reflectance Image on one en face plane. The arrow is the direction of B-scans and A-scans. (c) Binary mask include retina; (d) masked Doppler OCT image using retinal mask; (e) vessel mask in one en face plane after vessel detection; (f) Doppler OCT image in Fig. 5(e) after phase unwrapping; (g) illustration of two types of vein classification rules: vein (class 1) is the vein inside the disc, vein (class 2) is the vein outside the disc. At depth showed in this figure, the en face plane cross with the vein twice; (h) two type of veins in same en face plane; and (i) veins (class 1) detected in one en face plane (blue circle).  Phase wrapping may change the sign of Doppler phase shift in the center of the vessel. Thus, an unsupervised phase unwrapping algorithm46,47 was applied before the vein and artery classification. The phase unwrapping algorithm was applied to the two-dimensional image in each en face plane separately. The phase unwrapping was only applied to pixels inside the retina mask [Figs. 5(d) and 5(f)]. After the vessels were detected and phase unwrapping algorithm was applied, veins and artery were classified. From the vessel mask, we excluded arteries and veins which were double counted in the same en face plane. Veins were identified as vessels with flow directing to the optic disc in the en face view. We illustrated the vessel type decision in Fig. 5(g). A typical vein had three segments D1 to D3 and the corresponding Doppler phase shifts were negative, close to 0, and positive. The algorithm in the previous paragraph detected two vessel segments: the first one corresponds to D1, or class 1, where the Doppler phase shift slope of vessel segment is negative; and the other one corresponds to D3, or class 2, where Doppler phase shift and slope of vessel segment is positive [Fig. 5(h)]. Vessel segment D2 cannot be detected because the Doppler phase shift is too weak. In arteries, vessel segment D1 had positive Doppler phase shift and negative slope of vessel segment, whereas vessel segment D3 has negative Doppler phase shift and positive slope of vessel segment. We only considered vessel segments with both negative Doppler phase shift and negative slope of vessel segment as valid venous masks for TRBF measurement [Fig. 5(i)]. 2.7.Multiple Planes En Face Doppler MethodDue to artifacts in spectral OCT (such as fringe washout, phase wrapping, or weaker reflectance in deeper tissue), it was difficult to find one artifact-free plane that includes all veins. To solve this problem, we determined an optimized en face plane for each vein branch and then summated the flow of all vein branches (Fig. 6). Fig. 6Illustration of multiple plane en face Doppler method. (a)—(c) Three en face planes were selected for comparison. Each vein had an optimized en face plane in which the Doppler phase shift was strong enough but without any artifact. Blue circle is the valid vein mask. Red circle means the particular vessel obtained higher flow measurement than other planes. (d) When two branches merged to one vessel in deeper en face plane, the summation of branches [indicated by the upper two circles in Fig. 6(a)] will be compared to the flow in the merged vessel [indicated by the blue circle in Fig. 6(d)].  We obtained the maximum blood flow on the optimized en face plane for a vein. On the other en face plane, artifacts will reduce the integration of Doppler phase shift in the vessel area and then create lower measurement than the optimized en face plane [Figs. 6(a)—6(c)]. TRBF was summated from the optimized value of each vein. If two vein branches merged to a root vein in deeper level, the summation of branches was compared to the flow in the root vein. Either root or branch veins are selected in the later depending on which one is larger [Fig. 6(d)]. To reduce the effect of cardinal pulsation, the TRBF is also averaged from all volumes in one scan. The pixel size of the en face plane is proportional to the axial length of the eye. Since axial length is variable, a compensation factor is necessary to correct TRBF using a default pixel size. The compensation factor , where is the axial length of the test eye and is the default axial length. We used in this study. This compensation method for vessel area was consistent to methods used in other imaging modalities.48 2.8.ParticipantsTo test the proposed TRBF measuring algorithm, participants were selected from functional and structural OCT for glaucoma study in Casey Eye Institute. The research protocol was approved by the institutional review boards at Oregon Health and Science University and carried out in accordance with the tenets of the Declaration of Helsinki. Written informed consent was obtained from each subject. In this study, normal participants had intraocular pressures of Hg for both eyes, a normal Humphrey Swedish Interactive Threshold Algorithm (SITA) 24-2 standard visual field with mean deviation (MD) and pattern standard deviation within 95% limits of the normal reference. They also had a glaucoma hemifield test within 97% limits, a central corneal thickness , a normal appearing ONH, a normal nerve fiber layer, an open anterior chamber angle as observed by gonioscopy, and no history of chronic ocular or systemic corticosteroid use. The glaucoma participants had at least one eye which had ONH or nerve fiber layer defects visible on slit-lamp biomicroscopy defined as one of following: diffused or localized rim thinning, disc (splinter) hemorrhage, vertical cup/disc ratio greater than the fellow eye by , or a notch in the rim detected on baseline dilated fundus examination and confirmed by masked reading of stereo disc photographs. People were not enrolled if they had other eye diseases, previous intraocular surgery, age or years, or best corrected visual acuity worse than 20/40. 3.ResultsIn the split spectrum algorithm for Doppler phase shift calculation, we set the number of A-scans to be averaged and the number of bands to be averaged in Eq. (2). For comparing, signal-to-noise ratio (SNR) was calculated for traditional full-spectrum algorithm and the proposed split spectrum algorithm. The SNR is the ratio between the average of Doppler phase shift in a vessel and the standard deviation of Doppler phase shift in the nonvessel static retinal tissue, where the Doppler phase shift was supposed to be zero due to lack of motion. The SNR of Doppler phase shift for split spectrum algorithm was larger than traditional phase-resolved algorithm [7.9 versus 3.9; Figs. 7(a) and 7(b)]. The improvement of SNR was, however, at the cost of resolution in depth. The depth resolution using split spectrum method is comparing to original depth resolution. The reduction of depth resolution did not affect the blood flow calculation because blood flow was calculated in the en face plane. However, it may limit the selection of the proper en face planes. Fig. 7Comparing Doppler OCT image between full-spectrum phase resolution method and split spectrum phase resolve method. (a) Doppler OCT image using full-spectrum phase resolution method (cross section), signal to noise ratio (SNR) of Doppler phase and (b) Doppler OCT image using the split-spectrum phase resolution method (cross section), .  From the phantom experiment, we found a linear relationship between the Doppler phase shift and the flow speed when the absolute value of the phase shift was less than [Fig. 8(a)]. In Fig. 8(a), each data point corresponds to the average of Doppler phase shift in a cross-section plane of the center of the tube. The axial speed was calculated by * , where was estimated by the slope of a fitted line of detected center of tube in the 3-D volume. The speed corresponding to Doppler phase shift was , much larger than theoretical value of . This difference was possibly due to the larger A-scan space interval in the scan pattern (about ). When the Doppler phase shift was larger than , the distribution of data points became more scattered. A nonlinear fitting (red line) worked better than a linear fitting (blue line). In this study, we then used a nonlinear curve for transferring Doppler phase shift to speed [Fig. 8(b)]. Fig. 8Relation between Doppler phase shift and speed. (a) Fitting of estimated axial speed and averaged Doppler phase shift in the center of the tube; the blue line is the linear polynomial fitting [root measure square error ], and the red line is the quadratic polynomial fitting with . (b) Transformation between Doppler phase shift and speed.  The TRBF measurement algorithm was applied to 12 healthy and 12 glaucomatous participants. One eye was selected for each participant. The proposed scan pattern with five volumes was applied to the tested eye. Three scans were repeated for each eye. Then, the proposed multiple plane en face algorithm was applied for TRBF calculation. The average age was for healthy controls and for glaucomatous participants. The visual field MD was for healthy controls and for glaucomatous participants. The TRBF is for healthy control and for glaucomatous participants (). The intravisit repeatability (coefficient of variation) is 8.6% for healthy controls and 8.4% for glaucomatous participants. 4.DiscussionIn this study, we proposed an automated TRBF calculation algorithm based on the en face Doppler technique using a 70-kHz spectral OCT system. We used a flow phantom to calibrate the transformation between Doppler phase shift and speed. A multiple plane en face method was developed to calculate TRBF and avoid artifacts of fringe washout and phase wrapping in spectral OCT. Compensation of axial length was applied to exclude noise introduced by eye length. The result showed good repeatability and confirmed the reduced TRBF in glaucomatous eyes comparing to normal control eyes. The average value of for healthy participants is in the range from 35.6 to reported by previous publications that measured TRBF using OCT.6,24,28,31,35,36 The large difference between previous studies is partly due to the compensation factors used in different methods. For example, a factor was used for compensation of decreasing Doppler phase shift due to step-size factor in Wang et al.23 In the phantom experiment, the scattered data points in the faster speed range [ to 30 mm, Fig. 8(b)] indicated that the flow in a vessel might be less reliable when Doppler phase shift was much larger than in the vessel region. However, the experiment also showed that faster speed in the axial direction ( or Doppler phase shift ) will cause significant fringe washout. Thus, Doppler phase shift will be in vessel area with good reflectance. Therefore, the optimized en face plane for each vessel is likely located at depth where there is no or little phase wrapping. One limitation of this study is that excluding small vessels () may slightly underestimate the TRBF in eyes with significant venous branching, particularly when the branching occurs in deeper layers of the retina. The second limitation is that the repeatability of the proposed method was limited by pulsatility. For people with heart rates close to volumetric repeat rate, the value of five volumes may come from the same phase of the cardiac cycle. One solution is to average results in multiple scans to get different phases of the cardiac cycle. Another solution is to synchronize the Doppler OCT scan with heart beat phase.49,50 5.ConclusionAn automated algorithm was proposed to measure TRBF using a commercially available 70-kHz spectral OCT. A multiple plane en face technique was applied to solve the problem of phase wrapping and fringe washout in the vessels near the disc border. Nonlinear calibration of Doppler phase shift, automated phase unwrapping, automated vessel detection, and vein classification were also applied to get precise blood flow results. Measurements of TRBF of normal and glaucomatous eyes showed that the proposed algorithm had acceptable repeatability and can be used in a large clinical study and clinical practice. AcknowledgmentsThis paper was supported by NIH Grants R01 EY023285, DP3 DK104397, and R01 EY024544, a grant from Optovue, Inc., and an unrestricted grant from Research to Prevent Blindness to Casey Eye Institute. Ou Tan received a patent royalty, grant support from Optovue, Inc., and a patent royalty from Zeiss Meditec, Inc. Yali Jia received a patent royalty and grant support from Optovue, Inc. David Huang received a patent royalty, stock options, and grant support from Optovue, Inc. He also received a patent royalty from Zeiss Meditec, Inc. Other authors do not have financial interest in the subject of this article. ReferencesT. A. Ciulla et al.,
“Ocular perfusion abnormalities in diabetes,”
Acta Ophthalmol. Scand., 80
(5), 468
–477
(2002). http://dx.doi.org/10.1034/j.1600-0420.2002.800503.x AOSCFV 1395-3907 Google Scholar
A. Harris et al.,
“Progress in measurement of ocular blood flow and relevance to our understanding of glaucoma and age-related macular degeneration,”
Prog. Retin Eye Res., 18
(5), 669
–687
(1999). http://dx.doi.org/10.1016/S1350-9462(98)00037-8 PRTRES 1350-9462 Google Scholar
L. Schmetterer and M. Wolzt,
“Ocular blood flow and associated functional deviations in diabetic retinopathy,”
Diabetologia, 42
(4), 387
–405
(1999). http://dx.doi.org/10.1007/s001250051171 DBTGAJ 0012-186X Google Scholar
J. Flammer et al.,
“The impact of ocular blood flow in glaucoma,”
Prog. Retin Eye Res., 21
(4), 359
–393
(2002). http://dx.doi.org/10.1016/S1350-9462(02)00008-3 PRTRES 1350-9462 Google Scholar
M. C. Grieshaber et al.,
“Retrobulbar blood flow in idiopathic dilated episcleral veins and glaucoma,”
Klin. Monbl. Augenheilkd., 224
(4), 320
–323
(2007). http://dx.doi.org/10.1055/s-2007-962946 Google Scholar
J. C. Hwang et al.,
“Relationship among visual field, blood flow, and neural structure measurements in glaucoma,”
Invest. Ophthalmol. Vis. Sci., 53
(6), 3020
–3026
(2012). http://dx.doi.org/10.1167/iovs.11-8552 IOVSDA 0146-0404 Google Scholar
M. T. Nicolela et al.,
“Ocular hypertension and primary open-angle glaucoma: a comparative study of their retrobulbar blood flow velocity,”
J. Glaucoma, 5
(5), 308
–310
(1996). http://dx.doi.org/10.1097/00061198-199610000-00004 JOGLES Google Scholar
J. Jonas et al.,
“Retinal vein occlusions,”
Dev. Ophthalmol., 47 111
–135
(2010). http://dx.doi.org/10.1097/APO.0b013e31827674a3 DEOPDB 0250-3751 Google Scholar
I. Kimura et al.,
“Scanning laser Doppler flowmeter study of retinal blood flow in macular area of healthy volunteers,”
Br. J. Ophthalmol., 87
(12), 1469
–1473
(2003). http://dx.doi.org/10.1136/bjo.87.12.1469 BJOPAL 0007-1161 Google Scholar
M. H. Cuypers, J. S. Kasanardjo and B. C. Polak,
“Retinal blood flow changes in diabetic retinopathy measured with the Heidelberg scanning laser Doppler flowmeter,”
Graefes Arch. Clin. Exp. Ophthalmol., 238
(12), 935
–941
(2000). http://dx.doi.org/10.1007/s004170000207 GACODL 0721-832X Google Scholar
M. T. Nicolela, P. Hnik and S. M. Drance,
“Scanning laser Doppler flowmeter study of retinal and optic disk blood flow in glaucomatous patients,”
Am. J. Ophthalmol., 122
(6), 775
–783
(1996). http://dx.doi.org/10.1016/S0002-9394(14)70373-3 AJOPAA 0002-9394 Google Scholar
R. W. Flower,
“Extraction of choriocapillaris hemodynamic data from ICG fluorescence angiograms,”
Invest. Ophthalmol. Vis. Sci., 34
(9), 2720
–2729
(1993). IOVSDA 0146-0404 Google Scholar
M. Venturini et al.,
“Monitoring of central retinal artery and vein with color Doppler ultrasound during heart surgery as an alternative to transcranial Doppler ultrasonography: a case report,”
J. Clin. Ultrasound, 42
(2), 112
–115
(2014). http://dx.doi.org/10.1002/jcu.22052 JCULDD 0091-2751 Google Scholar
P. Sorrentino et al.,
“Abnormally high resistive index of central retinal artery by ultrasound color Doppler in patients with viral chronic liver disease: correlation with worsening liver staging,”
Ultrasound Med. Biol., 30
(5), 599
–604
(2004). http://dx.doi.org/10.1016/j.ultrasmedbio.2004.02.011 USMBA3 0301-5629 Google Scholar
W. J. Lavery et al.,
“Magnetic resonance imaging indicates decreased choroidal and retinal blood flow in the DBA/2J mouse model of glaucoma,”
Invest. Ophthalmol. Vis. Sci., 53
(2), 560
–564
(2012). http://dx.doi.org/10.1167/iovs.11-8429 IOVSDA 0146-0404 Google Scholar
Y. Li et al.,
“Blood flow magnetic resonance imaging of retinal degeneration,”
Invest. Ophthalmol. Vis. Sci., 50
(4), 1824
–1830
(2009). http://dx.doi.org/10.1167/iovs.08-2188 IOVSDA 0146-0404 Google Scholar
R. Leitgeb et al.,
“Real-time assessment of retinal blood flow with ultrafast acquisition by color Doppler Fourier domain optical coherence tomography,”
Opt. Express, 11
(23), 3116
–3121
(2003). http://dx.doi.org/10.1364/OE.11.003116 OPEXFF 1094-4087 Google Scholar
Y. Zhao et al.,
“Phase-resolved optical coherence tomography and optical Doppler tomography for imaging blood flow in human skin with fast scanning speed and high velocity sensitivity,”
Opt. Lett., 25
(2), 114
–116
(2000). http://dx.doi.org/10.1364/OL.25.000114 OPLEDP 0146-9592 Google Scholar
X. Li, T. H. Ko and J. G. Fujimoto,
“Intraluminal fiber-optic Doppler imaging catheter for structural and functional optical coherence tomography,”
Opt. Lett., 26
(23), 1906
–1908
(2001). http://dx.doi.org/10.1364/OL.26.001906 OPLEDP 0146-9592 Google Scholar
S. Makita, T. Fabritius and Y. Yasuno,
“Quantitative retinal-blood flow measurement with three-dimensional vessel geometry determination using ultrahigh-resolution Doppler optical coherence angiography,”
Opt. Lett., 33
(8), 836
–838
(2008). http://dx.doi.org/10.1364/OL.33.000836 OPLEDP 0146-9592 Google Scholar
Y. K. Tao, K. M. Kennedy and J. A. Izatt,
“Velocity-resolved 3D retinal microvessel imaging using single-pass flow imaging spectral domain optical coherence tomography,”
Opt. Express, 17
(5), 4177
–4188
(2009). http://dx.doi.org/10.1364/OE.17.004177 OPEXFF 1094-4087 Google Scholar
Y. Wang et al.,
“In vivo total retinal blood flow measurement by Fourier domain Doppler optical coherence tomography,”
J. Biomed. Opt., 12
(4), 041215
(2007). http://dx.doi.org/10.1117/1.2772871 JBOPFO 1083-3668 Google Scholar
Y. Wang et al.,
“Retinal blood flow measurement by circumpapillary Fourier domain Doppler optical coherence tomography,”
J. Biomed. Opt., 13
(6), 064003
(2008). http://dx.doi.org/10.1117/1.2998480 JBOPFO 1083-3668 Google Scholar
Y. Wang et al.,
“Pilot study of optical coherence tomography measurement of retinal blood flow in retinal and optic nerve diseases,”
Invest. Ophthalmol. Vis. Sci., 52
(2), 840
–845
(2011). http://dx.doi.org/10.1167/iovs.10-5985 IOVSDA 0146-0404 Google Scholar
H. Wehbe et al.,
“Automatic retinal blood flow calculation using spectral domain optical coherence tomography,”
Opt. Express, 15
(23), 15193
–15206
(2007). http://dx.doi.org/10.1364/OE.15.015193 OPEXFF 1094-4087 Google Scholar
O. Tan et al.,
“Doppler optical coherence tomography of retinal circulation,”
J. Vis. Exp.,
(67), e3524
(2012). http://dx.doi.org/10.3791/3524 JVEOA4 1940-087X Google Scholar
Y. Wang et al.,
“Measurement of total blood flow in the normal human retina using Doppler Fourier-domain optical coherence tomography,”
Br. J. Ophthalmol., 93
(5), 634
–637
(2009). http://dx.doi.org/10.1136/bjo.2008.150276 BJOPAL 0007-1161 Google Scholar
C. Dai et al.,
“Absolute retinal blood flow measurement with a dual-beam Doppler optical coherence tomography,”
Invest. Ophthalmol. Vis. Sci., 54
(13), 7998
–8003
(2013). http://dx.doi.org/10.1167/iovs.13-12318 IOVSDA 0146-0404 Google Scholar
R. M. Werkmeister et al.,
“Bidirectional Doppler Fourier-domain optical coherence tomography for measurement of absolute flow velocities in human retinal vessels,”
Opt. Lett., 33
(24), 2967
–2969
(2008). http://dx.doi.org/10.1364/OL.33.002967 OPLEDP 0146-9592 Google Scholar
W. Trasischker et al.,
“In vitro and in vivo three-dimensional velocity vector measurement by three-beam spectral-domain Doppler optical coherence tomography,”
J. Biomed. Opt., 18
(11), 116010
(2013). http://dx.doi.org/10.1117/1.JBO.18.11.116010 JBOPFO 1083-3668 Google Scholar
V. Doblhoff-Dier et al.,
“Measurement of the total retinal blood flow using dual beam Fourier-domain Doppler optical coherence tomography with orthogonal detection planes,”
Biomed. Opt. Express, 5
(2), 630
–642
(2014). http://dx.doi.org/10.1364/BOE.5.000630 BOEICL 2156-7085 Google Scholar
C. Blatter et al.,
“Dove prism based rotating dual beam bidirectional Doppler OCT,”
Biomed. Opt. Express, 4
(7), 1188
–1203
(2013). http://dx.doi.org/10.1364/BOE.4.001188 BOEICL 2156-7085 Google Scholar
R. M. Werkmeister et al.,
“Measurement of absolute blood flow velocity and blood flow in the human retina by dual-beam bidirectional Doppler fourier-domain optical coherence tomography,”
Invest. Ophthalmol. Vis. Sci., 53
(10), 6062
–6071
(2012). http://dx.doi.org/10.1167/iovs.12-9514 IOVSDA 0146-0404 Google Scholar
V. J. Srinivasan et al.,
“Ultrahigh-speed optical coherence tomography for three-dimensional and en face imaging of the retina and optic nerve head,”
Invest. Ophthalmol. Vis. Sci., 49
(11), 5103
–5110
(2008). http://dx.doi.org/10.1167/iovs.08-2127 IOVSDA 0146-0404 Google Scholar
W. Choi et al.,
“Measurement of pulsatile total blood flow in the human and rat retina with ultrahigh speed spectral/Fourier domain OCT,”
Biomed. Opt. Express, 3
(5), 1047
–1061
(2012). http://dx.doi.org/10.1364/BOE.3.001047 BOEICL 2156-7085 Google Scholar
B. Baumann et al.,
“Total retinal blood flow measurement with ultrahigh speed swept source/Fourier domain OCT,”
Biomed. Opt. Express, 2
(6), 1539
–1552
(2011). http://dx.doi.org/10.1364/BOE.2.001539 BOEICL 2156-7085 Google Scholar
H. C. Hendargo et al.,
“Doppler velocity detection limitations in spectrometer-based versus swept-source optical coherence tomography,”
Biomed. Opt. Express, 2
(8), 2175
–2188
(2011). http://dx.doi.org/10.1364/BOE.2.002175 BOEICL 2156-7085 Google Scholar
R. F. Guthoff et al.,
“Doppler ultrasonography of the ophthalmic and central retinal vessels,”
Arch. Ophthalmol., 109
(4), 532
–536
(1991). http://dx.doi.org/10.1001/archopht.1991.01080040100037 AROPAW 0003-9950 Google Scholar
S. Srinivas et al.,
“Measurement of retinal blood flow in normal Chinese-American subjects by Doppler Fourier-domain optical coherence tomography,”
Invest. Ophthalmol. Vis. Sci., 56
(3), 1569
–1574
(2015). http://dx.doi.org/10.1167/iovs.14-15038 IOVSDA 0146-0404 Google Scholar
B. Vuong et al.,
“High speed, wide velocity dynamic range Doppler optical coherence tomography (Part IV): split spectrum processing in rotary catheter probes,”
Opt. Express, 22
(7), 7399
–7415
(2014). http://dx.doi.org/10.1364/OE.22.007399 OPEXFF 1094-4087 Google Scholar
Y. Jia et al.,
“Split-spectrum amplitude-decorrelation angiography with optical coherence tomography,”
Opt. Express, 20
(4), 4710
–4725
(2012). http://dx.doi.org/10.1364/OE.20.004710 OPEXFF 1094-4087 Google Scholar
J. Tokayer et al.,
“Blood flow velocity quantification using split-spectrum amplitude-decorrelation angiography with optical coherence tomography,”
Biomed. Opt. Express, 4
(10), 1909
–1924
(2013). http://dx.doi.org/10.1364/BOE.4.001909 BOEICL 2156-7085 Google Scholar
V. X. D. Yang et al.,
“Improved phase-resolved optical Doppler tomography using the Kasai velocity estimator and histogram segmentation,”
Opt. Commun., 208
(4–6), 209
–214
(2002). http://dx.doi.org/10.1016/S0030-4018(02)01501-8 OPCOB8 0030-4018 Google Scholar
J. Walther et al.,
“Signal power decrease due to fringe washout as an extension of the limited Doppler flow measurement range in spectral domain optical coherence tomography,”
J. Biomed. Opt., 15
(4), 041511
(2010). http://dx.doi.org/10.1117/1.3466578 JBOPFO 1083-3668 Google Scholar
T. F. Chan and L. A. Vese,
“Active contours without edges,”
IEEE Trans. Image Process., 10
(2), 266
–277
(2001). http://dx.doi.org/10.1109/83.902291 IIPRE4 1057-7149 Google Scholar
J. Strand, T. Taxt and A. K. Jain,
“Two-dimensional phase unwrapping using a block least-squares method,”
IEEE Trans. Image Process., 8
(3), 375
–386
(1999). http://dx.doi.org/10.1109/83.748892 IIPRE4 1057-7149 Google Scholar
J. Strand and T. Taxt,
“Two-dimensional phase unwrapping using robust derivative estimation and adaptive integration,”
IEEE Trans. Image Process., 11
(10), 1192
–1200
(2002). http://dx.doi.org/10.1109/TIP.2002.804567 IIPRE4 1057-7149 Google Scholar
D. F. Garway-Heath et al.,
“Measurement of optic disc size: equivalence of methods to correct for ocular magnification,”
Br. J. Ophthalmol., 82
(6), 643
–649
(1998). http://dx.doi.org/10.1136/bjo.82.6.643 BJOPAL 0007-1161 Google Scholar
T. Schmoll and R. A. Leitgeb,
“Heart-beat-phase-coherent Doppler optical coherence tomography for measuring pulsatile ocular blood flow,”
J. Biophotonics, 6
(3), 275
–282
(2013). http://dx.doi.org/10.1002/jbio.v6.3 JBOIBX 1864-063X Google Scholar
B. Lee et al.,
“Cardiac-gated en face doppler measurement of retinal blood flow using swept source optical coherence tomography at 100,000 axial scans per second,”
Invest. Ophthalmol. Vis. Sci.,
(2015). http://dx.doi.org/10.1167/iovs.14-16119 Google Scholar
BiographyOu Tan is a research assistant professor at the Oregon Health and Science University. He received his PhD degree in Biomedical Engineering from Zhejiang University, China, in 2000. He was a research assistant professor at the University of Southern California from 2004 to 2010. He is the author of more than 30 journal papers and has written four book chapters. His current research interests include automatic image analysis, structural and functional OCT analysis, retinal perfusion, glaucoma, and retinopathy. |