
|
|
1.IntroductionOne of the most commonly displayed clinical waveforms is the finger plethysmogram. It allows the noninvasive measurement of pulse wave amplitude, which reflects the changes in finger blood flow. It is usually recorded by a pressure sensor1 or a pulse oximeter, which illuminates the skin and measures changes in optical absorption.2–4 Optical plethysmography is widely available; its feasibility has even been demonstrated using mobile phones.5,6 However, it does not provide a spatially resolved image. This limitation can be overcome by signal processing of regular video recordings in ambient light for time-dependent spatial and color fluctuations enhancement.7–10 Other imaging approaches are designed to harness optical phase fluctuations of coherent laser light from the motion of body walls, either by single-point scanning detection,11 direct image detection of temporal12–14 and spatial speckle contrast,15,16 or holographic interferometry.17,18 We report on narrowband laser Doppler imaging of superficial pulsatile motion of the thumb by heterodyne holographic interferometry with a camera refreshed at 60 Hz. A transient blood flow interruption experiment in a healthy volunteer is performed and compared to blood pulse monitoring. A major advantage of this system is that no physical contact with the studied tissue surface area is required. This could allow assessment of nonintact skin or mucous membranes or even the intraoperative study of tissues within the surgical field. Moreover, the lack of surface contact reduces the risk of infection transmission, which is a true concern with reusable contact-requiring biomedical equipment,19 also avoiding the extra cost of disposable contact probes. 2.Experimental SetupThe experimental laser Doppler imaging scheme designed for this study is sketched in Fig. 1. The apparatus consists of a fibered Mach-Zehnder optical interferometer for off-axis20 and frequency-shifting21,22 holographic interferometry. The main optical radiation field is provided by a 150 mW, single-mode, fibered diode-pumped solid-state green laser (Cobolt Samba-TFB-150) at wavelength and optical frequency . The thumb is illuminated with of continuous optical power, over . In the reference channel, an optical local oscillator (LO) is formed by optical frequency shifting. Two acousto-optic modulators (Bragg cells, AA Opto Electronic), driven with phase-locked signals at and , are used to shift the optical frequency of the laser beam from to . The carrier frequency is set to 200 MHz, at the peak response of the fibered acousto-optic modulators. The backscattered optical field is mixed with the LO field with a nonpolarizing beam splitter cube. A Ximea MQ042MG-CM camera records interference patterns at a frame rate of . Each raw interferogram of , digitally acquired at time is noted . A small angular tilt between and ensures off-axis recording. The sensor is set away from the object plane. A convergent lens of 50 mm focal length is present in the object channel, in order to widen the lateral field of view of the holographic detection to . The backscattered laser optical field undergoes a phase variation , as a consequence of out-of-plane motion of the illuminated tissue. It is mixed with the LO field from the reference channel , which is tuned to a close-by intermediate frequency . The quantities and are complex constants and is the imaginary unit. The magnitude of a given optical Doppler component is retrieved by frequency downconversion within the camera’s temporal bandwidth, ensured by nonlinear detection of the field by the array of square-law sensors of the camera, which respond linearly with the optical irradiance . The squared magnitude of the total field received, , has cross-terms oscillating at the difference frequency of the fields and where is the heterodyne interferometric contribution, and denotes the complex conjugate. This equation describes the temporal fluctuation of the recorded irradiance at a given pixel.Fig. 1Sketch of the fibered Mach-Zehnder heterodyne holographic interferometer. The main laser beam is split into two channels. In the object channel, the optical field is backscattered by the skin. In the reference channel, the optical field is frequency-shifted by two Bragg cells by the quantity . A standard camera records interferograms of the diffracted fields and .  3.Signal ProcessingHolographic image rendering, or spatial demodulation, is then performed onto each recorded interferogram with a discrete Fresnel transform.23 In off-axis recording configuration, the Fresnel transform separates spatially the four interferometric terms of the right-hand term of Eq. (1).20,24 After spatial demodulation of each interferogram, the heterodyne signal appears in the off-axis region of the hologram, processed as follows. First, the squared amplitude of the difference of two consecutive off-axis holograms is formed in order to cancel very low frequency noise contributions . Then, to cancel laser intensity fluctuations, a normalization factor is formed. The contribution is measured in a region of interest of the reconstructed hologram where the terms of Eq. (1) are not present,25 and the brackets account for spatial averaging. In high heterodyne gain regime, i.e., when , the quantity is dominated by shot-noise of the LO,26,27 which scales up linearly with . The averaged signal scales up linearly with . Hence, the processed Doppler signal is a heterodyne measurement of the optical power (or irradiance) , which does not depend on the LO power.28 4.Narrowband Apparatus ResponseTwo-phase demodulation of interferograms recorded with a sampling frequency approximately equal to the reciprocal of the exposure time () results in a narrowband detection with an apparatus response plotted in Fig. 2. This response filters off optical contributions, which are not shifted in frequency, i.e., statically scattered light. For the backscattered field’s irradiance , this response is29,30 where is the apparent frequency recorded by the camera, as a result of heterodyne beating.Fig. 2Apparatus response [Eq. (2)], calculated for , versus apparent (beating) frequency index . The ticks of the horizontal axis correspond to the zeros of the response at integer values of the index of the beating frequency and the probed velocity .  Let us assume that at the short time scale of the sampling process , the local instant velocity is approximately constant; . In other words, its magnitude is identified to the time-averaged value of the instant velocity during , so we can simply write the local optical phase variation due to the transverse displacement of the skin as , when the illumination and the scattered wave vectors are perpendicular to the skin’s surface. The optical wave number is , and . Now let us consider temporal variations of the instant velocity of norm at long time scales . The light reflected by the skin undergoes a local time-dependent Doppler shift To assess a given instant velocity , the LO is detuned by . According to Eqs. (2) and (3), it results in the detection of Doppler-shifted light with a velocity-dependent efficiency . The range of probed velocities within the two first lobes of the apparatus response is 5.ExperimentAn experiment on the fingers of healthy volunteers undergoing arterial occlusion provoked with a pressure cuff was conducted. All the subjects were coauthors of the study. Internal review board approval and the requirement for informed consent were waived for this observational study. The pressure cuff was placed around the right arm. The cuff bladder pressure was measured using a transducer (MLT0670, ADInstruments, Oxford, United Kingdom). The signal was amplified, digitized at 200 Hz using an analog/digital converter (Powerlab; ADI Instruments), and recorded on a computer. The arterial pulse wave was monitored using a piezo-electric pulse transducer (TN1012/ST, ADInstruments) placed on the index of the imaged hand. The signal was recorded at 200 Hz. The thumb was illuminated by the green laser beam. A comfortable support for the forearm was used to avoid stray motion. A preliminary experiment was performed to monitor the Doppler response at three different detuning frequencies : 60, 600, and 1020 Hz; choosing a detuning frequency that is an integer number of times the sampling frequency is not mandatory, but has the advantage of canceling efficiently statically backscattered light, according to the apparatus response (Fig. 2). These frequencies correspond to probed velocities of 16, 160, and , respectively. Figure 3 shows plots over time of pulse waveforms (plethysmograms) and holographic Doppler signal (in dB) averaged in a region of interest, placed on the central part of the image of the thumb. At very low frequency detunings (), motion artifacts prevented the measurement of pulsatile motion. When the frequency was set to , which corresponded to a measurement range of instant velocities , centered at [Eq. (4)], the Doppler signal appeared to be less prone to motion artifacts. The Doppler signal at 1020 Hz recorded over , and composite images of the regionalized Doppler response (represented in red) are displayed in Fig. 4 and in Video 1. This value of the frequency shift was chosen for the blood flow interruption experiment, reported in Fig. 5. The cuff pressure and four indicators were monitored: pulse wave, 5 s-averaged pulse wave magnitude, Doppler signal, and 5 s-averaged Doppler signal. Blood flow to the forearm was occluded by increasing the cuff pressure to during an time interval. During occlusion, both recorded signals dropped. Short spikes due to motion artifacts were observed on the Doppler signal; they were more pronounced at a lower Doppler frequency. On releasing the cuff pressure, a transient increase of both the pulse volume and the Doppler signal is observed as expected, due to postocclusive hyperemia. A time-lapse sequence of the composite Doppler image of the thumb during the occlusion-reperfusion experiment is reported in Video 2. A limitation of holographic Doppler imaging of pulsatile blood flow with visible laser light is its sensitivity to low velocities, which enables motion artifacts to prevent the measurement of pulsatile motion, and requirement for stabilization of the monitored tissue. This issue might be alleviated with infrared light. Fig. 3Doppler signal [(a), (c), and (e)], averaged in the central part of the image of the thumb (Fig. 4), and concurrent blood volume signal [(b), (d), and (f)], versus time. Detuning frequencies: (a) , (c) , and (e) . The synchronization accuracy of holographic and standard blood volume measurements is on the order of . a.u., arbitrary units. 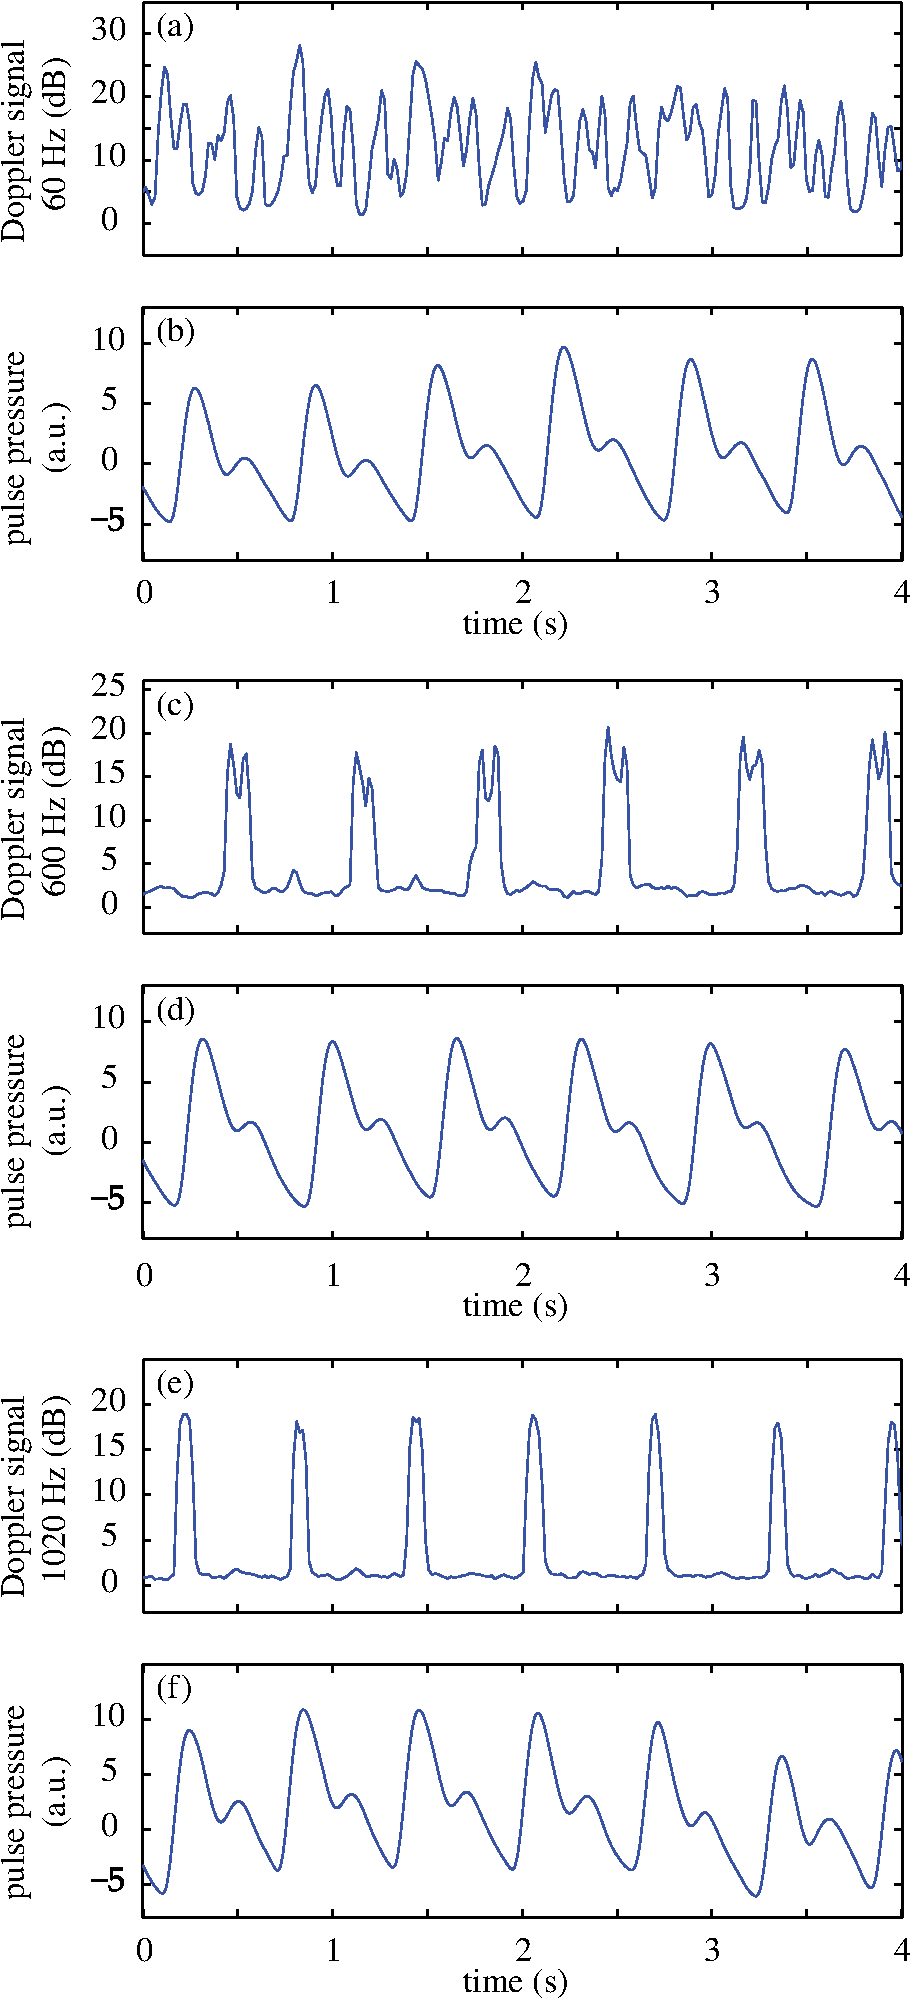 Fig. 4Optical Doppler signal, acquired for a detuning frequency , averaged in the region of interest depicted in (i), versus time. Composite images of the corresponding signal at (i) low and (ii) high signal level. Red color indicates signal presence. The whole sequence is reported in Video 1 (MOV, 2.45 MB) [DOI: http://dx.doi.org/10.1117/1.JBO.20.6.066006.1].  Fig. 5Time traces of indicators monitored during a hypoperfusion experiment. (a) Cuff pressure, plethysmogram [(b) raw data, (c) 5 s time-average of the magnitude], holographic laser Doppler signal recorded at 1020 Hz and averaged spatially in the nail area [(d) raw data, (e) 5 s time-average]. A time-lapse sequence of the composite Doppler image of the thumb is reported in Video 2 (MOV, 1.32 MB) [DOI: http://dx.doi.org/10.1117/1.JBO.20.6.066006.2].  6.ConclusionWe demonstrated wide-field imaging and monitoring of pulsatile motion of the thumb of a healthy volunteer. Narrowband optical Doppler video imaging in real time was performed with an off-axis and frequency-shifting holographic interferometer. Numerical image rendering was performed by discrete Fresnel transformation and two-phase temporal demodulation at a 60 Hz frame rate. The measured contrast was linked to the instant velocity of out-of-plane motion, of the order of a few hundreds of microns per second. Robust noncontact motion monitoring was achieved. This was illustrated by an occlusion-reperfusion experiment, in which the proposed detection scheme was compared to plethysmography. AcknowledgmentsWe gratefully acknowledge the contributions of Anna Kieblesz, Renaud Boistel, Aurore Bonnin, and Claude Boccara; and financial support from Agence Nationale de la Recherche (ANR-09-JCJC-0113, ANR-11-EMMA-046), Fondation Pierre-Gilles de Gennes (FPGG014), région Ile-de-France (C’Nano, AIMA), the Investments for the Future program (LabEx WIFI: ANR-10-LABX-24, ANR-10-IDEX-0001-02 PSL*), and the European Research Council (ERC Synergy HELMHOLTZ). ReferencesW. F. Ganong and K. E. Barrett, Review of Medical Physiology, McGraw-Hill, New York
(2005). Google Scholar
A. B. Hertzman and C. R. Spealman,
“Observations on the finger volume pulse recorded photoelectrically,”
Am. J. Physiol., 119 334
–335
(1937). AJPHAP 0002-9513 Google Scholar
J. Allen,
“Photoplethysmography and its application in clinical physiological measurement,”
Physiol. Meas., 28
(3), R1
(2007). http://dx.doi.org/10.1088/0967-3334/28/3/R01 PMEAE3 0967-3334 Google Scholar
A. A. Alian and K. H. Shelley,
“Photoplethysmography,”
Best Pract. Res. Clin. Anaesthesiol.,
(2014). http://dx.doi.org/10.1016/j.bpa.2014.08.006 1521-6896 Google Scholar
E. Jonathan and M. Leahy,
“Investigating a smartphone imaging unit for photoplethysmography,”
Physiol. Meas., 31
(11), N79
(2010). http://dx.doi.org/10.1088/0967-3334/31/11/N01 PMEAE3 0967-3334 Google Scholar
C. Scully et al.,
“Physiological parameter monitoring from optical recordings with a mobile phone,”
IEEE Trans. Biomed. Eng., 59
(2), 303
–306
(2012). http://dx.doi.org/10.1109/TBME.2011.2163157 IEBEAX 0018-9294 Google Scholar
C. Takano and Y. Ohta,
“Heart rate measurement based on a time-lapse image,”
Med. Eng. Phys., 29
(8), 853
–857
(2007). http://dx.doi.org/10.1016/j.medengphy.2006.09.006 MEPHEO 1350-4533 Google Scholar
L. Scalise et al.,
“Heart rate measurement in neonatal patients using a webcamera,”
in IEEE Int. Symp. on Medical Measurements and Applications,
1
–4
(2012). Google Scholar
H.-Y. Wu et al.,
“Eulerian video magnification for revealing subtle changes in the world,”
ACM Trans. Graph., 31
(4), 65
(2012). http://dx.doi.org/10.1145/2185520 ATGRDF 0730-0301 Google Scholar
G. Balakrishnan, F. Durand and J. Guttag,
“Detecting pulse from head motions in video,”
in IEEE Conf. on Computer Vision and Pattern Recognition,
3430
–3437
(2013). Google Scholar
T. J. H. Essex and P. O. Byrne,
“A laser Doppler scanner for imaging blood flow in skin,”
J. Biomed. Eng., 13
(3), 189
–194
(1991). http://dx.doi.org/10.1016/0141-5425(91)90125-Q JBIEDR 0141-5425 Google Scholar
M. Draijer et al.,
“Twente optical perfusion camera: system overview and performance for video rate laser Doppler perfusion imaging,”
Opt. Express, 17
(5), 3211
–3225
(2009). http://dx.doi.org/10.1364/OE.17.003211 OPEXFF 1094-4087 Google Scholar
M. Leutenegger et al.,
“Real-time full field laser Doppler imaging,”
Biomed. Opt. Express, 2
(6), 1470
–1477
(2011). http://dx.doi.org/10.1364/BOE.2.001470 BOEICL 2156-7085 Google Scholar
A. A. Kamshilin et al.,
“Variability of microcirculation detected by blood pulsation imaging,”
PloS One, 8
(2), e57117
(2013). http://dx.doi.org/10.1371/journal.pone.0057117 1932-6203 Google Scholar
D. A. Boas and A. K. Dunn,
“Laser speckle contrast imaging in biomedical optics,”
J. Biomed. Opt., 15
(1), 011109
(2010). http://dx.doi.org/10.1117/1.3285504 JBOPFO 1083-3668 Google Scholar
A. Humeau-Heurtier et al.,
“Skin perfusion evaluation between laser speckle contrast imaging and laser Doppler flowmetry,”
Opt. Commun., 291 482
–487
(2013). http://dx.doi.org/10.1016/j.optcom.2012.11.054 OPCOB8 0030-4018 Google Scholar
M. Leclercq et al.,
“Evaluation of surface acoustic waves on the human skin using quasi-time-averaged digital Fresnel holograms,”
Appl. Opt., 52 A136
–A146
(2013). http://dx.doi.org/10.1364/AO.52.00A136 APOPAI 0003-6935 Google Scholar
I. Dobrev et al.,
“Optimization of a lensless digital holographic otoscope system for transient measurements of the human tympanic membrane,”
Exp. Mech., 1
–12
(2014). http://dx.doi.org/10.1007/s11340-014-9945-4 EXMCAZ 0014-4851 Google Scholar
A. B. Hertzman,
“Photoelectric Plethysmography of the Fingers and Toes in Man,”
Exp Biol Med (Maywood), 37 529
–534
(1937). http://dx.doi.org/10.3181/00379727-37-9630 Google Scholar
E. N. Leith and J. Upatnieks,
“Reconstructed wavefronts and communication theory,”
JOSA, 52
(10), 1123
–1128
(1962). http://dx.doi.org/10.1364/JOSA.52.001123 JSDKD3 Google Scholar
C. C. Aleksoff,
“Time average holography extended,”
Appl. Phys. Lett., 14 23
(1969). http://dx.doi.org/10.1063/1.1652642 APPLAB 0003-6951 Google Scholar
A. Macovski,
“Efficient holography using temporal modulation,”
Appl. Phys. Lett., 14
(5), 166
–168
(1969). http://dx.doi.org/10.1063/1.1652759 APPLAB 0003-6951 Google Scholar
J. W. Goodman and R. W. Lawrence,
“Digital image formation from electronically detected holograms,”
Appl. Phys. Lett., 11
(3), 77
–79
(1967). http://dx.doi.org/10.1063/1.1755043 APPLAB 0003-6951 Google Scholar
E. Cuche, P. Marquet and C. Depeursinge,
“Spatial filtering for zero-order and twin-image elimination in digital off-axis holography,”
Appl. Opt., 39
(23), 4070
(2000). http://dx.doi.org/10.1364/AO.39.004070 APOPAI 0003-6935 Google Scholar
M. Atlan and M. Gross,
“Laser Doppler imaging, revisited,”
Rev. Sci. Instrum., 77
(11), 116103
(2006). http://dx.doi.org/10.1063/1.2370499 RSINAK 0034-6748 Google Scholar
M. Gross and M. Atlan,
“Digital holography with ultimate sensitivity,”
Opt. Lett., 32
(8), 909
–911
(2007). http://dx.doi.org/10.1364/OL.32.000909 OPLEDP 0146-9592 Google Scholar
M. Lesaffre, N. Verrier and M. Gross,
“Noise and signal scaling factors in digital holography in weak illumination: relationship with shot noise,”
Appl. Opt., 52
(1), A81
–A91
(2013). http://dx.doi.org/10.1364/AO.52.000A81 APOPAI 0003-6935 Google Scholar
C. Magnain et al.,
“Holographic laser Doppler imaging of microvascular blood flow,”
JOSAA,
(2014). http://dx.doi.org/10.1364/JOSAA.31.002723 JOAOD6 1084-7529 Google Scholar
M. Atlan et al.,
“Parallel heterodyne detection of dynamic light-scattering spectra from gold nanoparticles diffusing in viscous fluids,”
Opt. Lett., 35
(5), 787
–789
(2010). http://dx.doi.org/10.1364/OL.35.000787 OPLEDP 0146-9592 Google Scholar
N. Verrier, D. Alexandre and M. Gross,
“Laser Doppler holographic microscopy in transmission: application to fish embryo imaging,”
Opt. Express, 22
(8), 9368
–9379
(2014). http://dx.doi.org/10.1364/OE.22.009368 OPEXFF 1094-4087 Google Scholar
|


