
|
|
1.IntroductionHow to measure the human eye’s response to flashing light-emitting diodes (LEDs) has been a topic of debate, particularly in the transport industry, for more than a decade. Because of sustained interest, and as an introduction, some of the material here is a review of the fundamentals and what follows comprises an updated and expanded analysis of previous work in developing simplified photometric measurement techniques applicable to these sources.1 It is worth noting that solid-state lighting did not exist when the basic models now used to describe how it is seen were being developed. The desire to replace old high pressure gas strobe lights with more efficient flashing and continuous LEDs2,3 has clashed with a lack of understanding of how to incorporate the eye’s response to these sources. This is a particular concern when using LEDs as warning lights. The typical complaint even now is that light emitted from color LEDs is somehow fundamentally different from filtered light emitted from a Xenon flash lamp. To some extent, this is true in that the narrow spectral distribution of light emitted from many LEDs can often be approximated by a Gaussian line shape of about 15 to 30 nm full width at half maximum (FWHM). This is very different from Xenon flash lamps that have a highly structured spectrum spread from the ultraviolet to the near-infrared. The most practical and widely used methods for measuring the illuminance ( or lux) of the complex structure of Xenon flash lamps are to use a photometer or a power meter and a standard filter that matches the eye’s luminous efficiency curve. A method is presented here that does not require either for converting to photopic units of measurement. This conversion is necessary for ultimately calculating what is referred to as the effective luminous intensity (for flashing lights). In this work, the effective intensity (in lumens/sr) of interest is that perceived by the eye. It is assumed for all the calculations given in this report that the monitored spectral content of the source does not change faster than can be detected, from pulse to pulse or for the duration of any single pulse, which could be the case for some LED/spectrometer combinations and certainly is the case for many flash lamps. In addition to the eye’s spectral response, the eye’s temporal response to a flashing light source must also be incorporated if the effective intensity is to be measured. The response time of the eye must be accounted for to correct for the difference between a continuous source and a flashing source in terms of the perceived effective intensity. The primary requirement is that the sampling rate of the detector monitoring the source must be sufficient to adequately capture the pulsed waveform. For transportation-type signals, where LEDs are becoming common, these waveforms are of relatively long durations () and low repetition rates (), and thus are easily captured using currently available detectors. The model employed in the present analysis uses a simple exponential decay as the impulse response function of the eye. More detailed models have been proposed, but the leading exponential term seems to be common to all of them.4–6 2.Photopic Measurements of Light-Emitting DiodesDetermining the eye’s response to any constantly “on” visible light source, regardless of the spectral shape, can be achieved using a simple photodiode/detector with a known spectral responsivity, a measured spectrum (spectral irradiance versus wavelength) of the source, and the luminous efficiency of the eye. The irradiance of any source is the wavelength integration of the spectral irradiance (often abbreviated as ), such that7 where is the experimentally obtained spectral irradiance measurement provided by the spectrometer. A directly measured irradiance , which is taken with a separate calibrated (converting volts to watts) detector/voltmeter, contains the spectral responsivity of the detector, which must be accounted for as well, so thatBy combining Eqs. (1) and (2), an expression for the irradiance that incorporates the detector’s spectral response and the spectrometer data can be found: This requires three known or measured functions: which is the spectral irradiance taken with a spectrometer, which is independently measured or taken from the manufacturer’s calibration data, and which is measured with a calibrated power meter/detector. To convert from radiometric units () to photopic units, it is necessary to find the illuminance, (in ), which is the integral of the spectral irradiance weighted by the luminous efficiency of the eye. This can be rewritten in terms of measured parameters as before: If the spectral irradiance can be accurately measured, even for a spectrally broad source, then by incorporating the luminous efficiency of the eye and the separately measured irradiance, the illuminance can be determined. This still only requires a calibrated photodetector and either knowledge of or measurement of the detector’s spectral responsivity and the spectral irradiance of the source. In this way, using expensive and perhaps unavailable photometers or special photopic filters can be avoided for many photometric measurements. In the measurements presented here, a Newport model 1830C power meter/detector coupled to a Labview digital multimeter acquisition board (NI PCI 4060) was used for recording real-time measurements of the voltage signal from the detector, which was then converted into watts using a separately measured calibration curve. The multimeter was set to AC/DC voltage (2 V range) and took 60 measurements/second with a digit () accuracy.8 The National Institute of Standards and Testing (NIST) traceable data of the calibration curve for the silicon detector (Newport 818 SL, area sensor) is then used to convert the voltage signal to (irradiance).9 For acquiring , an Ocean Optics fiber coupled spectrometer (model 2000) and Labview data acquisition software (VI-DAQ version 2.4) were used.10 It is known that the function from thermal sources and high pressure flash lamps changes rapidly with temperature and can even change radically during a single pulse; hence, the spectrum was monitored in real time with the spectrometer and not simply recorded as a pre or postmeasurement calibration routine. Such changes in were not expected with the LEDs tested and were not observed. The pulse duration was long enough and the repetition rate slow enough that any significant change in the spectrum would have been observed with the spectrometer used. The irradiance/illuminance experiments reported here were performed over the span of a year in a light–tight vertical experimentation shaft with nonreflecting walls designed specifically for work of this type. When being tested, the sources were centered at the bottom of the shaft of approximately (floor space) and the detectors were centered 9 m above. Experiments were repeated and adjustments made until repeatable results (to within a few percent) were routinely obtained. 3.Approximating Photopic ResponseWhile a full calculation is always preferred, sometimes a quick estimate is possible (and sufficient) to convert measurements of a fairly narrow spectral source from radiometric to photopic units. In the case of LEDs, aside from the white light versions, most have a spectral distribution that can be approximated by a single Gaussian function, although a second-order Lorentzian is often used as well.11 An example of Gaussian spectral distribution obtained in this work is shown in Fig. 1. The shape and width of the spectrum is approximately that of readily available high quality single color LEDs.12 The red LEDs used in this work were obtained from Luxeon and produce 60 lumens when underdriven at 800 mA.13 Fig. 1The red curve is an example of a Gaussian spectrum centered at 500 nm, with a representative full width at half maximum (FWHM) of 30 nm. The blue curve is the Newport 818 SL silicon detector spectral response9 and the black curve is the 1988 CIE standard for the luminous efficiency.14 The square points are and appearing in Eq. (6) and are the values used in approximating the spectra with a delta function. 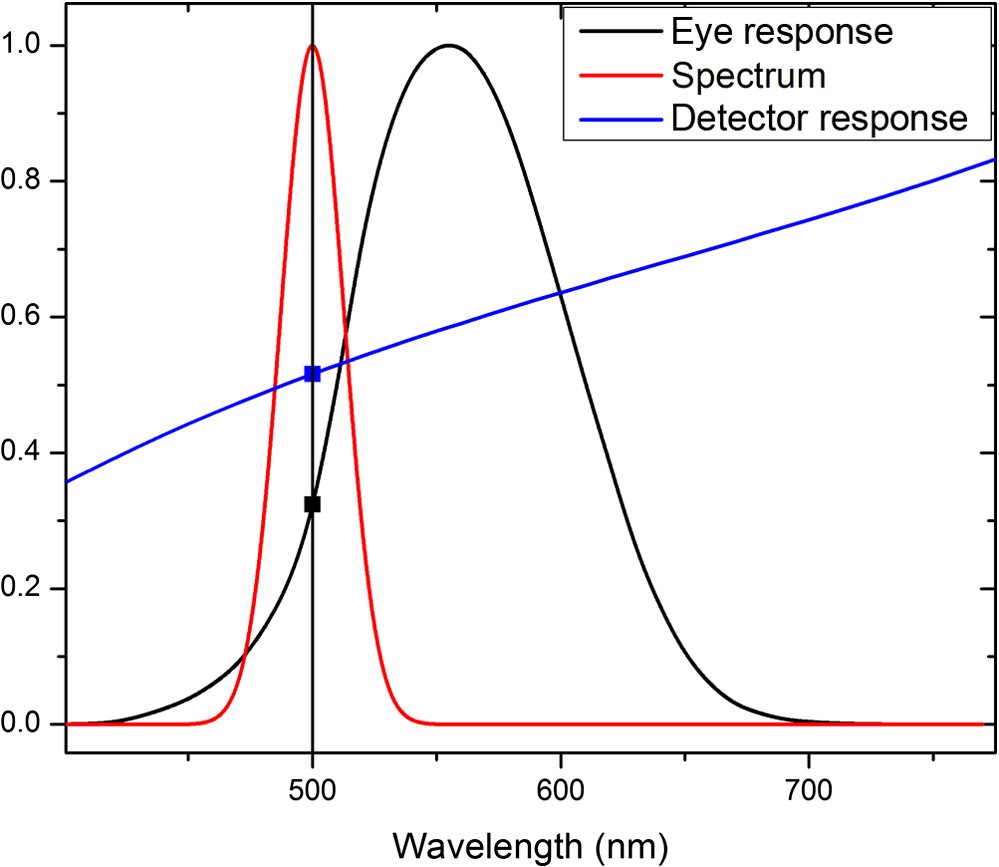 A convenient (and within limits, experimentally justifiable as demonstrated below) way to further approximate the photopic response is to replace with , where is the peak wavelength and is a constant which disappears with evaluation of the ratio of the integrals. This reduces Eq. (5) to a much simpler form: The numerical integration is eliminated and calculations only require the luminous efficiency and the detector’s response function value, both taken at the peak wavelength of the source. The usefulness of this approximation is assessed below by using experimental data fit to a normalized Gaussian profile as a starting point for simulating red LEDs of different FWHMs and different spectral peak locations from 425 to 675 nm. data for the detector and the 1988 CIE spectral data were used to complete the calculations. The resulting exact (nonapproximated) values from Eq. (5) were then compared over all peak wavelengths to the approximated values obtained using Eq. (6). The differences (in percent) are shown in Fig. 2 for a representative dataset. Notably, throughout the visible regions where the eye has the strongest response, the error is lowest. It is in the deep blue () and the deep red () ranges that the error becomes significant. Indeed, for a light source with less than 20 nm FWHM, the error remains below throughout the dominant portion of the eye’s response. For any of the simulated sources with an approximate Gaussian distribution, the error contributed by the responsivity of the detector is practically negligible due to the near perfect linearity of typical silicon detectors throughout the visible. The dominant portion of the error at wavelength extremes is likely due to the small and uncertain values of the function in those regions. Fig. 2Error introduced by approximating the light-emitting diode (LED) spectra (for Gaussian distributions with 10, 20, and 30 nm FWHM) with a delta function versus the peak wavelength of the associated Gaussian. For comparison, the green line is the error contributed by the detector’s response function alone for a Gaussian with a 30 nm FWHM. The gray regions are the areas where the eye’s response is less than 10%.  For results presented in this paper, the full form of Eq. (5) was used along with real-time monitoring of the spectrum to continuously calculate accurate photopic parameters. However, for quick estimates, the delta function approximation yields reasonably close results for narrow spectrum LEDs. 4.Flashing Light Emitting Diodes and Effective Intensity MeasurementsMeasuring the pulse envelope and convolving it with the eye’s response function predicts how the eye responds to the pulse—the effective luminous intensity. One method15 employs a form for the impulse response of the eye that fits directly into existing techniques for finding the effective intensity. Other techniques exploit the Blondel-Rey equation,16 the form factor method,17 and the Allard method.18 A recent investigation performed for the Federal Aviation Administration (FAA) concluded that any of the methods were applicable depending on the system being considered, and that the Blondel-Rey approach produced acceptable but conservative results.19 Another contemporary study concluded that a formulation based on the Blondel-Rey method was more predictive of judgments of overall visibility.20 However, incorporating any of these techniques into a measurement scheme requires either building an analog circuit that can perform the necessary convolution automatically or building software to perform the convolution. The latter is explored in this investigation with the aid of Labview for analyzing the experimental data. This method only requires a spectrometer and a photodetector/power meter capable of adequately sampling the pulse’s waveform. The fundamental interest here is in determining how the human eye responds to a flashing LED and simply measuring the eye’s response to a constantly “on” LED is not an accurate indication of how bright the eye will perceive a flashing source to be. While there are several different methods, as listed above, for calculating how the eye will respond to any given waveform of light, the method previously adapted by the FAA utilizes the Blondel-Rey equation and a simple integration technique.14 This method is accurate; however the modified Allard method,15 which is employed here, accommodates all waveform shapes and not just rectangular pulses, making it generally more useful for a variety of sources. The effective luminous intensity (in cd) perceived by the human eye is the convolution of the (unitless) impulse response function, with the irradiance, (divided by the solid angle subtended by the detector and multiplied by its area) produced by the light source: The quantity is the measured luminous intensity . Methods for determining were discussed in the previous two sections. The detector area in the present work is and it was located 9 m above the source, giving a solid angle of . The currently accepted response function, given in Eq. (8), is derived from a modified version of the Allard method as proposed by Ohno and Couzin.15 By recording the LED’s and calculating , the effective response of the eye to the flashing light source can be obtained through the convolution given in Eq. (7). A typical measured flashing LED waveform is given in Fig. 3 in red. The almost perfectly shaped square pulse is representative of hundreds of identical pulses (from single LEDs and arrays) generated during the course of this investigation. The modified Allard technique employed here, however, is applicable to any profile. The results of the calculated convolution of this LED’s square pulse, , with the eye’s response from Eq. (8), are given in Eq. (9) and plotted in blue in Fig. 3. Fig. 3Typical experimentally measured pulsed LED array luminous intensity is shown in red. The effective intensity, , is a plot of Eq. (9), and is shown in blue. Pulses are 200 ms wide and the repetition rate is 1 Hz.  The numerical factor is the average (over the five pulses shown in Fig. 3) of the instantaneous luminous intensity, , produced by the LED array during the 200 ms pulses and it is calculated using measured values of the irradiance (converted into illuminance); the sensor’s subtended solid angle and its area. Subtle variations in the pulse shape (if they existed) would not be apparent in these results after the convolution operation. Any absolute error can be attributed to the numerical values used in the eye response equation above. The error in using Eq. (8) is given by Ohno and Couzin to be about 5% when compared to the Blondel-Rey method if rectangular pulses (like those employed here) are assumed.15 For the LEDs used in this investigation, some of them were arranged as a visual signal for airplane anticollision purposes where the peak of during each optical pulse is the important feature to extract from the convolution. This peak should provide an essential figure of merit for the light source in many applications and it is straightforward to estimate for typical flashing sources that employ a simple “on-off” waveform. The source waveform can be represented by a true rectangle function of width for the first order estimating the eye’s response. The focus should be on in Eq. (9) since that choice produces the peak value of the function. The eye’s response to an ideal normalized square step function pulse of LED light is illustrated in Fig. 4 by plotting (the fraction of the square pulse of light actually seen) as a function of time. The value of chosen for this example is the average of the five instantaneous luminous intensity pulses shown in Fig. 3. Three key response levels are shown in Fig. 4 to illustrate how long a source would need to be “on” to be perceived at 25%, 50%, and 90% effective intensity. For this representative Luxeon LED arrangement, the effective intensity detected by the eye is within 10% of the source’s luminous intensity after about 1.4 s, which seems reasonable. 5.ConclusionPhotopic measurements of LEDs using commonly available radiometric power meters and spectrometers can be both accurate and equivalent to measurements with power meters/photopic filters or photometers. Using a delta function approximation of the LED’s spectral shape for quick estimations of the eye’s response to an LED (with a FWHM of 20 nm) results in only a error throughout the spectral range of interest. The ratio of the integrals in Eq. (5) can be calculated exactly to give even more accurate results at the cost of additional computation, but still with the savings of being able to use common radiometric equipment for photopic measurements. The goal of measuring the eye’s response to a flashing LED has also been realized through use of the modified Allard method and the simplified photopic measurement techniques developed here. Expedient methods for measuring flashing LEDs should prove especially useful for general human signaling purposes as industry moves from using gas flash lamps to LEDs.21 ReferencesD. A. Gregory, S. K. Medley and A. T. Roberts,
“Radiometry of flashing LED sources,”
Proc. SPIE, 7062 70621B
(2008). http://dx.doi.org/10.1117/12.795534 PSISDG 0277-786X Google Scholar
S. R. Forrest, D. D. C. Bradley and M. E. Thompson,
“Measuring the efficiency of organic light-emitting devices,”
Adv. Mater., 15
(13), 1043
–1048
(2003). http://dx.doi.org/10.1002/adma.200302151 ADVMEW 0935-9648 Google Scholar
K. Ikeda and M. Nakayama,
“Effective intensity of colored monochromatic flashing lights,”
J. Light Vis. Env., 30
(3), 156
–169
(2006). http://dx.doi.org/10.2150/jlve.30.156 JLEVDQ 0387-8805 Google Scholar
P. E. Hallett,
“Impulse functions for human rod vision,”
J. Physiol., 202 379
–402
(1969). http://dx.doi.org/10.1113/jphysiol.1969.sp008817 JPHYA7 0022-3751 Google Scholar
D. C. Burr and M. C. Morrone,
“Impulse response functions for chromatic and achromatic stimuli,”
J. Opt. Soc. Am. A, 10
(8), 1706
–1713
(1993). http://dx.doi.org/10.1364/JOSAA.10.001706 JOAOD6 0740-3232 Google Scholar
T. A. Busey et al.,
“Sensory and cognitive components of visual information acquisition,”
Psychol. Rev., 101
(3), 446
–449
(1994). http://dx.doi.org/10.1037/0033-295X.101.3.446 PSRVAX 0033-295X Google Scholar
W. McCluney, Introduction to Radiometry and Photometry, Artech House, Norwood, Massachusetts
(1994). Google Scholar
National Instruments online catalog,
(2015) http://www.ni.com/pdf/products/us/cat_NI4060.pdf March ). 2015). Google Scholar
Newport product information,
(2015) http://search.newport.com/?x2=sku&q2=818-SL%2FDB June ). 2015). Google Scholar
National Instruments online catalog,
(2015) http://www.ni.com/dataacquisition/nidaqmx March ). 2015). Google Scholar
S. Muthu, F. J. P. Schuurmans and M. D. Pashley,
“Red, green, and blue LEDs for white light illumination,”
IEEE J. Sel. Topics Quantum Electron., 8
(2), 333
–338
(2002). http://dx.doi.org/10.1109/2944.999188 IJSQEN 1077-260X Google Scholar
C. M. Talbot and R. H. Clifford,
“Characterization of light emitting diodes (LEDs) and compact fluorescent lamps (CFLs) by UV-Vis spectrophotometry,”
http://www2.shimadzu.com/applications/UV/VIS/SSI-Pittcon12-UV-001.pdf Google Scholar
C. F. Jones and Y. Ohno,
“Colorimetric accuracies and concerns in spectroradiometry of LEDs,”
in Proc. CIE Symposium 1999–1975 Years of CIE Photometry,
173
–177
(1999). Google Scholar
Y. Ohno and D. Couzin,
“Modified Allard method for effective intensity of flashing lights,”
in Proc. Commission Internationale de L’Eclairage 025 2003,
23
–30
(2002). Google Scholar
A. Blondel and J. Rey,
“Sur la perception des lumiéres bréves á la limite de leur portée,”
J. de Phys., 1 530
(1911). JOPQAG 0302-0738 Google Scholar
H. J. Schmidt-Clausen,
“Concerning the perception of various light flashes with varying surrounding luminance,”
(1968). Google Scholar
E. Allard, Mémoire sur l’Intensité et la Portée des Phares, Dunod, Paris
(1876). Google Scholar
C. Yakopcic et al.,
“Experimental effective intensity of steady and flashing light emitting diodes for aircraft anti-collision lighting,”
(2013). Google Scholar
J. D. Bullough, N. P. Skinner and R. T. Taranta,
“Characterising the effective intensity of multiple pulse flashing signal lights,”
Light. Res. Technol., 45
(3), 377
–390
(2013). http://dx.doi.org/10.1177/1477153512444494 LRTEA9 0024-3426 Google Scholar
A. J. Vingrys and B. L. Cole,
“Are color vision standards justified for the transport industry?,”
Ophthal. Physiol. Opt., 8 257
–273
(1988). http://dx.doi.org/10.1111/opo.1988.8.issue-3 OPOPD5 0275-5408 Google Scholar
BiographyAdam T. Roberts received his BS degree in physics from the University of Alabama in Huntsville and his PhD in optical science from the University of Arizona. His research was focused on ultrafast carrier dynamics in two-dimensional systems. Currently, he is employed at the US Army Aviation and Missile Research Development and Engineering Center, Redstone Arsenal, Alabama, where he pursues research in optics-related DOD programs. Stephanie K. Medley is a graduate of the University of Alabama in Huntsville, where she received her BS and MS (with thesis) degrees in physics. Her research was in the simulation of a miniature scanning electron microscope for future NASA missions. Currently, she is employed at Simulation Technologies in Huntsville, Alabama, where she performs radar and infrared simulations for civilian and DOD applications. Don A. Gregory is distinguished professor of physics at the University of Alabama in Huntsville. He has supervised the theses/dissertations of 47 graduate students and has been named outstanding teacher of the year. He has more than 130 publications in a variety of refereed technical journals and was a winner of the IEEE Fink prize for outstanding publication. Nilesh B. Dhote received his B E in electronics engineering from Nagpur University, India, and his MS degree in optics and photonics technology (with thesis) at the University of Alabama in Huntsville. Currently, he is employed as a lead research scientist at K-Sciences of Huntsville, where he performs research and development in optical sensor technologies. |


