
|
|
1.IntroductionThe rupture of atherosclerotic plaques is the leading cause of acute coronary events. The detection of lipid content and its distribution within the plaques is critical for identifying vulnerable plaques that are prone to rupture.1,2 Various imaging technologies, including x-ray angiography, computed tomography (CT) angiography, and magnetic resonance angiography, have been primarily developed to visualize the stenosis of coronary arteries. However, the accurate characterization of atherosclerotic plaques, in particular, the quantification and localization of lipids and inflammation, remains challenging. So far, intravascular imaging is regarded as the most accurate way for characterizing atherosclerotic plaques in vivo. Intravascular ultrasound (IVUS) can image both the lumen geometry and structure of the arterial wall with an imaging depth of and a resolution of .3 However, the sensitivity and specificity of IVUS for plaque composition differentiation is limited due to the relatively poor contrast derived from soft tissue types.4 Intravascular optical coherence tomography (IVOCT) offers a superior spatial resolution of , which has enabled the detection of thin fibrous caps, as well as high-resolution imaging of the lumen geometry and stents.5 However, the imaging depth of IVOCT is limited to , as it relies on ballistic photons to form an image; its chemical specificity is also limited, as the contrast primarily comes from backscattered photons. Recently, intravascular near-infrared spectroscopy technology has been developed which can identify the lipid content of plaques with high specificity; however, it lacks depth-resolved imaging ability, and is incapable of visualizing the lipid distribution within plaques.6 Photoacoustic imaging provides extremely high sensitivity (100% relative sensitivity) to optical absorption; utilizing multiwavelength laser excitation, spectroscopic intravascular photoacoustic (IVPA) imaging has demonstrated the capacity to image lipids’ distribution in atherosclerotic plaques with high specificity and sensitivity.7–12 To achieve accurate spectroscopic IVPA imaging, an ns-pulsed, wavelength tunable laser [e.g., optical parameter oscillator (OPO) or OPO laser] is critical. Regarding such a laser source, there are two interplay parameters that need to be considered. On the one hand, to generate well-detectable photoacoustic signals, sufficient laser pulse energy is required. On the other hand, to enable high-speed imaging, a high pulse repetition rate is needed. In previously reported IVPA systems, laser pulse energy in the order of mJ was usually required to produce decent photoacoustic signals.13–15 Hence, if multiple wavelengths (at either the 1.2 or band) were needed to perform accurate spectroscopic imaging, the choices of laser sources were usually limited to OPO lasers of a pulse repetition rate of 10–20 Hz. The B-scan rate at a single wavelength with such lasers was 10–20 s/f (assuming 200 A-lines/B-scan); for spectroscopic IVPA imaging, the image acquisition would take several times longer. For in vivo applications, such a slow imaging speed would lead to serious motion artifacts and result in insufficient imaging length of vessels within a clinically acceptable time period. Overall, the imaging speed is becoming one of the major challenges for translating IVPA into clinical studies. Recently, an IVPA imaging system of a 2-kHz A-line rate has been developed with a home-made Raman-shift laser operating at 1197 nm.16 This work represents a significant step forward for realizing high-speed IVPA imaging. However, the system provided only a single wavelength for IVPA imaging, while more wavelengths are usually needed to enable truly accurate spectroscopic IVPA imaging of lipid. In our study, a high-speed IVPA system capable of multiwavelength spectroscopic photoacoustic imaging was developed. To increase the laser fluence in the targeted imaging region, we designed and implemented a quasifocusing light illumination scheme. With this design, the laser energy required for exciting well-detectable photoacoustic signals was greatly reduced (to . As a result, for the first time to our knowledge, a ns-pulsed OPO laser with a high-repetition rate (1 kHz) and a widely tunable wavelength range can be employed to enable high-speed spectroscopic IVPA imaging. For imaging at each wavelength, a B-scan rate up to 5 Hz (200 A-lines/B-scan) was achieved, orders of magnitude faster than conventional IVPA systems operating at a similar wavelength tuning range. In addition, multiwavelength (five wavelengths) spectroscopic IVPA imaging of both a lipid-mimicking phantom and peri-adventitial adipose tissue from a porcine vessel was demonstrated at both the and spectral bands. These demonstrated results suggest that the developed high-speed IVPA technology is of great potential to be further translated for in vivo applications. 2.Methods2.1.System ArchitectureFigure 1 illustrates the overall architecture of the high-speed IVPA system which can perform both IVPA and IVUS imaging. A ns-pulsed OPO laser (EKSPLA, NT242) with a repetition rate of 1 kHz, operating at a tunable wavelength ranging from 1185 to 1235 nm (a lipid absorption band), was used for photoacoustic excitation. The pump source in NT242 is a diode-pumped solid–state Q-switched laser operating at 1064 nm. Upon third harmonic generation, the ultimate pump energy is about 3.5 mJ at 355 nm (used as the pump wavelength for the entire wavelength tunable band). The efficiency of the OPO crystal is about 4% at 1210 nm. The output laser beam was reshaped by an iris, attenuated by a neutral density filter, and then focused by a condenser lens into the multimode fiber (Nufern, MM-S105/125-22A) of the catheter. A photodiode (PD) (Thorlabs, SM05PD4A) was used to record the fluctuation of the laser pulse energy for fluence compensation during postexperiment data processing. The laser pulse energy out of the catheter was maintained to be throughout the study in this paper. A custom-made miniature single-element ultrasonic transducer (Blatek) was used to detect the photoacoustic waves from the sample as well as to perform pulse-echo ultrasound imaging (a short delay of was set to separate each photoacoustic and ultrasonic A-line). Both the photoacoustic and ultrasound signals were amplified (39 dB) using an ultrasound pulser receiver, and then digitized with a data acquisition card (12-bit digitization; 250-MHz sampling rate) in a personal computer. To form an A-line image, the acquired (photoacoustic and ultrasonic) signals were band-pass filtered (1–50 MHz for photoacoustic signal and 10–50MHz for ultrasound signal, with a 128-th order zero-phase forward and reverse finite impulse response filter), followed by a Hilbert transform for envelope detection. Finally, the image was converted into a polar coordinate for display (signal processing performed with MATLAB®). To acquire cross-sectional images (B-scans), the catheter was rotated at a speed as fast as 300 RPM via an optical-electric rotary joint. Furthermore, three-dimensional (3-D) images can be obtained via a pull-back stage driven by a step motor. As a demonstration, a video was recorded in real time while the system was working at a B-scan rate of 5 Hz (with 200 A-lines per B-scan) (Video 1). Fig. 1Illustration of the high-speed intravascular photoacoustic (IVPA) system. (a) Overall architecture of the system. (b) Enlarged view of the dashed box in (a). (c) Video of the high-speed IVPA system (Video 1, MOV, 10. 2 MB) [URL: http://dx.doi.org/10.1117/1.JBO.20.6.065006.1]. Optical parametric oscillator (OPO); neutral density filter (NDF); beam splitter (BM); photodiode (PD); ultrasonics (US); photoacoustics (PA); multimode fiber (MMF); 3-D Scanner, consisting of an optical-electric rotary joint, a motorized rotary stage and a motorized pull-back stage; PR, ultrasound pulser/receiver; MD, motor driver.  2.2.Catheter DesignTo enable the use of a high-repetition-rate OPO laser—which is of a relatively low energy output—for high-speed IVPA imaging, we designed an IVPA/IVUS dual-modality imaging catheter using quasifocusing light illumination. As shown in Fig. 2, the catheter consists of a multimode fiber, a gradient-index (GRIN) lens (GRINTECH), a prism, and a high-frequency miniature ultrasound transducer, developed based on the design of our previous work.17 Figures 2(a) and 2(b) show the schematic and the photo, respectively, of the distal part of the catheter. The outer diameter of the catheter is 0.9 mm. All the optical and ultrasonic components were ultimately housed in a metal housing. To increase the laser fluence in the targeted imaging region, the excitation laser beam was quasifocused onto the surface of the imaging target using a custom-fabricated GRIN lens of 0.5 mm in diameter. Specifically, the cross-sectional diameter of the laser beam out of the catheter tip was confined to be within a 3-mm distance from the GRIN lens. The laser beam was then delivered onto the sample surface by a mirror with an angle of 35 deg [Fig. 2(a)]. A metal ferrule was used to ensure that the fiber and GRIN lens were coaxially aligned. A custom-made single-element ultrasonic transducer (dimension: ; made from lead zirconate titanate composite) with a center frequency of 40 MHz, a pulse-echo fractional bandwidth of 60%, and an insertion loss of was sequentially aligned with the optical components, while a metal base was used to position the ultrasonic transducer for effective detection of the photoacoustic waves. The illumination angle of the laser out of the catheter tip is 16 deg in water, resulting in an optical and acoustic beam overlap range of (from 1.5 to 4.5 mm, measured from the center of the catheter), as shown in Fig. 2(c). A flexible coil that can transmit the rotational torque from the rotary stage was used to house the rest of the catheter (besides the distal end). Fig. 2Distal end of the quasifocusing IVPA catheter. (a) Overall schematic. (b) Top view of the catheter. (c) Overlap between the acoustic and laser beams.  To estimate the laser fluence enhancement with such a design compared with that in conventional IVPA systems, a Monte Carlo simulation of photon transport in biological tissue was performed. The simulation code was modified based on the Monte Carlo modeling of light transport code developed by Lihong Wang. A three-layer tissue model, consisting of a 0.06-mm thin-cap layer (, , ), a 1-mm lipid layer (, , ), and a 3.94-mm elastin layer (, , ) was used.18,19 The illumination spot sizes at the surface in the two cases (quasifocusing and broad illumination beams) were set as 0.3 mm [Fig. 3(a)] and 1.2 mm [Fig. 3(b)] in diameter, respectively, while the incident photon energy ( photons) was maintained to be the same. Figures 3(a) and 3(b) show the optical fluence distribution in the two cases, while Figs. 3(c) and 3(d) are the quantification results along the depth direction of the central axis. From Fig. 3, it can be seen that the laser fluence of the quasifocusing beam is significantly higher than the broad illumination case in the “lipid core” region of the numerical phantom (from 0.1 to 1 mm). As the simulation here does not account for the illumination angle difference between the two laser beams (approximately parallel beam for quasifocusing versus divergent beam for broad illumination), the actual difference of the laser fluence between the two cases should be more significant, further favoring the quasifocusing beam design. Fig. 3Monte Carlo simulation of photon transport in a numerical plaque phantom. (a) and (b) Laser fluence distributions with quasifocusing and broad illumination beams, respectively. (c) Quantitative comparison of the laser fluence along the central axis between the two cases in (a) and (b). (d) Ratio of the laser fluence between the cases in (a) and (b).  3.Results3.1.Resolution and Signal-to-Noise Ratio MeasurementWe characterized the performance of the high-speed IVPA imaging system using a variety of targets, including a black tape of in width and three carbon fibers of diameters ranging from . First, it can be seen that all the targets are imaged with both IVPA and IVUS [Figs. 4(a) and 4(b)]. The dynamic range is in both the IVPA and IVUS images. To quantify the spatial resolution, one carbon fiber of in diameter was used as the target. The axial resolution and transverse resolution as a function of depth are shown in Fig. 4(c). From the figure, it can be seen that, in general, the transverse resolution of IVPA is better than IVUS at various depths, presumably due to the more strictly confined optical excitation area [Fig. 2(c)]. The axial resolution of IVPA is quite similar to that of IVUS ( at various depths) as it primarily depends on the bandwidth of the ultrasound transducer. Figure 4(d) shows the signal-to-noise ratio (SNR) of IVPA and IVUS measurements as a function of depth (axial position) using a carbon fiber as the target. Fig. 4Photoacoustic and ultrasonic resolution and signal-to-noise ratio (SNR) of the high-speed IVPA system. (a) IVPA and (b) intravascular ultrasound (IVUS) B-scan images of the phantom with targets of different sizes. (c) Resolution of IVPA and IVUS at different depths. (d) SNR of IVPA and IVUS as a function of depth. (1), black tape (); (2), carbon fiber (); (3), carbon fiber (); (4), carbon fiber ().  3.2.Imaging of a StentTo demonstrate the potential of the high-speed IVPA system for 3-D intravascular imaging, an iliac stent (Abbott) inside a healthy rabbit vessel was imaged with both the photoacoustic and ultrasonic modalities.20 Figure 5(a) shows a photo of the stent. Figures 5(b) and 5(c) show the reconstructed 3-D IVPA and IVUS images, respectively, of the stent. Moreover, representative IVPA (SNR 46 dB), IVUS (SNR 41 dB), and IVPA/IVUS fused B-scan cross-sectional images are also shown in Figs. 5(d)–5(f), respectively. From the images, it can be seen that, in this case, the contrast of IVPA is generally better than that of IVUS—the fine structure of the stent struts can be clearly visualized in the IVPA images. However, IVUS can be used to visualize the structure of the vessel. Thus, the fusion of the two (IVPA and IVUS) imaging modalities, as demonstrated here, should be advantageous over either modality alone for guiding and evaluating stenting. When 200-A lines were used to form a B-scan, one cross-sectional image took 0.2 s to complete. Therefore, when a fine pull-back step of (smaller than half of the lateral resolution) was used, was needed to scan the entire stent of 10 mm in length. 3.3.Imaging of Lipid-Mimicking PhantomTo demonstrate the capability of identifying lipid content with the high-speed IVPA system, a lipid-mimicking phantom fabricated by placing a small amount of butter inside a plastic tube was used. Five wavelengths (1185, 1195, 1210, 1225, and 1235 nm) were employed to perform spectroscopic IVPA imaging of the phantom. These wavelengths were selected to reflect the characteristic points of the local absorption peak of lipid, primarily based on the well-measured lipid absorption spectrum reported by several other groups.9,21 A photo of the lipid-mimicking phantom is shown in the inset of Fig. 6(d). Figures 6(a)–6(c) show the IVPA images of the phantom at three representative excitation wavelengths of 1185, 1210, and 1235 nm, respectively. It can be seen that the signal amplitude is significantly higher at 1210 nm than that from the other two wavelengths, which is consistent with the optical absorption spectrum of lipid. Figure 6(d) shows the spectroscopic IVPA result computed from the above-mentioned five excitation wavelengths, where each data point represents the integrated signal strength corresponding to the region labeled by the dashed box in Fig. 6(b). As a reference, the optical absorption spectrum of lipid is also shown in Fig. 6(d).21 The result shows that the IVPA spectrum agrees well with the lipid absorption spectrum. Fig. 6Spectroscopic photoacoustic imaging with the high-speed IVPA system. (a)–(c) IVPA images of a lipid-mimicking phantom [inset in (d)] with excitation wavelengths at 1185, 1210, and 1235 nm, respectively. (d) Comparison between the IVPA spectroscopic results with the absorption spectrum of lipid. (e) Lipid map computed based on the correlation between the IVPA and optical absorption spectra of lipid, using five excitation wavelengths. 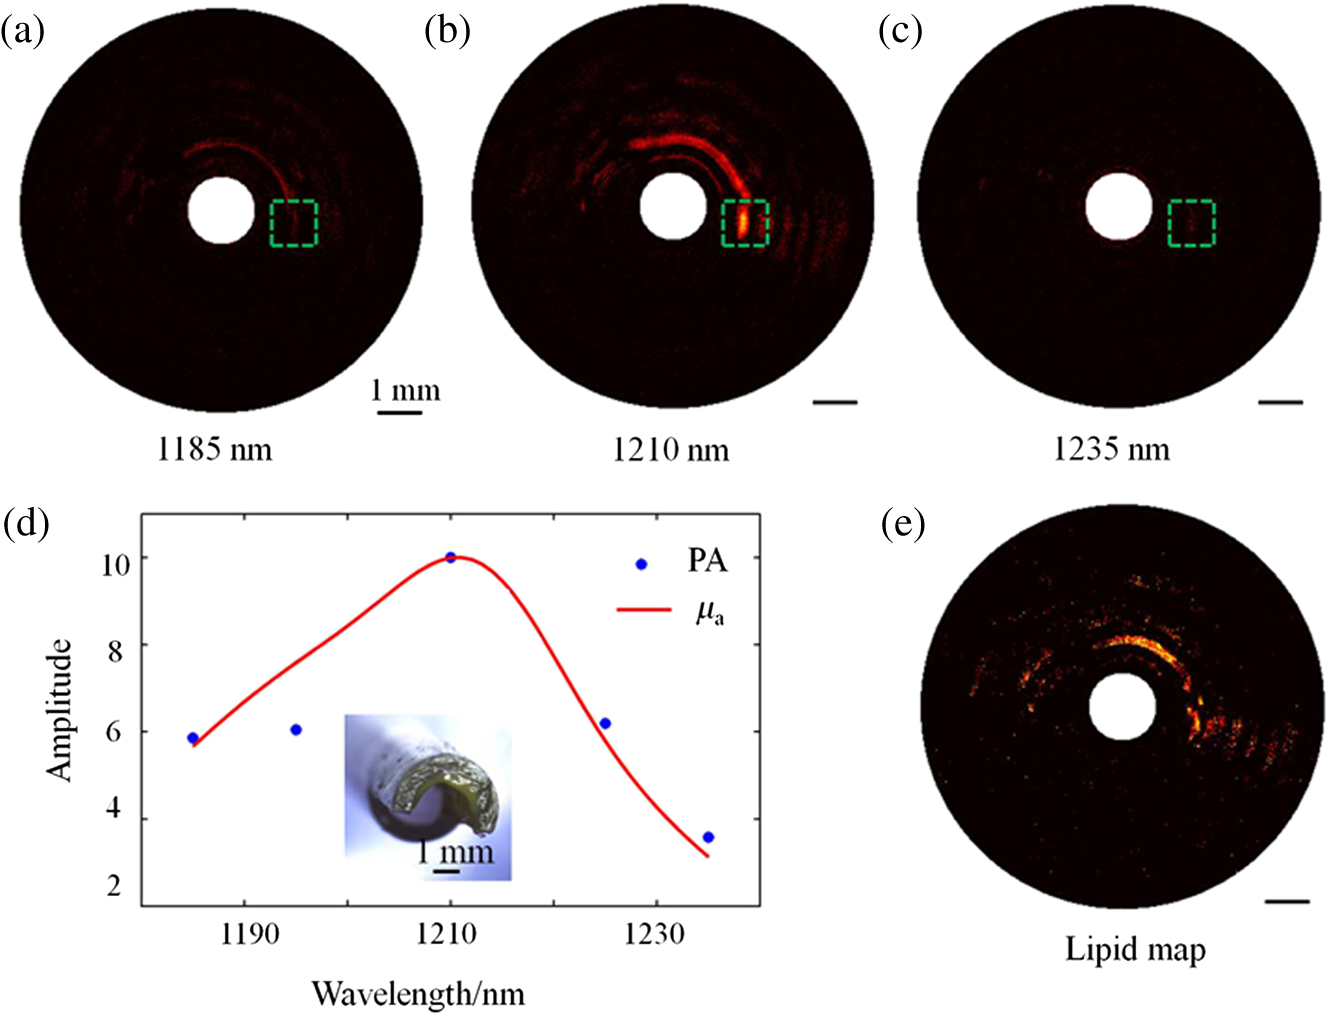 The lipid distribution can be obtained by computing the correlation between the lipid optical absorption spectrum and the spectroscopic IVPA (sIVPA) data. Specifically, first, the sIVPA data were band-pass filtered without averaging; then, the correlation coefficient between the sIVPA and absorption spectra was calculated at each pixel. The correlation coefficient between the two data sets and with expected values and and standard deviations and is defined as where is the expected value operator and cov denotes the covariance. In Fig. 6(e), the amplitude at each pixel represents its corresponding value. In this study, the threshold correlation coefficient is set as 0.8. That is, the content is considered as lipid when . Finally, the lipid distribution was obtained by mapping the correlation coefficient () at every pixel, as shown in Fig. 6(e).3.4.Imaging of Peri-Adventitial Adipose TissueTo demonstrate the capability of identifying lipid in a more natural form, peri-adventitial adipose tissue excised from a porcine aorta segment was imaged. Previous studies have shown that both the and spectral bands can be used for IVPA imaging of lipid, and each band may have its own advantages and disadvantages.16,22,23 Here, as a simple demonstration of the system’s spectroscopic imaging capability, we performed IVPA imaging at both spectral bands. Figures 7(a)–7(c) show the IVPA images of the adipose tissue (placed in a plastic tube) at three representative excitation wavelengths—1185, 1210, and 1235 nm—at the spectral band, while Figs. 7(d)–7(f) show the IVPA images of the tissue at three representative excitation wavelengths—1680, 1720, and 1750 nm—at the spectral band. Further, the five-wavelength spectroscopic IVPA data at the location of the arrows are shown in Figs. 7(g) and 7(h); the absorption spectra of lipid at both spectral bands are also depicted for comparison. In this case, it can be seen that the peri-adventitial adipose tissue can be detected via IVPA at either spectral band. All animal experiments were conducted under protocols approved by the Laboratory Animal Centre of Shenzhen Institutes of Advanced Technology and carried out ethically and humanely. Fig. 7Spectroscopic IVPA images of the peri-adventitial adipose tissue from a porcine aorta segment [inset in (g)]. (a)–(f) Representative IVPA B-scan images at both spectral bands. (g) and (h) Comparison between the IVPA spectroscopic results and the absorption spectrum of lipid. The arrows indicate the location of the adipose tissue, while the dashed green circles show the contour of the plastic tube. 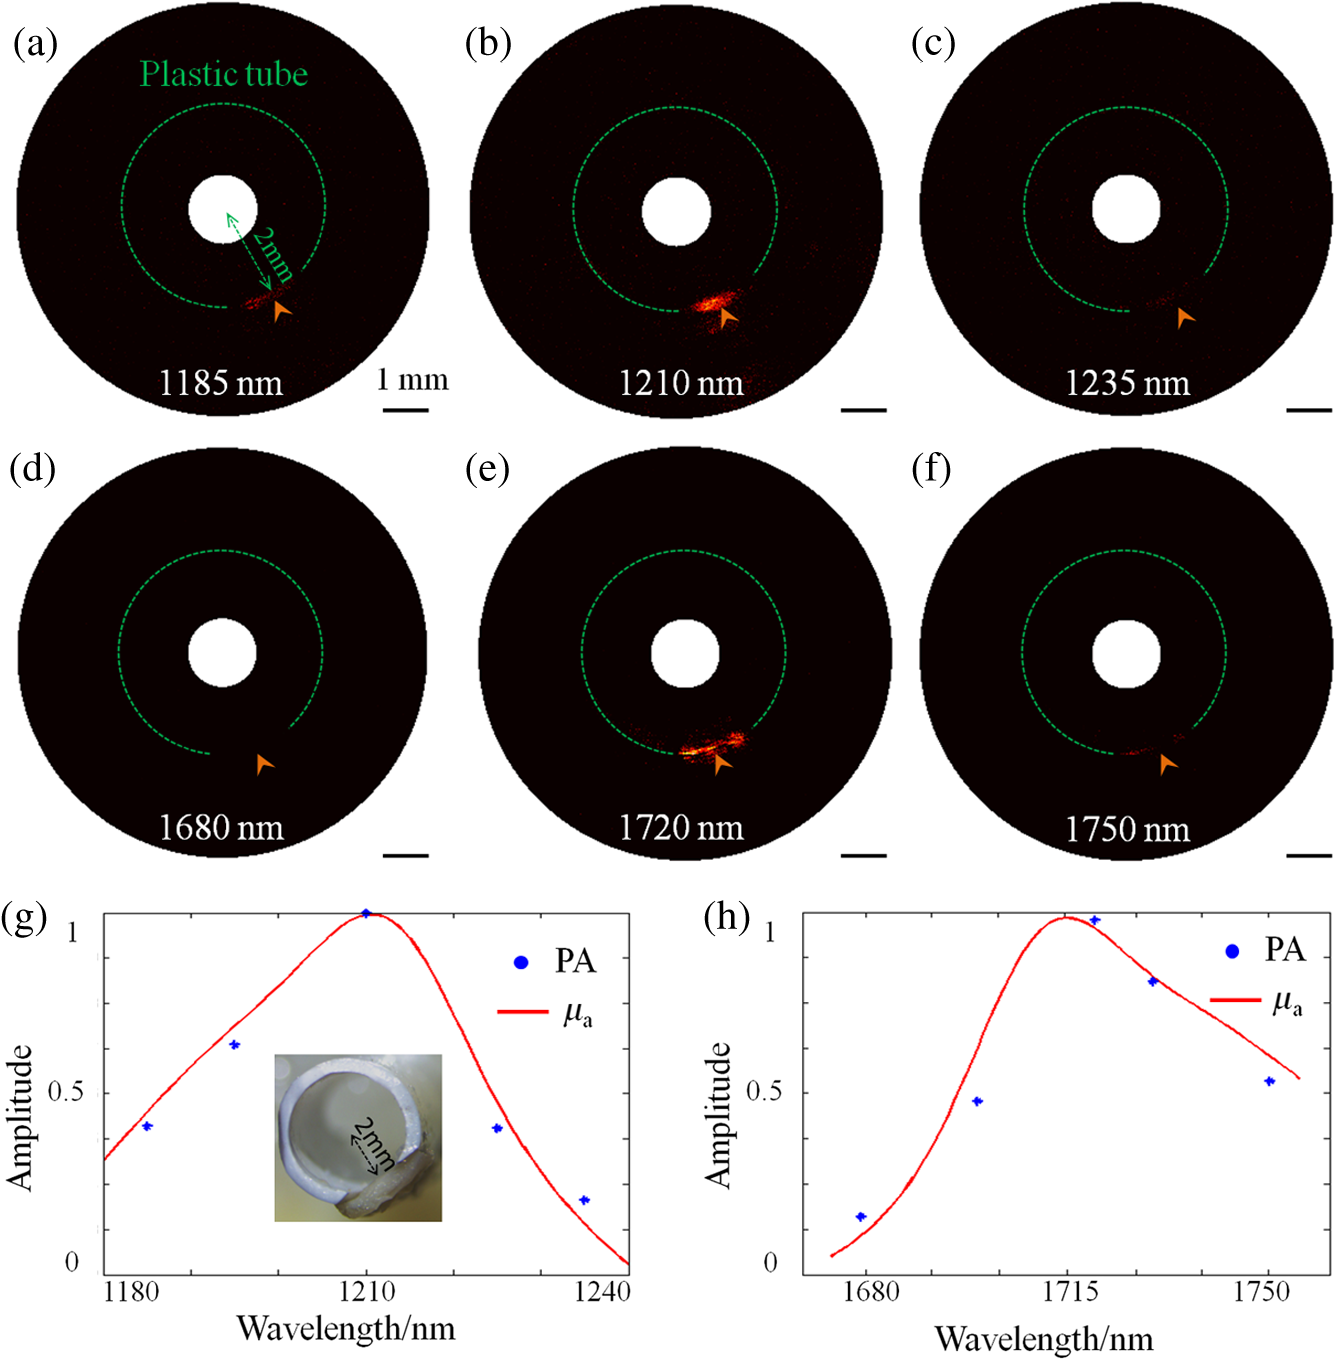 4.Discussion and ConclusionsIn this study, a high-speed spectroscopic IVPA system that can simultaneously perform photoacoustic and ultrasound imaging has been developed. The system is featured with a small imaging catheter of 0.9 mm in diameter and offers a frame rate as high as 5 B-scans/s, -fold faster than previously reported IVPA systems of multiwavelength spectroscopic photoacoustic imaging ability. Therefore, the developed system has a high potential to accelerate the translation of IVPA imaging into the clinic. In the high-speed IVPA system, a light delivery scheme with quasifocusing optical illumination is used for photoacoustic excitation. With such a design, the laser fluence has been enhanced to enable decent photoacoustic signal generation using laser energy as low as . This reduction of the excitation laser energy has created an opportunity to utilize a low-energy tunable OPO laser capable of operating at a high-repetition rate of 1 kHz for achieving high-speed intravascular photoacoustic imaging. The resolution and 3-D imaging capability of the system were experimentally demonstrated by imaging carbon fibers and a stent, respectively. While the results showed that IVPA and IVUS had comparable axial and transverse resolutions, IVPA had a relatively high contrast for stent imaging. With the system, we also demonstrated high-speed spectroscopic IVPA imaging of a lipid-mimicking phantom using five excitation laser wavelengths. Even when we took the wavelength tuning and stabilization time () into account, it took only to complete the entire spectroscopic image data acquisition with five different wavelengths, which is times faster than previously reported spectroscopic IVPA imaging systems. In addition, this speed can be further significantly improved by increasing the wavelength tuning speed of the laser. In our current system, a frame rate of 5 B-scans/s is still not sufficient for real clinical use. To enable truly high-speed spectroscopic photoacoustic imaging at high accuracy, a tunable laser source that can operate not only at high repetition rate but also at high wavelength sweeping rate will be needed. Such a laser source may allow point-by-point spectroscopic IVPA imaging for accurately identifying the compositions of plaques. AcknowledgmentsThis work was supported in part by the National Natural Science Foundation of China under Grant Nos. 81427804, 61205203, 61405234, and 61475182; the National Key Basic Research (973) Program of China under Grant Nos. 2014CB744503 and 2015CB755500; the Shenzhen Science and Technology Innovation under Grant Nos. ZDSY-2013-0401165820-357, KQCX-2012-0816155844-962, CXZZ-2012-0617113635-699, and JCYJ-2012-0615125857-842; Guangdong Innovation Research Team Fund for Low-cost Healthcare Technologies (GIRIF-LCHT). ReferencesE. Falk, P. K. Shah and V. Fuster,
“Coronary plaque disruption,”
Circulation, 92 657
–671
(1995). http://dx.doi.org/10.1161/01.CIR.92.3.657 CIRCAZ 0009-7322 Google Scholar
A. V. Finn et al.,
“Concept of vulnerable/unstable plaque,”
Arterioscler. Thromb. Vasc. Biol., 30 1282
–1292
(2010). http://dx.doi.org/10.1161/ATVBAHA.108.179739 ATVBFA 1079-5642 Google Scholar
H. M. Garcia-Garcia, M. A. Costa and P. W. Serruys,
“Imaging of coronary atherosclerosis: intravascular ultrasound,”
Eur. Heart J., 31 2456
–2469C
(2010). http://dx.doi.org/10.1093/eurheartj/ehq280 EHJODF 0195-668X Google Scholar
C. L. de Korte et al.,
“Characterization of plaque components and vulnerability with intravascular ultrasound elastography,”
Phys. Med. Biol., 45 1465
–1475
(2000). http://dx.doi.org/10.1088/0031-9155/45/6/305 PHMBA7 0031-9155 Google Scholar
G. van Soest et al.,
“Atherosclerotic tissue characterization in vivo by optical coherence tomography attenuation imaging,”
J. Biomed. Opt., 15 011105
(2010). http://dx.doi.org/10.1117/1.3280271 JBOPFO 1083-3668 Google Scholar
P. R. Moreno et al.,
“Detection of lipid pool, thin fibrous cap, and inflammatory cells in human aortic atherosclerotic plaques by near-infrared spectroscopy,”
Circulation, 105 923
–927
(2002). http://dx.doi.org/10.1161/hc0802.104291 CIRCAZ 0009-7322 Google Scholar
L. H. V. Wang and S. Hu,
“Photoacoustic tomography: in vivo imaging from organelles to organs,”
Science, 335 1458
–1462
(2012). http://dx.doi.org/10.1126/science.1216210 SCIEAS 0036-8075 Google Scholar
S. Sethuraman et al.,
“Spectroscopic intravascular photoacoustic imaging to differentiate atherosclerotic plaques,”
Opt. Express, 16 3362
–3367
(2008). http://dx.doi.org/10.1364/OE.16.003362 OPEXFF 1094-4087 Google Scholar
K. Jansen et al.,
“Lipid detection in atherosclerotic human coronaries by spectroscopic intravascular photoacoustic imaging,”
Opt. Express, 21 21472
–21484
(2013). http://dx.doi.org/10.1364/OE.21.021472 OPEXFF 1094-4087 Google Scholar
T. J. Allen et al.,
“Spectroscopic photoacoustic imaging of lipid-rich plaques in the human aorta in the 740 to 1400 nm wavelength range,”
J. Biomed. Opt., 17 061209
(2012). http://dx.doi.org/10.1117/1.JBO.17.6.061209 JBOPFO 1083-3668 Google Scholar
L. Song, K. Maslov and L. V. Wang,
“Multifocal optical-resolution photoacoustic microscopy in vivo,”
Opt. Lett., 36 1236
–1238
(2011). http://dx.doi.org/10.1364/OL.36.001236 OPLEDP 0146-9592 Google Scholar
H. W. Wang et al.,
“Label-free bond-selective imaging by listening to vibrationally excited molecules,”
Phys. Rev. Lett., 106 238106
(2011). http://dx.doi.org/10.1103/PhysRevLett.106.238106 PRLTAO 0031-9007 Google Scholar
S. Sethuraman et al.,
“Intravascular photoacoustic imaging using an IVUS imaging catheter,”
IEEE Trans. Ultrason. Ferroelectr. Freq. Control, 54
(5), 978
–986
(2007). http://dx.doi.org/10.1109/TUFFC.2007.343 ITUCER 0885-3010 Google Scholar
J. Zhang et al.,
“Characterization of lipid-rich aortic plaques by intravascular photoacoustic tomography ex vivo and in vivo validation in a rabbit atherosclerosis model with histologic correlation,”
J. Am. Coll. Cardiol., 64 385
–390
(2014). http://dx.doi.org/10.1016/j.jacc.2014.04.053 JACCDI 0735-1097 Google Scholar
A. B. Karpiouk et al.,
“Feasibility of in vivo intravascular photoacoustic imaging using integrated ultrasound and photoacoustic imaging catheter,”
J. Biomed. Opt., 17 096008
(2012). http://dx.doi.org/10.1117/1.JBO.17.9.096008 JBOPFO 1083-3668 Google Scholar
T. M. P. Wang et al.,
“High-speed intravascular photoacoustic imaging of lipid-laden atherosclerotic plaque enabled by a 2-kHz barium nitrite Raman laser,”
Sci. Rep., 4 6889
(2014). http://dx.doi.org/10.1038/srep06889 SRCEC3 2045-2322 Google Scholar
X. S. Bai et al.,
“Intravascular optical-resolution photoacoustic tomography with a 1.1 mm diameter catheter,”
Plos One, 9 0092463
(2014). http://dx.doi.org/10.1371/journal.pone.0092463 1932-6203 Google Scholar
A. J. Welch et al.,
“Propagation of fluorescent light,”
Laser Surg. Med., 21 166
–178
(1997). http://dx.doi.org/10.1002/(ISSN)1096-9101 LSMEDI 0196-8092 Google Scholar
F. Foschum and A. Kienle,
“Broadband absorption spectroscopy of turbid media using a dual step steady-state method,”
J. Biomed. Opt., 17 037009
(2012). http://dx.doi.org/10.1117/1.JBO.17.3.037009 JBOPFO 1083-3668 Google Scholar
J. L. S. Su, B. Wang and S. Y. Emelianov,
“Photoacoustic imaging of coronary artery stents,”
Opt. Express, 17 19894
–19901
(2009). http://dx.doi.org/10.1364/OE.17.019894 OPEXFF 1094-4087 Google Scholar
C. L. Tsai, J. C. Chen and W. J. Wang,
“Near-infrared absorption property of biological soft tissue constituents,”
J. Med. Biol. Eng., 21 7
–14
(2001). IYSEAK 0021-3292 Google Scholar
D. Yeager et al.,
“Intravascular photoacoustic imaging of exogenously labeled atherosclerotic plaque through luminal blood,”
J. Biomed. Opt., 17 106016
(2012). http://dx.doi.org/10.1117/1.JBO.17.10.106016 JBOPFO 1083-3668 Google Scholar
M. W. K. Jansen, A. F. W. van der Steen and G. van Soest,
“Photoacoustic imaging of human coronary atherosclerosis in two spectral bands,”
Photoacoustics, 2 12
–20
(2014). http://dx.doi.org/10.1016/j.pacs.2013.11.003 JPHODE 0278-2901 Google Scholar
BiographyYan Li is a research assistant at the Shenzhen Institutes of Advanced Technology, Chinese Academy of Sciences. She received her master’s degree in optical engineering from Changchun Institute of Optics, Fine Mechanics and Physics, Chinese Academy of Sciences in 2014. Her current research interest focuses on the optical design for photoacoustic imaging devices. Xiaojing Gong is an assistant professor at the Shenzhen Institutes of Advanced Technology, Chinese Academy of Sciences. He received his PhD from the University of Science and Technology of China in 2007. His research focuses on the system design for intravascular optical/ultrasonic multimodality imaging. Chengbo Liu is an assistant professor at the Shenzhen Institutes of Advanced Technology, Chinese Academy of Sciences. He received both his BS and PhD degrees from the Xi’an Jiaotong University, China. During his PhD research, he also studied at Duke University for two years as an exchange student. His research mainly focuses on optical molecular imaging. Riqiang Lin is an assistant professor at the Shenzhen Institutes of Advanced Technology, Chinese Academy of Sciences. He received his master's degree in mechanical engineering and automation from Shenzhen University. His research focuses on the development of novel photoacoustic microscopy and endoscopy systems. William Hau is an adjunct research staff affiliated with the Institute of Cardiovascular Medicine and Research center, The University of Hong Kong. He also holds a visiting professorship with Anzhen Hospital, Capital University of Medical Sciences, Beijing, China and is an academic visitor with the Department of Medicine, National University of Singapore. He received his PhD degree in physiology and MSc degree in biomedical engineering. He has more than 10 years experience in the field of intravascular ultrasound imaging. Xiaosong Bai is a research assistant at the Shenzhen Institutes of Advanced Technology, Chinese Academy of Sciences. He received his MSc degree in optical engineering from Sun Yat-sen University. His current research focuses on the system design for photoacoustic imaging devices. Liang Song is a professor at the Shenzhen Institutes of Advanced Technology (SIAT), Chinese Academy of Sciences. He received his PhD in biomedical engineering from Washington University in St. Louis in 2010. Currently, he directs the research laboratory for biomedical optics at SIAT and the Shenzhen Key Laboratory for Molecular Imaging. His research focuses on developing novel optical/ultrasonic multimodality imaging technologies for the diagnosis and therapy guidance of cancer and cardiovascular atherosclerosis. |


