|
|
1.IntroductionGold nanoparticles (NPs) have been used in a wide variety of medical applications due to their ease of synthesis and chemical functionalization, interesting optical and physical properties, and low toxicity. There have been numerous reports in the literature of using AuNPs in photothermal therapy,1–3 dose-enhanced radiotherapy,4,5 as drug carriers,6 or bioimaging contrast agents,7–9 mostly for cancer-related biomedical applications. Biodistribution and clearance of NPs are very complex and important issues when considering efficacy of nanomedicines or in vivo nanotoxicity. The approval of NP-based agents by the food and drug administration (FDA) is hindered by the lack of consistent data or guidelines.10 The general scheme of NP clearance seems to be through three main mechanisms: renal, hepatic, and reticuloendothelial system (RES).11 Renal clearance is the preferable pathway for NPs to minimize intracellular catabolism and enzymatic modification leading to undesirable nanomaterial retention and cytotoxicity.12 In considering clearance through the kidneys and ultimate excretion into the urine, the physiological factors of importance are the fenestrated epithelium of the glomerular capillary wall, the highly negatively charged glomerular basement membrane, and the podocyte extensions of glomerular epithelial cells.12 The size barrier is the filtration slit, with a physiological pore size of 4.5 to 5 nm. Particles between 6 and 8 nm may pass through based upon charge interactions; positive NPs are more readily filtered due to the negative charge on the membrane.13 Particles may also become resorbed in the proximal tubule due to the negatively charged nature of the epithelial cells.13 In hepatic clearance, hepatocytes in the liver eliminate foreign substances and particles by endocytosis, followed by enzymatic breakdown of the particles and excretion into the bile via the biliary system.14 NPs between 10 and 20 nm undergo rapid liver uptake, but the subsequent hepatic processing and biliary excretion is usually slow.12 The prolonged retention of NPs from this relatively slow clearance pathway and associated complex catabolites represents a concern of toxicity to the liver parenchyma.14 Clearance through the RES results from the removal of NPs from the blood by phagocytic cells in the blood and tissues.15 Examples of phagocytic cells of the RES include blood-circulating monocytes, hepatic Kupffer cells, splenic red-pulp and marginal zone macrophages as well as bone marrow persinal macrophages and sinus endothelial cells.11 Surface opsonization, where opsonins and other complements or immune proteins are deposited on the NP surface, mediate NP recognition and clearance from the blood by the RES.11,16 Some NPs undergo intracellular degradation inside RES cells when phagocytosed; if they cannot be broken by these intracellular processes effectively, as is the case with gold, they will remain within the cell and be retained by the body, mostly in the spleen and liver.12,17–19 The enhanced permeability and retention (EPR) effect refers to the preferential passive accumulation of NPs () in tumors due to the leaky and disorganized vasculature that malignancies produce to sustain growth. There have been many strategies to try to optimize NP delivery to cancer by taking advantage of the EPR effect;20,21 current liposomal drug formulations, such as Doxil, Caelyx, and Abraxane, are based upon this principle.22–25 Au nanostructures of a wide range of sizes and geometries have been shown to passively accumulate in tumors due to the EPR effect.26–29 The site and quantity of accumulation depend upon the particle size and charge. A systematic study using different sizes of Au-tiopronin indicated that while the smallest NPs (2 and 6 nm) accumulated mostly in the liver and spleen after IV injection into tumor-bearing mice, only these small sizes could enter tumor cell nuclei.30 One of the key questions in this field is whether additional targeting strategies can improve selective accumulation in tumors versus nontarget organs.31 Active targeting of NPs to improve upon the EPR effect has been attempted using amphiphilic polymers, polyethylene glycol coating, streptavidin–biotin systems, antibodies, affibodies, aptamers, and specific ligands for cancer-cell receptors.32 However, the degree to which this improves delivery, and the desirability of using targeted constructs over passively delivered NPs, has not been fully established, for the primary reason that assays take large numbers of animals and usually sample only limited time points, giving a poor picture of uptake and clearance kinetics. In a typical biodistribution experiment, NPs are injected into test animals, which are subsequently sacrificed and have their organs harvested to perform elemental analysis.33 In the context of gold NPs, instrumental neutron activation analysis and inductively coupled plasma mass spectrometry (ICP-MS) are the “gold standards” for accurately determining the concentration and localization of gold NPs in animal tissues.34 In ICP-MS, the sample is nebulized by a plasma torch and converted to plasma prior to quantification by a mass spectrometer system.35 The limit of detection for gold using ICP-MS is as low as , or one part per trillion, which is more than sufficient for an accurate quantitative analysis of gold NP distribution.34,35 However, it is an endpoint sampling method that is costly, time consuming, and yields only bulk organ-level resolution. Furthermore, it cannot easily be translated into human clinical research. Histology, autometallography, and electron microscopy (including scanning electron microscopy and transmission electron microscopy (TEM) with energy dispersive x-ray spectroscopy and its variants) are qualitative techniques that can improve the biological resolution of localizing gold NPs in ex vivo tissues. However, these methods also suffer from similar drawbacks of the need to sacrifice animals and of labor-intensive sample preparation.34 There is a need to develop new methods to evaluate in vivo biodistribution of NPs quantitatively in real time. In this paper, we demonstrate the use of fluorescent and photoacoustic (PA) imaging to evaluate the biodistribution of ultrasmall gold NPs in excised organs as a first step toward this goal. In vivo optical and optoacoustic techniques have been suggested and developed to supplement conventional biodistribution study methods.34 In PA imaging, pulsed laser illumination is used to induce the heating of a light-absorbing volume, such as gold NPs, by optical absorption. The aqueous medium undergoes thermoelastic expansion due to heat transfer from the particles to generate acoustically detectable pressure waves. The acoustic signal is detected and used to generate an image. The advantage of combined high-frequency ultrasound and PA imaging is inherently coregistered high spatial resolution images with high sensitivity to endogenous and exogenous compounds in real time.36 Mallidi et al.7 showed that PA imaging was able to discern between anti-epidermal growth factor receptor gold NPs, nonconjugated gold NPs, and a near-infrared (NIR) dye in mouse tissue ex vivo. Cook et al.8 have reported the use of PA imaging for quantitative assessment of gold NP biodistribution in cells and xenograft tumor tissue sections. Ultrasmall gold NPs and nanoclusters can be made to be inherently fluorescent without conjugation to fluorophores.37 Reported quantum yields for these gold NPs range from to and depend on the choice of the capping ligand and the size of the gold core.37 These fluorescent NPs have been used for in vivo whole animal and excised organ imaging in several studies. Liu et al.9 used in situ fluorescence imaging of tumor-bearing nude mice to quantitatively determine the pharmacokinetics and passive tumor targeting effects of NIR-emitting glutathione-coated luminescent gold NPs. Sykes et al.38 demonstrated the use of noninvasive and rapid skin biopsies coupled with optical imaging to analyze gold NPs and quantum dot exposure in animals. Previous approaches to combining PA imaging with other imaging modalities, such as fluorescence imaging39–41 and ultrasound imaging,42 have relied upon different materials to provide contrast for each method. Probes used are typically conjugates or encapsulations of unimodal fluorescent, ultrasound, and magnetic resonance contrast agents. Other materials, such as quantum dots or single-walled carbon nanotubes, could serve as intrinsically multimodal contrast agents, but biocompatibility and toxicity concerns with regard to heavy metal leaching from quantum dots and cytotoxicity of carbon nanotubes currently limit their clinical usage. In this study, we take advantage of the intrinsic PA and fluorescence properties of ultrasmall gold NPs to create a simple multimodal agent comprised only of constituents that have been FDA approved. We evaluate biodistribution and compare the results with the quantitative measurements from inductively coupled plasma mass spectrometry finding good agreement at the organ level between the imaging techniques, as well as excellent spatial resolution that allows for localization of the particles within organ structures. 2.Materials and MethodsUltrasmall gold NPs were synthesized using a method detailed in Zhang et al.6 Briefly, hydrogen tetrachloroaureate(III) trihydrate (0.5 mmol) and tiopronin [N-(2-mercaptopropionyl)glycine] (1.2 mmol) were dissolved in 20 mL of methanol/acetic acid , and an aqueous solution of sodium borohydrate (7.5 mL, 8 mM) was added slowly. After vigorous stirring for 30 min, the resulting black solution was collected and concentrated. The residues were dissolved in 20 mL and dialyzed for 72 h against (2 L), which was changed every 12 h. Gold NPs were characterized by TEM, absorbance, and fluorescence spectroscopy. Quantum yield () was calculated with the reference of rhodamine 6G (Rho, quantum yield: 95% in ethanol) according to the following equation: UV-Vis absorbance spectra were recorded on an i3 SpectraMax Plus plate reader and fluorescence emission spectra on a Gemini EM plate reader (Molecular Devices, Novato, California). Fourier transform infrared spectroscopy (FTIR) was performed on a Nicolet FTIR spectrometer (Thermo Scientific). Zeta potential was measured using Zeta plus/Zeta potential analyzer (Brookhaven Instruments Corporation, New York). The 1.3 mL of AuNPs at an approximate concentration of in phosphate-buffered saline (pH 7.4) inside a cuvette was analyzed using the Smoluchowski approximation setting and averaged over 10 runs. Samples for TEM were prepared on carbon coated copper grids, and examined with an accelerating voltage of 200 keV on a JEM-2100F field emission transmission electron microscope (JEOL, Peabody, Massachusetts). The in vivo model for determining gold NP biodistribution by ICP-MS was a melanoma allograft. Animal protocols for the melanoma model were approved by the Canadian Council on Animal Care and the McGill University Animal Care. B16 melanoma cells were implanted on the hind limbs of C57/BL6 mice. Initially, tumors were induced by injecting of melanoma cells in volume subcutaneously in the hindlimb using a 24G needle. Biodistribution experiments were performed 7 to 10 days postinoculation when the tumors had grown to be in diameter. The in vivo model for PA and fluorescence imaging experiments was a lung cancer allograft. Animal protocols for the lung cancer model were approved by the Canadian Council on Animal Care and the Visualsonics Animal Care Committee. Lewis lung carcinoma (LLC) cells were implanted on the hind limbs of nude mice. Initially, graft tumors were induced by injecting cells in volume subcutaneously in the hindlimb using a 30G needle. Mice were removed from anesthesia and returned to their cages after full recovery. Tumors were imaged 7 days postinoculation, by which time they had grown to in diameter. NPs were delivered as a bolus of gold NP solution injected intravenously into the tail vein. Twenty four hours postinjection, the mice were sacrificed by carbon dioxide asphyxiation followed by cardiac exsanguination. The organs were excised, washed, and fixed with glutaraldehyde. ICP-MS was used to quantify the gold elemental content of most major organs. Organs were dissolved in aqua regia (one part nitric acid to three parts hydrochloric acid). The remaining inorganic component was resuspended in 1% nitric acid and 1% hydrochloric acid. Germanium (10 ppb) was added to all samples as the internal standard. Samples were analyzed using the ThermoScientific iCAPQ system using Glass Expansion (Pocasset, Massachusetts) nickel/copper base sampler cone and nickel skimmer cone with insert. Sample uptake time of 30 s and wash time of 60 s were used throughout the analysis. Gold standards at 0.1, 1, 10, 50, 100, and 500 ppb were used to generate the standard curve. Au-197 counts in organs were normalized to the average counts of Ge-72 from the standards. Gold elemental content is expressed and normalized to the excised organ mass in . For fluorescence imaging, the excised organs were imaged using an IVIS spectrum imaging apparatus (PerkinElmer) and associated Living Image software in fluorescent mode with the lamp level set too high. Excitation and emission filters at 675 and 780 nm, respectively, were used for optimal signal generation from the injected gold NPs. The exposure time was between 0.5 and 2 s, adjusted so that the resultant images had a signal between 600 and 60,000 counts. Autofluorescence was subtracted from images using noninjected organs as a reference. For PA imaging, the excised organs were immersed in ultrasound gel and imaged using a Vevo LAZR PA imaging system (FUJIFILM VisualSonics, Inc., Toronto). Spleens, kidneys, livers, and tumors were imaged with Spectro mode (images taken at wavelengths from 680 to 970 nm at 5 nm intervals; pulse duration is 5 to 10 ns, pulse repetition , ). Ultrasound and PA images were acquired with a LZ-250 transducer (, , ). A polyethylene tube (PE20, VWR) filled with the gold NP solution was imaged in a similar fashion. Regions of interest within each sample were drawn and spectral curves of PA signal intensity versus wavelength were generated with the onboard VisualSonics software and compared. Spectral unmixing was performed using the Vevo LAZR onboard software to distinguish multiple components in each image. 3.Results and Discussion3.1.Particle Characterization and ICP-MSThe Au particles were capped with tiopronin [Fig. 1(a)], giving them a negative charge at physiological pH ().The FTIR spectrum showed the stretches at 3300 nm (O═H of carboxylic acids) and 1700 nm (C═O of carboxylic acids), which further confirmed the successful synthesis of the NPs [Fig. 1(b)]. TEM showed particles that were uniform in size, in diameter [Fig. 1(c)]. Thiol capping causes a broadening of the surface plasmon peak, and at this size of NP, there was no distinct peak at any wavelength, consistent with previous studies.43 The particles were fluorescent in the NIR range with a quantum yield of [Fig. 1(d)]. Fig. 1Tiopronin-capped ultrasmall gold nanoparticles (NPs). (a) Schematic. (b) Infrared (IR) spectrum. (c) Representative transmission electron microscopy image indicating uniform distribution and diameter. (d) Absorbance and fluorescence emission spectra (arbitrary units).  To establish a basis of comparison between the imaging modalities, biodistribution of gold NPs as determined by ICP-MS was performed. B16 melanoma tumor-bearing C57/BL6 mice were injected intravenously via the tail vein with gold NPs. At 1 and 24 h postinjection, the animals were sacrificed and the gold elemental content of the major organs were analyzed by ICP-MS. Gold NPs were found to be retained in the animal for at least 24 h postinjection (Table 1). The major organs of accumulation, as expected from the main routes of clearance, were the spleen, kidneys, and liver. Detection of gold in the lungs, heart, pancreas, and muscle was most likely from the respective blood volumes retained inside those organs. There were negligible amounts of gold in the brain, indicating that the particles did not pass the blood–brain barrier. There was no statistically significant difference (as determined by two-way analysis of variance with ) in gold concentration in liver versus spleen versus kidney versus tumor when normalized to organ weight [Fig. 2(a)]. However, when the total amount of Au was considered, most were found in the liver and tumor [Fig. 2(b)]. With regard to the spleen, although the gold concentration was high, the total mass amount of Au is actually much lower than that of the liver and tumor. The Au concentration and mass accumulation in the tumor are both among the highest in the examined organs. As such, this demonstrates that Au-tiopronin, which is passive-targeting NP due to the lack of conjugated targeting moieties, is suitable to be used for drug delivery to tumors. Table 1Biodistribution of gold nanoparticles in mice at 1 and 24 h postinjection by inductively coupled plasma mass spectrometry analysis (shown as mean±SEM, n=3).
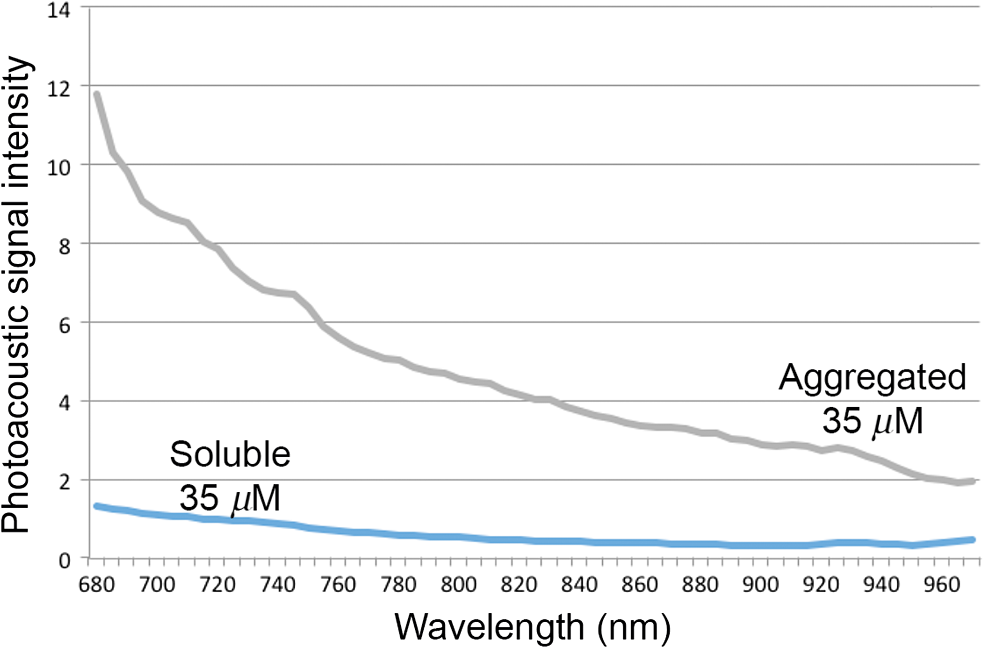
3.2.PA ImagingThe mouse hair of the C57/BL6 strain and the high concentration of melanin produced by the implanted B16 melanoma tumor caused interference and attenuation of the PA and fluorescence signal from gold NPs.44 Thus, for imaging experiments, the LLC nude mouse model was used instead of the B16 melanoma C57/BL6 mouse model. Spectrally unmixed PA images showed, with high resolution, the location and relative amount of distinct components within the samples. Three distinct spectral curves were identified from the subsets of regions of interest in all organs (Fig. 3). Component 1 (in red) matched the spectral curve for hemoglobin and component 2 (in blue) showed some characteristics of hemoglobin but with differences at shorter wavelengths (missing the peak at , which normally corresponds to deoxygenated hemoglobin). Component 3 (in yellow) showed a linear decay of intensity with increasing wavelength. Component 3 was not seen in control noninjected organs and so was assigned to the Au particles. Fig. 3Spectral curves of the three components identified in excised organs by photoacoustic imaging. Component 1 (in red) matched the spectral curve for hemoglobin. Component 2 (in blue) showed some characteristics of hemoglobin but with some differences at shorter wavelengths. Component 3 (in yellow) is the signal from gold NPs, which showed a linear decay with increasing wavelength (see Fig. 7 for Au particles imaged in solution).  Spectrally unmixed images of control and injected organs are shown in Fig. 4. Components 1 and 2 were combined and are represented in red, and component 3 (the gold NP signal) is represented in yellow. In the injected liver [Fig. 4(e)], the gold NP signal was observed on the surface of the entire organ. In the injected kidneys [Fig. 4(f)], the gold NP signal was seen on the surface as well. In the injected spleen [Fig. 4(g)], there was a strong gold NP signal throughout the organ interior and also some component 1 signal near the edges/apices of the spleen. In the tumor [Fig. 4(h)], the gold NP signal was concentrated only in the apical half of the lesion. Fig. 4Spectrally unmixed images of (a) control liver, (b) control kidney, (c) control spleen, (d) control tumor, (e) injected liver, (f) injected kidney, (g) injected spleen, and (h) injected tumor. Red denotes component 1 and 2 photoacoustic signal, whereas yellow denotes component 3 of the photoacoustic signal. White dotted lines give the outline of the organ.  These results from PA imaging suggested that the concentration of gold NPs was highest in the spleen and tumor. There was a weaker signal observed in the liver and kidneys by PA imaging. Aggregation of the particles dramatically increases the intensity of the signal (tested concentrations, up to , with and without acid-induced aggregation; see Appendix Fig. 7); it is, therefore, likely that some aggregation occurred in spleen, accounting for the very high signal seen in this organ. 3.3.NIR Fluorescence ImagingFigure 5 shows the total fluorescence signal intensity from injected and control organs. Strong autofluorescence was seen in the kidneys. Both the liver and kidney fluorescence signals completely dominated the spleen when imaged together. Thus, each organ pair (control versus injected) was imaged side by side for autofluorescence subtraction. Subtracted images are shown in Fig. 6, with dark red representing low epifluorescence counts and yellow representing high epifluorescence counts. As expected, a low fluorescence signal was observed in control organs with no gold NPs [Figs. 6(a), 6(c), and 6(e)]. This degree of autofluorescence was consistent with what has been seen previously.45 It was primarily found on the ventral side of the organs, probably due to the location of the blood supply. Fig. 5Total fluorescence signal intensity from gold NP injected and control excised organs imaged using the IVIS spectrum imaging system.  Fig. 6Fluorescence signal intensity from gold NP injected and control excised organ pairs imaged from different orientations using the IVIS Spectrum imaging system. (a) Control liver. (b) Au-injected liver. (c) Control tumor. (d) Au-injected tumor. (e) Control spleen. (f) Au-injected spleen. (g) Top view of kidney with and without Au. (h) Coronal section of kidney with and without Au. Fluorescence intensity is scaled as (a and b) 40,000 to 64,741 counts. (c and d) 11,800 to 16,077 counts. (e and f) 9000 to 14,148 counts. (g) 11,689 to 12,306 counts. (h) 5800 to 7701 counts.  In the injected organs, the fluorescence signal from gold NPs was seen everywhere in the liver and spleen, with distinct concentrated regions in the interior [Figs. 6(b) and 6(f)]. For the tumor, the gold NPs were concentrated in the core of the lesion [Fig. 6(d)]. The autofluorescence in the kidneys [Fig. 6(g)] was difficult to eliminate completely. When the kidneys were sliced coronally [Fig. 6(h)], it was found that the fluorescence signal was mostly from the outer layers of the kidney, most likely the renal capsule or cortex. The signal in spleen was likely somewhat attenuated by quenching due to the high concentration of Au present (see Figs. 8 and 9 in the Appendix). The localization of gold NPs throughout the entire liver is consistent with previous observations that Kupffer cells throughout the liver are responsible for the retention of gold NPs.19 In the kidney, gold NPs were found mainly in the renal capsule and cortex, which suggested that gold NPs that were cleared into the renal tubule were excreted in the urine without being reabsorbed in the renal pelvis. 3.4.Comparing Between ICP-MS, PA Imaging, and NIR Fluorescence ImagingBoth PA imaging and NIR fluorescence imaging of all organs with Au-tiopronin NPs generally matched the trend of Au concentration results as determined quantitatively by ICP-MS. In the liver, PA imaging revealed that gold NPs were localized to the surface, while fluorescence imaging showed that the NPs were almost uniformly distributed throughout the organ. In the tumor, both imaging techniques showed lower than expected signal densities as compared to the ICP-MS results. This may be a result of poor vascularization of the LLC as it is exogenous to the athymic nude mice, as well as the size of the tumor used for experimentation that has a reduced EPR effect.46 In the spleen, PA imaging showed high concentration of Au-tiopronin throughout the organ, whereas fluorescence imaging showed similar results but with distinctively higher signals at the organ poles. This may suggest that Au-tiopronin accumulates distal to the splenic hilum. In the kidneys, both imaging modalities are in agreement in demonstrating that Au-tiopronin is mainly in the renal cortex or capsule. However, the high degree of intrinsic autofluorescence made it difficult to make direct comparisons between the renal tissue and other organs. The fixation process of the tissues ex vivo with glutaraldehyde also contributes the autofluorescence. While there are some proposed methods of minimizing autofluoresence in the fixation process, there are currently no effective strategies to eliminate kidney autofluoresence in vivo other than improving the quantum yield of the fluorescent contrast agent47 or using agents that emit more deeply in the infrared. 4.ConclusionThis study demonstrated that tiopronin-capped gold NPs may be used as agents for fluorescence and PA imaging for determining their biodistribution in organs and tumors. Both imaging techniques correlate well with one another and are in agreement with the bulk-organ level ICP-MS data. As Au-tiopronin NPs have already been demonstrated to be promising drug carriers for cancer treatment, these results suggest PA and fluorescence imaging may potentially be used to track this drug delivery process. The differences in the patterns seen with fluorescence versus PA imaging illustrate the strengths and weaknesses of each technique. Fluorescence signals may be obscured by autofluorescence, and at high concentrations, fluorescent NPs self-quench. AppendicesAppendixCharacterization of spectra of particles in situ or in phantoms was performed in order to facilitate interpretation of the in vivo data. Particles in aqueous solution were aggregated by lowering the pH of the solution with HCl until visible agglomeration occurred. The PA spectra of these aggregated particles are shown compared with the well dispersed particles in Fig. 7. Fluorescence spectra were also acquired from particles in solution at different concentrations in order to evaluate the self-quenching of AuNP emission. As can be seen in Fig. 8, a reduction in signal intensity occurred at as compared with concentration. At concentration, the signal was weaker than at 30 nM. The same effect was observed in a tissue phantom (Fig. 9). Fig. 8Indicated concentrations of AuNP (in ) imaged with the IVIS system. Images were acquired using 675-nm excitation and 780-nm emission filters. As concentration increases, the AuNP fluorescence self-quenches. 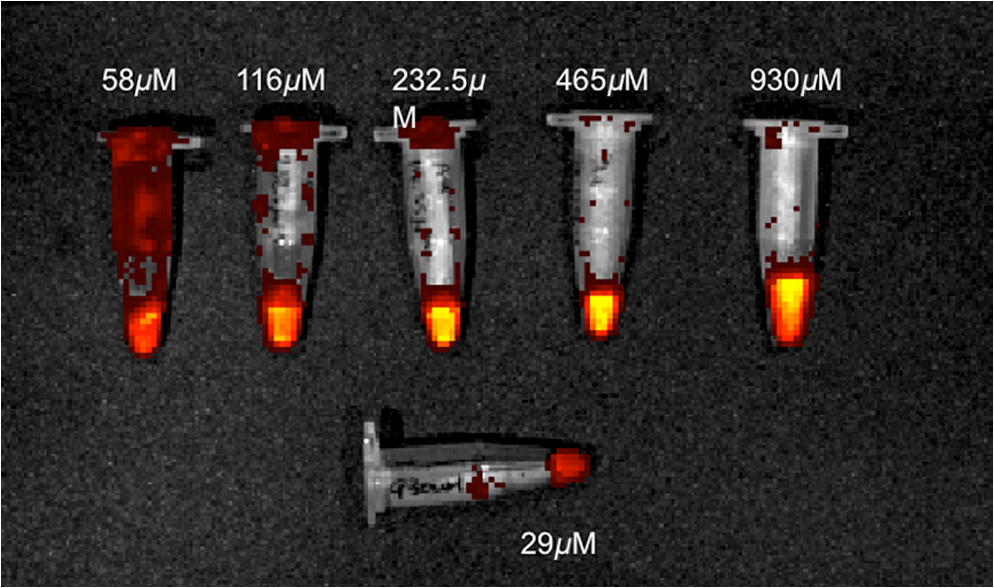 Fig. 9Image of a raw chicken thigh (as a tissue phantom) taken with the IVIS system after injection of of indicated concentrations of AuNP. Images were acquired using 675-nm excitation and 780-nm emission filters. A similar trend was observed in the tissue phantom scenario as with the AuNP in Eppendorf tubes. As concentration increases, the AuNP fluorescence self-quenches.  AcknowledgmentsJ. L. N. and W. P. acknowledge the NSERC/CIHR CHRP Grant 385909-10, the MDEIE PSR-SIIRI-562, and NSERC Individual Discovery RGPIN 312970-2013. X. Z. was supported by an FRSQ graduate fellowship. W. P. was supported by a CIHR graduate fellowship. J. L. N. acknowledges salary support from Canada Research Chairs. ReferencesI. H. El-Sayed, X. Huang and M. A. El-Sayed,
“Selective laser photo-thermal therapy of epithelial carcinoma using anti-EGFR antibody conjugated gold nanoparticles,”
Cancer Lett., 239
(1), 129
–135
(2006). http://dx.doi.org/10.1016/j.canlet.2005.07.035 CALEDQ 0304-3835 Google Scholar
X. Huang et al.,
“Cancer cell imaging and photothermal therapy in the near-infrared region by using gold nanorods,”
J. Am. Chem. Soc., 128
(6), 2115
–2120
(2006). http://dx.doi.org/10.1021/ja057254a JACSAT 0002-7863 Google Scholar
B. Khlebtsov et al.,
“Optical amplification of photothermal therapy with gold nanoparticles and nanoclusters,”
Nanotechnology, 17
(20), 5167
–5179
(2006). http://dx.doi.org/10.1088/0957-4484/17/20/022 NNOTER 0957-4484 Google Scholar
J. F. Hainfeld et al.,
“Gold nanoparticles enhance the radiation therapy of a murine squamous cell carcinoma,”
Phys. Med. Biol., 55
(11), 3045
–3059
(2010). http://dx.doi.org/10.1088/0031-9155/55/11/004 PHMBA7 0031-9155 Google Scholar
D. B. Chithrani et al.,
“Gold nanoparticles as radiation sensitizers in cancer therapy,”
Radiat. Res., 173
(6), 719
–728
(2010). http://dx.doi.org/10.1667/RR1984.1 RAREAE 0033-7587 Google Scholar
X. Zhang et al.,
“Ultrasmall gold–doxorubicin conjugates rapidly kill apoptosis-resistant cancer cells,”
Bioconjugate Chem., 22
(2), 235
–243
(2011). http://dx.doi.org/10.1021/bc100374p BCCHES 1043-1802 Google Scholar
S. Mallidi et al.,
“Multiwavelengthphotoacoustic imaging and plasmon resonance coupling of gold nanoparticles for selective detection of cancer,”
Nano Lett., 9
(8), 2825
–2831
(2009). http://dx.doi.org/10.1021/nl802929u NALEFD 1530-6984 Google Scholar
J. R. Cook, W. Frey and S. Emelianov,
“Quantitative photoacoustic imaging of nanoparticles in cells and tissues,”
ACS Nano, 7
(2), 1272
–1280
(2013). http://dx.doi.org/10.1021/nn304739s 1936-0851 Google Scholar
J. Liu et al.,
“Passive tumor targeting of renal-clearable luminescent gold nanoparticles: long tumor retention and fast normal tissue clearance,”
J. Am. Chem. Soc., 135
(13), 4978
–4981
(2013). http://dx.doi.org/10.1021/ja401612x JACSAT 0002-7863 Google Scholar
N. Desai,
“Challenges in development of nanoparticle-based therapeutics,”
AAPS J., 14
(2), 282
–295
(2012). http://dx.doi.org/10.1208/s12248-012-9339-4 1550-7416 Google Scholar
S. M. Moghimi, A. Hunter and T. Andresen,
“Factors controlling nanoparticle pharmacokinetics: an integrated analysis and perspective,”
Annu. Rev. Pharmacol. Toxicol., 52 481
–503
(2012). http://dx.doi.org/10.1146/annurev-pharmtox-010611-134623 ARPTDI 0362-1642 Google Scholar
M. Longmire, P. L. Choyke and H. Kobayashi,
“Clearance properties of nano-sized particles and molecules as imaging agents: considerations and caveats,”
Nanomedicine (Lond), 3
(5), 703
–717
(2008). http://dx.doi.org/10.2217/17435889.3.5.703 Google Scholar
J. Liu et al.,
“Renal clearable inorganic nanoparticles: a new frontier of bionanotechnology,”
Mater. Today, 16
(12), 477
–486
(2013). http://dx.doi.org/10.1016/j.mattod.2013.11.003 MATOBY 0096-4867 Google Scholar
B. Wang et al.,
“Metabolism of nanomaterials in vivo: blood circulation and organ clearance,”
Acc. Chem. Res., 46
(3), 761
–769
(2013). http://dx.doi.org/10.1021/ar2003336 ACHRE4 0001-4842 Google Scholar
Z. Amoozgar and Y. Yeo,
“Recent advances in stealth coating of nanoparticle drug delivery systems,”
Wiley Interdiscip. Rev.: Nanomed. Nanobiotechnol., 4
(2), 219
–233
(2012). http://dx.doi.org/10.1002/wnan.1157 Google Scholar
F. Alexis et al.,
“Factors affecting the clearance and biodistribution of polymeric nanoparticles,”
Mol. Pharm., 5
(4), 505
–515
(2008). http://dx.doi.org/10.1021/mp800051m MOPMA3 0026-895X Google Scholar
P. P. Karmali and D. Simberg,
“Interactions of nanoparticles with plasma proteins: implication on clearance and toxicity of drug delivery systems,”
Expert Opin. Drug Deliv., 8
(3), 343
–357
(2011). http://dx.doi.org/10.1517/17425247.2011.554818 EODDAW 1742-5247 Google Scholar
S. K. Balasubramanian et al.,
“Biodistribution of gold nanoparticles and gene expression changes in the liver and spleen after intravenous administration in rats,”
Biomaterials, 31
(8), 2034
–2042
(2010). http://dx.doi.org/10.1016/j.biomaterials.2009.11.079 BIMADU 0142-9612 Google Scholar
E. Sadauskas et al.,
“Protracted elimination of gold nanoparticles from mouse liver,”
Nanomed., 5
(2), 162
–169
(2009). http://dx.doi.org/10.1016/j.nano.2008.11.002 1743-5889 Google Scholar
V. Torchilin,
“Tumor delivery of macromolecular drugs based on the EPR effect,”
Adv. Drug Deliv. Rev., 63
(3), 131
–135
(2011). http://dx.doi.org/10.1016/j.addr.2010.03.011 ADDREP 0169-409X Google Scholar
A. K. Iyer et al.,
“Exploiting the enhanced permeability and retention effect for tumor targeting,”
Drug Discov. Today, 11
(17–18), 812
–818
(2006). http://dx.doi.org/10.1016/j.drudis.2006.07.005 DDTOFS 1359-6446 Google Scholar
P. Chastagner et al.,
“Preclinical studies of pegylated- and non-pegylated liposomal forms of doxorubicin as radiosensitizer on orthotopic high-grade glioma xenografts,”
Pharm. Res., 32
(1), 158
–166
(2015). http://dx.doi.org/10.1007/s11095-014-1452-x PHREEB 0724-8741 Google Scholar
A. Gabizon, H. Shmeeda and T. Grenader,
“Pharmacological basis of pegylated liposomal doxorubicin: Impact on cancer therapy,”
Eur. J. Pharm. Sci., 45
(4), 388
–398
(2012). http://dx.doi.org/10.1016/j.ejps.2011.09.006 EPSCED 0928-0987 Google Scholar
S. A. Abraham et al.,
“The liposomal formulation of doxorubicin,”
Liposomes, Part E, 71
–97 Elsevier(2005). Google Scholar
E. Ciruelos and C. Jackisch,
“Evaluating the role of nab-paclitaxel (Abraxane) in women with aggressive metastatic breast cancer,”
Expert Rev. Anticancer Ther., 14
(5), 511
–521
(2014). http://dx.doi.org/10.1586/14737140.2014.883922 ERATBJ 1473-7140 Google Scholar
J. Lee et al.,
“Gold nanoparticles in breast cancer treatment: promise and potential pitfalls,”
Cancer Lett., 347
(1), 46
–53
(2014). http://dx.doi.org/10.1016/j.canlet.2014.02.006 CALEDQ 0304-3835 Google Scholar
B. Duncan, C. Kim and V. M. Rotello,
“Gold nanoparticle platforms as drug and biomacromolecule delivery systems,”
J. Controlled Release, 148
(1), 122
–127
(2010). http://dx.doi.org/10.1016/j.jconrel.2010.06.004 JCREEC 0168-3659 Google Scholar
R. Cao-Milan and L. M. Liz-Marzan,
“Gold nanoparticle conjugates: recent advances toward clinical applications,”
Expert Opin. Drug Deliv., 11
(5), 741
–752
(2014). http://dx.doi.org/10.1517/17425247.2014.891582 EODDAW 1742-5247 Google Scholar
G. F. Paciotti et al.,
“Colloidal gold: a novel nanoparticle vector for tumor directed drug delivery,”
Drug Deliv., 11
(3), 169
–183
(2004). http://dx.doi.org/10.1080/10717540490433895 DDELEB 1521-0464 Google Scholar
K. Y. Huang et al.,
“Size-dependent localization and penetration of ultrasmall gold nanoparticles in cancer cells, multicellular spheroids, and tumors in vivo,”
ACS Nano, 6
(5), 4483
–4493
(2012). http://dx.doi.org/10.1021/nn301282m 1936-0851 Google Scholar
X. H. Huang et al.,
“A reexamination of active and passive tumor targeting by using rod-shaped gold nanocrystals and covalently conjugated peptide ligands (vol 4, pg 5887, 2010),”
Acs Nano, 5
(8), 6765
(2011). http://dx.doi.org/10.1021/nn2027837 1936-0851 Google Scholar
A. M. Smith et al.,
“Bioconjugated quantum dots for in vivo molecular and cellular imaging,”
Adv. Drug Deliv. Rev., 60
(11), 1226
–1240
(2008). http://dx.doi.org/10.1016/j.addr.2008.03.015 ADDREP 0169-409X Google Scholar
H. C. Fischer and W. C. Chan,
“Nanotoxicity: the growing need for in vivo study,”
Curr. Opin. Biotechnol., 18
(6), 565
–571
(2007). http://dx.doi.org/10.1016/j.copbio.2007.11.008 CUOBE3 0958-1669 Google Scholar
N. Khlebtsov and L. Dykman,
“Biodistribution and toxicity of engineered gold nanoparticles: a review of in vitro and in vivo studies,”
Chem. Soc. Rev., 40
(3), 1647
–1671
(2011). http://dx.doi.org/10.1039/C0CS00018C CSRVBR 0306-0012 Google Scholar
L. Yu and A. Andriola,
“Quantitative gold nanoparticle analysis methods: a review,”
Talanta, 82
(3), 869
–875
(2010). http://dx.doi.org/10.1016/j.talanta.2010.06.017 TLNTA2 0039-9140 Google Scholar
G. P. Luke, D. Yeager and S. Y. Emelianov,
“Biomedical applications of photoacoustic imaging with exogenous contrast agents,”
Ann. Biomed. Eng., 40
(2), 422
–437
(2012). http://dx.doi.org/10.1007/s10439-011-0449-4 ABMECF 0090-6964 Google Scholar
C. C. Huang et al.,
“Synthesis of highly fluorescent gold nanoparticles for sensing mercury (II),”
Angew. Chem., 119
(36), 6948
–6952
(2007). http://dx.doi.org/10.1002/(ISSN)1521-3757 ANCEAD 0044-8249 Google Scholar
E. A. Sykes et al.,
“Nanoparticle exposure in animals can be visualized in the skin and analysed via skin biopsy,”
Nat. Commun., 5 3796
(2014). http://dx.doi.org/10.1038/ncomms4796 NCAOBW 2041-1723 Google Scholar
A. Maeda et al.,
“Dual in vivo photoacoustic and fluorescence imaging of HER2 expression in breast tumors for diagnosis, margin assessment, and surgical guidance,”
Mol. Imaging, 13
(0), 1
–9
(2014). MIOMBP 1535-3508 Google Scholar
L. Wang et al.,
“Combined photoacoustic and molecular fluorescence imaging in vivo,”
190
–192
(2005). Google Scholar
W. J. Akers et al.,
“Noninvasive photoacoustic and fluorescence sentinel lymph node identification using dye-loaded perfluorocarbon nanoparticles,”
ACS Nano, 5
(1), 173
–182
(2011). http://dx.doi.org/10.1021/nn102274q 1936-0851 Google Scholar
J. James, V. M. Murukeshan and L. S. Woh,
“Integrated photoacoustic, ultrasound and fluorescence platform for diagnostic medical imaging-proof of concept study with a tissue mimicking phantom,”
Biomed. Opt. Express, 5
(7), 2135
–2144
(2014). http://dx.doi.org/10.1364/BOE.5.002135 BOEICL 2156-7085 Google Scholar
E. Guerrero et al.,
“Surface plasmon resonance and magnetism of thiol-capped gold nanoparticles,”
Nanotechnology, 19
(17), 175701
(2008). http://dx.doi.org/10.1088/0957-4484/19/17/175701 NNOTER 0957-4484 Google Scholar
J. L. Kovar et al.,
“A systematic approach to the development of fluorescent contrast agents for optical imaging of mouse cancer models,”
Anal. Biochem., 367
(1), 1
–12
(2007). http://dx.doi.org/10.1016/j.ab.2007.04.011 BICHAW 0006-2960 Google Scholar
P. Zou et al.,
“Burst release of lipophilic drugs from poly (ethylene oxide)-B-polystyrene micelles is not caused by micelle disassembly,”
J. Tumor, 1
(2), 7
–15
(2013). JTOUBP Google Scholar
R. Duncan et al.,
“Validation of tumour models for use in anticancer nanomedicine evaluation: the EPR effect and cathepsin B-mediated drug release rate,”
Cancer Chemother. Pharmacol., 72
(2), 417
–427
(2013). http://dx.doi.org/10.1007/s00280-013-2209-7 CCPHDZ 0344-5704 Google Scholar
Y. Sun et al.,
“Sudan black B reduces autofluorescence in murine renal tissue,”
Archiv. Pathol. Lab. Med., 135
(10), 1335
–1342
(2011). http://dx.doi.org/10.5858/arpa.2010-0549-OA APLMAS 0003-9985 Google Scholar
BiographyWilson Poon obtained a BASc in engineering science, specializing in biomedical engineering (University of Toronto, Canada, 2012) and an ME degree in biomedical engineering (McGill University, Canada, 2015). He is currently a PhD student at the Institute of Biomaterials and Biomedical Engineering at the University of Toronto. His current research projects are related to engineering nanobio interactions, with particular focus on the mononuclear phagocyte system. Andrew Heinmiller earned his master’s degree working on the neurobiology of drug addiction at the University of Toronto. At FUJIFILM VisualSonics, Inc., along with colleagues and collaborators, he has played a key role in application research and development for photoacoustic imaging since June 2010. In his current role as a product manager, he is responsible for continuing to develop the Vevo LAZR system and its applications including brain imaging and photoacoustic contrast agent applications. Xuan Zhang received her BS in biochemistry from McGill University in 2009, Montreal, Canada, and her PhD in biomedical engineering from McGill in 2015 in the laboratory of Jay Nadeau. Her thesis title was “Targeting melanoma with gold-nanoparticle-delivered doxorubicin.” Jay L. Nadeau is an associate professor of biomedical engineering and physics at McGill University (2004-present). Before McGill, she was a member of the Jet Propulsion Laboratory’s Center for Life Detection and previous to that a Burroughs-Wellcome postdoctoral scholar in the laboratory of Henry A. Lester at Caltech. She received her PhD in physics from the University of Minnesota in 1996. |
||||||||||||||||||||||||||||||||||||||||||||||||||||||