
|
|
1.IntroductionAlthough much is known about the respiratory system, details of ventilation on the alveolar scale are still missing. On an alveolar level, we find animal studies investigating in vivo the dynamic behavior of lung parenchyma using intravital microscopy (IVM).1–7 Quantitative image analysis of such images can provide the mechanical characteristics of alveolar tissue, which can further be used to model lung mechanics in various states of the parenchyma.8,9 But what exactly do we see on IVM images of alveoli? Where do the bright structures come from? What do we have to keep in mind when we interpret IVM images of the parenchyma? The aim of this study is to answer these questions. IVM is the gold standard for imaging alveoli. It yields high-resolution real-time two-dimensional (2-D) information as well as functional imaging using fluorescent biomarkers.10 Apart from a few contributions on confocal fluorescence IVM,11 IVM is mainly carried out in dark field illumination using white light and can technically be attributed to conventional dark field microscopy. The main disadvantage of IVM lies in the limitation to 2-D imaging, which is hampering the access of alveolar volume information. As an extension to this 2-D modality, optical coherence tomography (OCT) has been proposed to provide real-time cross-sectional images, which can be combined with three-dimensional (3-D) data stacks. Like IVM, OCT has been used to study distension characteristics of alveoli.12–15 Recently, it has been shown that this method also offers 3-D nearly real-time recording of lung tissue dynamics.14,15 It is a contactless high-resolution technique suitable for revealing alveolar volumes, but has a limitation in resolving alveolar septa and functional tissue components. Since this imaging modality makes cross-sectional views of the tissue available, it can be applied complementary to IVM to have access to the third dimension, i.e., depth information. As in every optical technique, IVM images result from interaction of light with tissue and are sensitive to light propagation. Especially in alveolar tissue, optical artifacts appear due to air-filled volumes embedded in the surrounding tissue, which has a higher refractive index similar to water. In this environment, the light is refracted, reflected, scattered, and absorbed. The dark field illumination setup used for lung imaging mostly utilizes a ring light which illuminates the sample under a high angle to exclude the strong reflex from the pleural surface of the lung. Figure 1 shows a typical IVM image of alveoli. Each alveolus is accompanied by a bright outer circular reflex and a weaker inner circular reflex, which we call a double-ring structure. The bright reflexes are mostly interpreted as the lining of the alveolar lumen,5,7,16 but it is unclear why the lining appears bright. Assuming partial reflection at the tissue–air interface, these reflexes would not represent the alveolar wall, but points on the alveolar surface with a certain angle with respect to the light source. Therefore, the origin of the circular structures is not entirely understood. Considering these facts, it is hardly possible to determine the exact position of the alveolar wall using only the bright circular structures, and is even less possible to rely on the absolute values of the measured alveolar area. Another feature of IVM images of alveoli is that these bright circles disappear if a refractive index matching is implemented, i.e., filling the lung with a medium having almost the same refractive index as that of the surrounding tissue.17 Fig. 1A typical dark field intravital microscopy (IVM) image of alveolar tissue showing bright circular reflexes (solid arrow), currently interpreted as alveolar borders. These structures surround weaker reflexes (dashed arrow), whose origin is yet unknown. .  Hence, how can we find the true position of the alveolar wall from IVM images? How do we explain the origin of characteristic image features? How can we distinguish collapse from liquid filling? In an early work, we used combined OCT and IVM together with theoretical considerations to address these questions.18 Here, we analyze in more detail the light propagation in dark field microscopy by simulating the tissue and the imaging setup in a ray tracing software. A simplified mouse parenchyma model is applied to study the ray propagation and IVM image formation in lung tissue. From these findings, light propagation processes based on geometrical optics are identified, which mainly contribute to the imaging characteristics of IVM data. Deduced from the ray paths, a mathematical model is introduced to estimate the actual lining of the alveoli within an IVM image of lung tissue, yielding reasonable results. With this, a comprehensive interpretation of IVM images becomes available enabling sensible size estimates in studies of alveolar dynamics. 2.Material and Methods2.1.Optical SetupThe optical setup used in this study combines IVM and OCT for simultaneous image acquisition. A scheme of the setup is shown in Fig. 2. The principle of image acquisition was previously described elsewhere.13 In this paper’s configuration, the optical resolution of the IVM, limited by the numerical aperture of the system, amounts to approximately . With a field of view of , the pixel resolution leads to , yielding an oversampling by a factor of 4. The speed of the system was set to 12.5 fps. IVM imaging is performed by using a dark field illumination with a ring of 24 light-emitting diodes (LEDs) surrounding the objective lens and yielding an incidence angle of 45 deg. Color image acquisition was achieved utilizing a pixel complementary metal oxide semiconductor camera (Sumix, United States) with a pixel size of . The optics was designed to yield a telecentric ray propagation in object space to prevent changes in magnification due to axial movement of the object. OCT images were simultaneously acquired by IVM. The free-space optical resolution is in the lateral direction and in the axial direction. Oversampling yields a voxel size of with a lateral depth scan rate of 12 kHz and a maximum field of view of . Fig. 2Optical setup for combined IVM and optical coherence tomography (OCT) imaging. A fiber coupler and a single-mode fiber (SMF) connect the near-infrared (NIR) light source (SLD) with the interferometer, integrated in the scanner head, and with the spectrometer. The NIR light is coupled into the interferometer by the collimator (C) and divided into reference and sample beam by a beam splitter (BS). The sample beam is deflected by a scanner unit (SU) for and directions and focused by an objective lens (OL) onto the sample. The backscattered light is superimposed with the reference light, first focused by the reference lens (RL) and then reflected by the reference mirror (RM), coupled into the SMF and transmitted to the spectrometer, where it is spectrally resolved. A dichroic mirror (DM) separates the light for intravital microscopy (IVM), which is then focused with the camera lens (CL). The IVM image is acquired by a complementary metal oxide semiconductor camera, which is also integrated into the scanner head. A ring light, consisting of 24 super high light-emitting diodes (LEDs), is positioned at the front of the scanner head above the sample for IVM-illumination (light pathway indicated by dashed lines and dark gray color). 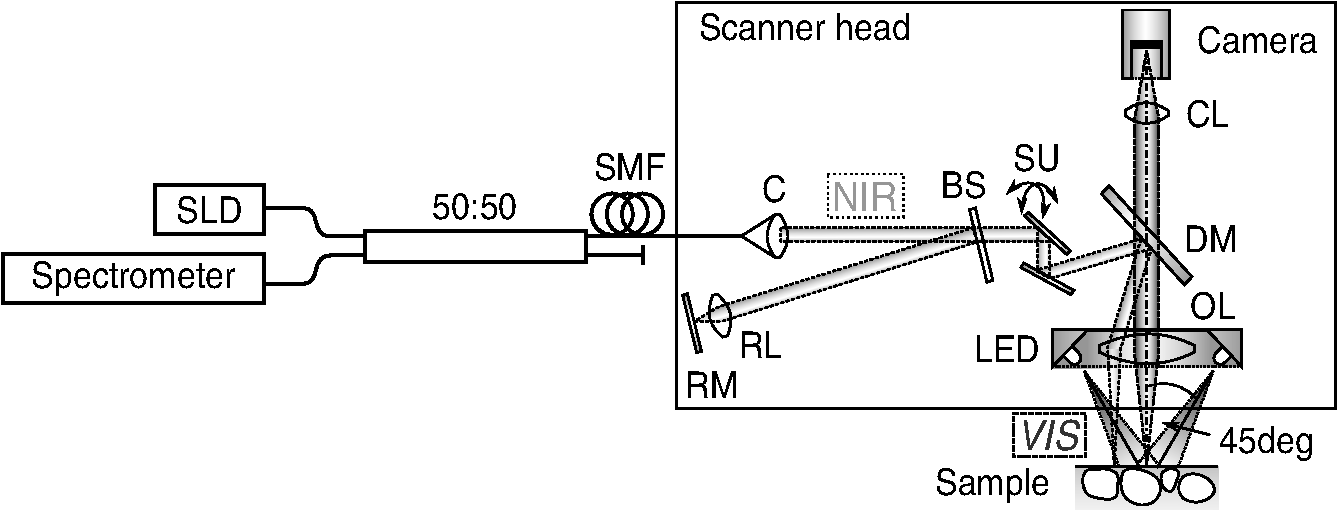 2.2.Lung Tissue PreparationAs an animal model for the study of image formation of subpleural alveoli with IVM and OCT, we used a preparation method for in vivo experiments.19,20 According to the guidelines of the governmental authorities, we utilized mice post mortem instead of living animals. Mice were anesthetized and sacrificed via exsanguination. To gain optical access to the upper alveoli, a thorax window was prepared by removing three ribs of the chest above the middle lobe of the right mouse lung. After introducing a thoracic catheter into the chest and resealing the window with a transparent wrapping film, the intrathoracic pressure was reconstituted by sucking out the excess air. Ventilation was performed utilizing a trachea tube and a customized ventilator capable of air- and perfluorodecalin-(F2 Chemicals Ltd., United Kingdom) based liquid ventilation.17 IVM as well as OCT images were acquired at constant pressures set by the ventilator for air as well as liquid ventilation within physiological limits (12 mbar peak pressure). 2.3.SimulationFor the simulations, the ray tracing software TracePro® was used. To minimize computational effort, two kinds of tracing techniques were applied, reverse and direct ray tracing. Reverse ray tracing was performed by using the rendering or radiance ray tracing option in TracePro®, see also Fig. 3(a). This was utilized to obtain intensity images or radiance maps of the model for a given point of view set by the eye position of the virtual camera. Since this method only traces ray paths that contribute to the image formation, the number of rays traced can be reduced up to a factor of 2500. For these kinds of simulations, the light source was modeled as a light ring under 45 deg with Lambert properties. The simulated image was obtained by placing a virtual pinhole camera far above the model (100 mm). For each analysis pixel, 150 to 200 rays were traced from the fixed point at the camera position through a random position on the analysis plane to the model until they reached a light source. Analysis pixel size was set to . For direct ray tracing, see Fig. 3(b) which reveals the traveling paths of the rays, a light sheet (incidence angle 45 deg, 100,000 to 500,000 rays) illuminated the model. Reflection, transmission, and refraction of the rays were traced according to the optical properties and the geometry of the model including wave properties such as Fresnel reflections. Rays leaving the model in a normal direction were selected with a ray selecting plane far away from the model, resulting in angles of relative to the normal on the pleura. These ray paths are displayed and the intensity is analyzed when the rays leave the model. Fig. 3Simulation setup and model of alveolar tissue. (a) Reverse ray tracing image is obtained with a virtual camera and an illumination with a light ring. (b) In direct ray tracing, rays are traced from a 45-deg light sheet through the model until they leave the model in normal direction. The virtual camera in (a) as well as the ray selection plane in (b) are located far away from the model, which corresponds to a detection of rays leaving the model in normal direction ( to the normal on the pleura). (c) Modeling of alveolar tissue by using hexagonally shaped alveoli. Abbreviations are: alveolus (A), pleural surface (PS), tissue (T).  For the simulation, our simplified model of alveolar tissue uses typical geometries found for a mouse lung21 and consists of six hexagonal structures which were placed in a ring around a seventh center alveolus, see Fig. 3(c). These structures were filled with air and the refractive index of the tissue was set to 1.38.22 Parameter variation included a shift of the center alveolus downward and fluid filling of the center alveolus [refractive index 1.31 according to the manufacturer information for perfluorodecalin (F2 chemicals Ltd., United Kingdom)]. 3.Results3.1.Experimental Investigations on Liquid-Filled Lung TissueA typical IVM image of a partially liquid-filled in situ mouse lung is displayed in Fig. 4(a). Representative characteristics of the IVM images are given by bright reflexes lining bubble-like structures in the air-filled area (triangle with solid contour) and forming more or less a double ring. The bright reflexes are currently used as a border for the discrimination between alveolar lumen and tissue.2–4,7 At the transition to liquid filling, the bright reflexes show decreased intensity at the side facing the liquid-filled area compared to the side facing the air-filled region [asterisk in Fig. 4(a)]. The double ring structure finally disappears in the liquid-filled space as a result of the index matching. The corresponding OCT cross section in Fig. 4(b) additionally shows the depth information of the tissue at the position marked with the white-dotted line in Fig. 4(a). Alveolar lumina appear as dark circular structures within the scattering tissue, which is visible in grayscale. The OCT data in Fig. 4(b) perfectly reveal the transition between the liquid-filled and the air-filled alveolar area (marked with an asterisk). The alveolar structures are still recognizable in the liquid-filled region in contrast to the appearance in the IVM image of Fig. 4(a). Additionally, Fig. 4(c) shows an en face section through the 3-D OCT data stack [marked with the curved dash-dotted line in Fig. 4(b)], which illustrates data points located below the pleura visceralis [marked with pv in Fig. 4(b)]. Similar to the depth cross section of Fig. 4(b), Fig. 4(c) reveals the presence of alveoli within the liquid-filled region of the tissue. Since the OCT images in Figs. 4(b) and 4(c) still show alveoli, we have to realize that IVM images give no information about whether alveoli are collapsed or filled with liquid. Fig. 4Partially liquid-filled lung area acquired with IVM (a) and OCT (b), (c) and (d) using the in situ mouse model at a constant positive airway pressure of 8 mbar after 35 min of liquid ventilation. The view in (c) shows a section through the dash-dotted line in (b), which is formed by all points of the OCT data stack, which are located below the pleura visceralis (pv). The position of the OCT depth cross section (b) is marked with the dotted line in (a) and (c), the abbreviation denotes the surrounding medium above the lung surface, which is air. The index matching caused by the liquid-filling leads to a loss of contrast for IVM resulting in vanishing of alveolar structures, but an increase in contrast and penetration depth for OCT [marked with asterisk in (a) (b) and (c)]. Liquid-filled structures are still detectable with OCT in contrast to IVM images. One typical bright circular structure in IVM is indicated by a triangle with solid contour. Such structures are more pronounced in the case of a slightly underlying neighbor alveolus (triangle with dotted contour); see also the enlarged inset (d) within (b) with indicated alveolar borders. . 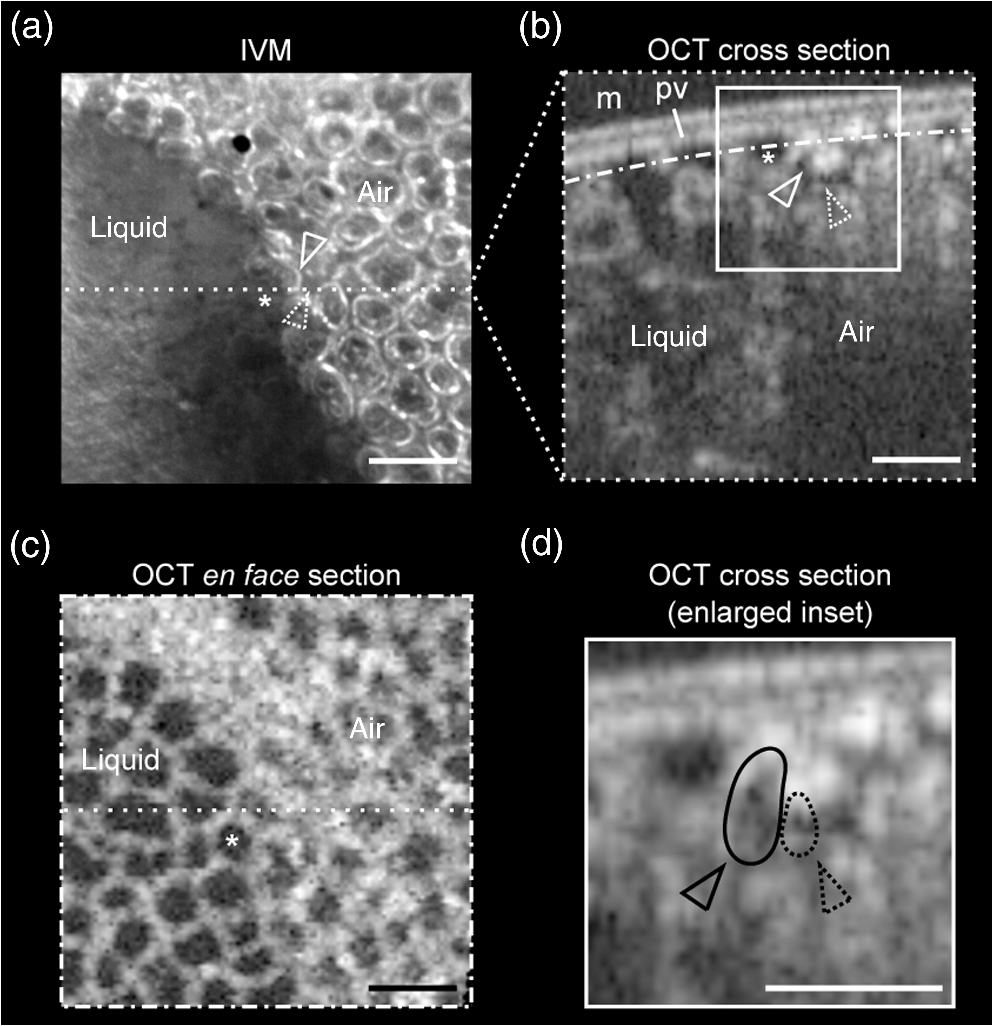 Note the following three peculiarities in IVM images in the transition zone between liquid and air filling: first, double ring structures are present in the air-filled space of the tissue and disappear within the liquid region of the lung, although open alveoli are still present. Second, the bright reflexes are less pronounced at the side of those alveoli, which are located directly at the border between liquid and air filling. These alveoli are still filled with air, but have a neighbor alveolus which is filled with liquid. Third, the bright reflexes in the air-filled space are much more pronounced in the case of alveoli whose adjacent alveolus is placed slightly below them, as indicated by the triangle with a dotted contour in Fig. 4(b) as well as in the enlarged inset given in Fig. 4(d). This behavior leads to the hypothesis of total internal reflection (TIR) between adjacent alveoli, which shall be further studied in the following theoretical section. 3.2.Theoretical ConsiderationsIn IVM, the lung is usually illuminated with a circular light and the camera is positioned in the middle of the ring light. To avoid a direct reflex from the pleura of the lung, the illumination is performed under a certain angle of incidence. The current opinion in IVM studies is that the reflexes visible in the camera image arise from the alveolar walls2–4 or partial reflection at the boundary between tissue and alveolar lumen, which is filled with air.7 Since the distance between the bright reflexes of neighboring alveoli is greater as would be expected for an alveolar septum, the latter hypothesis of partial reflection seems to be more reasonable. This case is illustrated in Fig. 5(a). Using Fresnel equations for a plane wave, the relative power of light reaching the camera along the displayed pathway can be quantified by approximately 2% when assuming an incidence angle of and a refractive index of the tissue of .22 Furthermore, this model does not describe the presence of double rings as well as the loss of brightness of the outer ring when located next to a liquid-filled alveolus. Fig. 5(a) Current model for the formation of the IVM images: rays from a light source are refracted at the pleura, partially reflected at the tissue–air interface of an alveolus located below the pleura and finally reaching the camera perpendicular through the pleura. (b) Proposed model of rays forming total internal reflexes (or nearly total internal reflexes) near the border of alveoli by two reflections. The illuminating ray enters under an entrance angle of (not drawn). The transmitted ray hits alveolus 1 under an angle () at a point where the surface of the alveolus is tilted by relative to the pleura. The reflected part reaches alveolus 2 under the angle and is reflected toward the camera.  To explain a double ring structure, a second process of light propagation should be considered, yielding a brighter outer ring in addition to the inner ring resulting from partial reflection with weaker intensity as mentioned above. Higher intensities for the outer ring would be obtained, for instance, by two times TIR or a mix of TIR or partial reflexes with high incidence angles (nearly TIR), further called multiple internal reflection (MIR), by suggesting a light path between neighboring alveoli as illustrated in Fig. 5(b). The occurrence of MIR depends on the surface angle of the first alveolus, which is defined as the angle between the surface normal of alveolus 1 and the optical axis toward the camera, and the corresponding reflection angle of the second alveolus, respectively. Assuming identical curvatures for both alveoli, the expected relative power of light at the camera position can be calculated via Fresnel equations. The diagram in Fig. 6(a) displays the resulting normalized power in dependence of the surface angle and the corresponding height of the second alveolus fulfilling the angle condition for the pathway sketched in Fig. 5(b). The graph shows that TIR on both alveoli only appears within a given range for (between 16 deg to 28 deg) as well as an upward shift of alveolus 2 toward the pleura compared to alveolus 1. The normalized power in dependence of angle can be found in Fig. 6(b) assuming unpolarized incident light. Even for no displacement of alveolus 2, the normalized power on the camera amounts to approximately 10%. Taking an upward shift of alveolus 2 into account, the relative power even reaches 94%. Both conditions result in a much higher intensity than the partial reflex and are likely to happen since the conditions for this process are met within a broad range of alveolar surface angles and relative heights. Thus, the model of multiple internal reflections between adjacent alveoli perfectly explains the appearance of a bright outer ring surrounding the inner partial reflex at the alveoli. Fig. 6(a) Normalized power reaching the camera after being transmitted at the pleura, reflected at both alveoli and transmitted through the pleura again as a function of both the surface angle and the vertical displacement between alveoli with identical curvatures. A positive value means that alveolus 2 is located nearer to the pleura. The gray value shows the amount of light being transmitted for unpolarized light where black is 1 and white is 0. (b) Amount of light detected at the camera as a function of the surface angle of alveolus 1 by meeting the angle conditions for the pathway shown in Fig. 5(b). The resulting tilt angle is independent from the height or radius of curvatures of the alveoli. For different tilt angles ( and its corresponding ), various conditions can be found for the event of total internal reflection (TIR) (normalized power approximately 0.94). One of these is illustrated for equal curvatures of alveoli and varying height of alveolus 2.  3.3.Ray Tracing ResultsTo verify the hypothesis of multiple internal reflection between adjacent alveoli, alveolar tissue was simulated using reverse [Fig. 3(a)] and direct ray tracing [Fig. 3(b)], respectively, as described in the Methods section using the idealized tissue geometries depicted in Fig. 3(c). According to the findings of the experimental investigations summarized in Sec. 3.1, typical features present in the IVM images [Fig. 7(a) second row] can also be found in the reverse ray tracing simulation results [Fig. 7(a) first row]. The simulated intensity images are inverted for clarity reasons, meaning that a dark color corresponds to a high intensity. The characteristic features found for both the simulation and IVM images are: (1) double ring structures (solid arrow for bright outer ring, dash-dotted arrow for less bright reflex), (2) disappearing of liquid-filled alveoli (asterisk) and decrease of intensity of the bright ring structure adjacent to the liquid-filled region (black solid triangle), and (3) increased intensity of the outer ring of the double ring structure (triangle with solid contour) in the case of a downward shift of an adjacent alveolus (triangle with dotted contour), which goes along with decreased intensity of the outer ring of the shifted alveolus. Fig. 7(a) Comparison between simulation and imaging results for the alveolar model geometry [Fig. 3(c)] and mouse lung tissue, respectively. Within the simulation, all alveoli are filled with air (refractive index ) except for the case of liquid filling (center alveolus filled with liquid , marked with asterisk). The axial position of the center alveolus is displayed within the simulation results ( corresponds to the same axial position compared to the surrounding alveoli, corresponds to an axial position below the neighbor alveoli). Characteristic features are the following: first, the appearance of double ring structures (solid arrow for outer ring, dash-dotted arrow for inner ring), second the vanishing of alveoli (asterisk) and the loss of intensity of the outer ring facing the liquid region (black solid triangle, please also compare the simulated intensities for the outer rings between the air-filled and the liquid-filled cases, i.e., solid arrow and solid triangle), and third the increase of intensity of the outer ring (triangle with black solid contour) if positioned next to an alveolus, which is slightly located below (triangle with black-dotted contour), combined with a decreased outer contour intensity of the lower alveolus (black-dotted contour, position assumed in the IVM image, but not visible). (b) Direct ray tracing and ray propagation for the alveolar model tissue as well as the resulting simulated intensity image revealed by the reverse ray tracing method. . 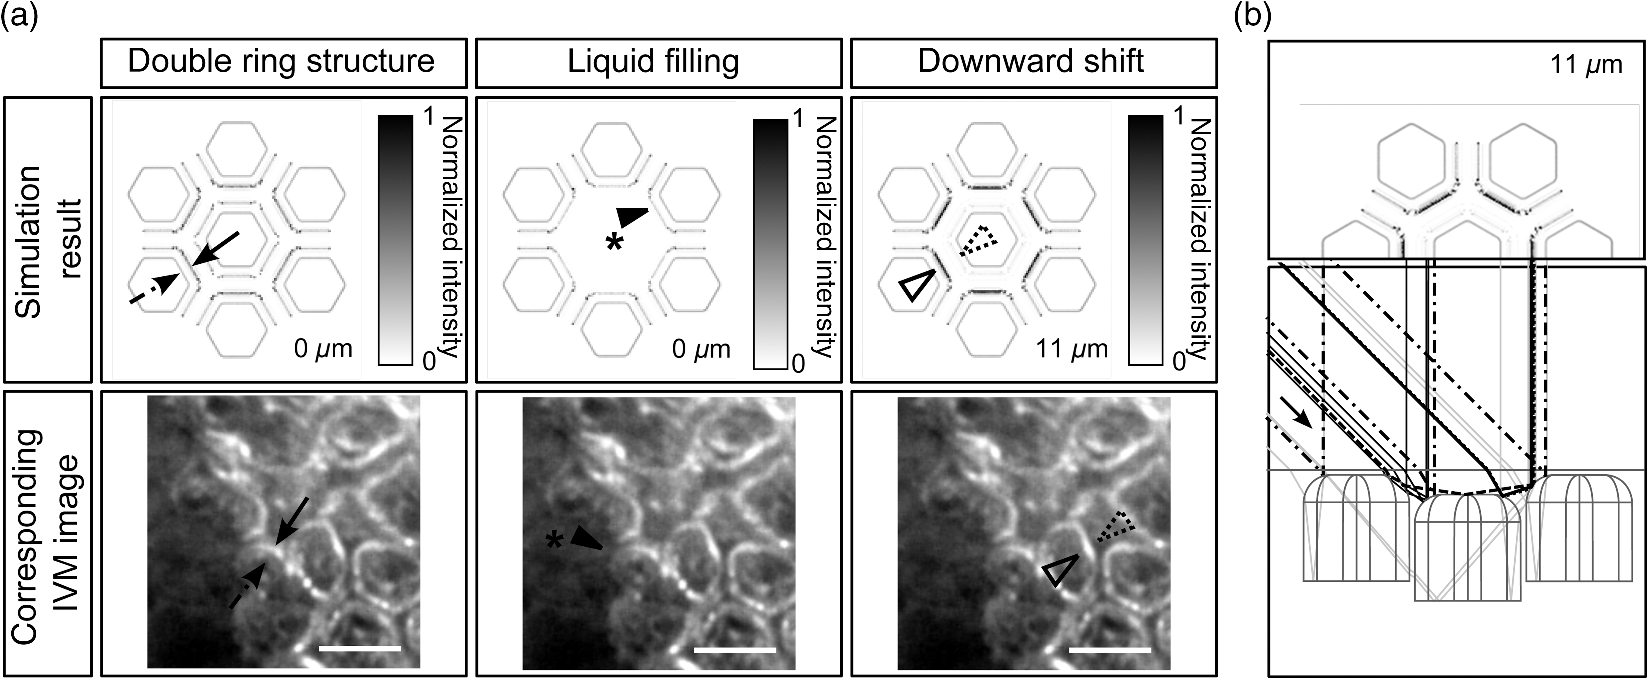 Using direct ray tracing, the beam paths, which form the intensity distribution of the reverse ray tracing results in Fig. 7(a), can be further analyzed and attributed to specific light interaction processes [Fig. 7(b)]. From this, two major sets of rays can be attributed to form the different circular structures: partially reflected rays at the surface of the alveoli (dash-dotted lines) as well as rays, which are deflected by double TIR or nearly TIR () first at a deeper lying alveolus and second from a neighbor alveolus positioned slightly above the first one (solid line). Comparing these pathways with the resulting intensities [first row of Fig. 7(b)], the partially reflected rays can be attributed to the less bright inner reflexes, whereas light propagating via multiple internal reflection forms strong outer rings around the inner weaker reflexes. In addition, rays that are both reflected and refracted at the corner of an alveolus can produce a slightly darker reflex almost collocated with the MIR reflex. In Fig. 7(b), such a path can be found very close to the strong solid line, but slightly shifted to the right at the left edge of the right alveolus. Strong signals can also be produced by multiple reflections at the surfaces of more than two alveoli as the dashed ray path shows, but they nearly coincide with the MIR reflex. The initial reflection might be far away from the alveolus with the last, image-relevant reflection. Altogether, these ray paths confirm the theoretical assumption of two basic processes forming the double ring structure in IVM images of lung tissue: the bright outer ring corresponds to multiple internal reflections between adjacent alveoli and the inner ring, which has lower intensity, corresponds to partial reflection at the surface of the alveoli. 3.4.Alveolar Wall Position and Edge Radii in Intravital Microscopy ImagesAs we have seen from the ray tracing results, the origin of the reflexes visible in the IVM images can be attributed to MIR for the bright outer circles and partial reflection for the weaker inner circles of the double ring structure. As the angle of the alveolar surface at the position of these two reflexes is reasonably known, the true position of the alveolar wall as well as the edge radius can be approximated when assuming a similar geometry as the model alveoli with constant curvature in the cross section. Since in most IVM setups, the camera is positioned along the normal of the pleural surface, we can also neglect pleural tilts in the mathematical derivations. For a correction of the measured alveolar outline, the following parameters have to be extracted from the IVM image [see Fig. 8(a)]: , which is the distance between the partial and the multiple internal reflexes at a certain point on the outer ring; and , the corresponding position of the MIR reflex. Furthermore, the angle of incidence () and the refractive index of the tissue () have to be known. Fig. 8(a) Draft of two neighboring subpleural alveoli describing the necessary geometric parameters for the calculation of the true alveolar size based on the position of the reflexes in the intensity image: is the angle of incidence, is the angle of partially reflected rays, is the angle of MIR rays, is the distance between the partially reflected and the MIR rays corresponding to one point on the bright MIR outline of the alveolus, is the corresponding position of the MIR point for distance , is the corresponding expected position of the alveolar septa for distance , is the radius of the curvature of one alveolus in a cross section at one MIR point, i.e., edge radius. (b) IVM image of mouse lung parenchyma used as an example for the estimation of the alveolar wall position by measuring the distances between the partial and the MIR reflexes. The results are displayed in (c) with dash-dotted lines indicating partial reflexes, solid lines indicating total internal reflexes, and dotted lines showing the position of alveolar septa. White arrows indicate additional complex structures, which could arise from partial reflexes due to folding of the upper alveolar tissue or from deeper lying borders of the alveoli (e.g., alveolar mouths). (d) Increase of segmented area after correction [area enclosed by dotted lines in (c)] relative to the area segmented from MIR-reflexes [enclosed by solid lines in (c)]. (e) Relation between the mean alveolar edge radius over the corresponding corrected area . .  The position of the alveolar septa corresponding to a radius of the alveolar edge [see Figure 8(a) for comparison] can be expressed by using as the critical angle for TIR [ with the refractive index of the tissue]. The radius at the edge of the alveolus can be derived from the relation with the distance between the inner partial reflex and outer multiple internal reflection reflex at the circumferential position as well as the angle of partial reflection {·arcsin[]}. Using Eq. (2) in Eq. (1), the position of the alveolar septa can be approximated by for every point on the MIR outline.An example for the calculation of the true alveolar border using IVM data is shown in Figs. 8(b) and 8(c). In the presented image, the incidence angle amounts to 45 deg. Using a refractive index of 1.38 for lung tissue, results in approximately 15.4 deg and equals 46.4 deg. The partial reflexes [dash-dotted lines in Fig. 8(c)] as well as the MIR reflexes [solid lines in Fig. 8(c)] are manually retraced. Via image processing, the shortest distances between the dash dotted and the solid line were measured and used for calculation of the true positions of the alveolar septa [dotted lines in Fig. 8(c)] for each point along the segmented path of the outer ring. Although this model is very simple, the calculated positions of septa from neighboring alveoli are often very near to each other, in agreement with the small thickness of alveolar septa. Deviations might be caused by a wrong assignment of reflexes, additional not segmented alveoli, more complex structures, and capillaries. The corrected alveolar area is increased by () % as an average over 16 segmented alveoli (), see Fig. 8(d). For each alveolus and each point on the outline of the alveolus, the alveolar edge radius can be calculated using the distances measured from the IVM images: By averaging over all extracted radii per alveolus, the dependence between the average edge radius and the corresponding alveolar area can be evaluated, see Fig. 8(e). Although the area seems to increase with increasing edge radius, the large spread of area values within a small range of edge radii indicates a great variety of form factors within the image. A power function was used to estimate the dependency between the one-dimensional geometry parameter and the 2-D geometry parameter by approximating the scaling factor and the exponent of the function. The mean alveolar edge radius, calculated over 16 alveoli, amounts to (). Additionally, the average equivalent alveolar diameter can be derived, which is calculated from the mean area and is approximated by a circular geometry according to This parameter yields a value of (). 4.DiscussionThe results presented in this paper underline the necessity of studying image formation in IVM of lung tissue. Derived from experimental investigations in Sec. 3.1, pitfalls in interpreting image data can be summarized as follows: first, when alveoli vanish from IVM images it does not necessarily mean that they are collapsed: We have shown that liquid filling, e.g., from edema formation would have this effect. Second, neither the bright nor the faint reflex reveal the true position of alveolar septa, hampering exact alveolar size measurements. Third, high intensity circular structures do not originate from partial reflexes at the alveolar tissue–air interface, since they lose brightness when located next to an index matched alveolus. In addition to this, partial reflexes alone cannot describe the presence of double ring structures in the IVM images. Inspired by these facts, a theoretical model was presented in Sec. 3.2 which assumes an additional light interaction process for the appearance of bright reflexes, i.e., MIR between adjacent alveoli. The probability as well as the resulting intensity for this process were calculated using Fresnel equations assuming unpolarized light. The results confirm an increased intensity by at least a factor of 5 and up to 50 compared to partial reflection, perfectly explaining the presence of a second bright reflex in IVM data. In this theoretical model, scattering was neglected, since scattering events would merely result in lower contrast of the image, where strong reflexes, arising from reflections, would still be present. Concentrating only on the characterization of reflexes in the image, the use of Fresnel equations should be sufficient to describe relative intensities between those reflexes. The outer ring of the double ring structures in IVM is now interpreted as TIR or nearly TIR reflexes between neighboring alveoli filled with air and resulting in high intensity rings, while the inner low intensity ring corresponds to partial reflection at the tissue–air boundary. The explanation of double ring structures presented here is not the first one. In a combined theoretical and experimental study describing the geometry of alveolar tissue, Kitaoka et al. recognized inner rings within bright outer rings and explained them as alveolar mouths connecting the alveoli to the alveolar duct.23 Although reflexes at the lower border of the air-filled alveolus cannot be neglected, these would cause rings of smaller diameter and similar intensity compared to the partial reflex described in our study. However, there is no evidence found in the presented IVM images for this kind of process, since the outer ring is much brighter (factor of more than 2) than the inner ring. Nevertheless, inner structures found in the center of the alveoli [indicated by a white arrow in Fig. 8(c)] are recognizable and can be attributed to partial reflexes at deeper alveolar borders or alveolar mouths as well as additional partial reflexes due to infolding of the tissue at the upper alveolar cap. For the simulation, a simplified geometry is used. Still, the intensity maps show the same characteristics as the IVM images: double ring structures, the consequences of liquid filling and differences in the position relative to the pleura. Thus, the complexity of the model seems sufficient. Furthermore, the ray propagation results show the origin of the various reflexes. It confirms MIR as the origin of the bright outer structures and partial reflection forming the weaker inner contour. It also shows some other ray paths with high intensities, and thus backs a proposition for calculating the true positions of the alveolar wall (see next paragraph). Simulation and combined OCT and IVM explain another phenomenon in IVM imaging of alveoli: alveoli, more specifically their upper surface, which move only slightly away from the pleura during respiration, may disappear from the IVM image. The reason is that the neighboring alveoli stay close to the pleura and do not provide the right surface angle for high intensity reflections at both surfaces. Thus, the deeper alveolus loses contrast in the image, which could be misinterpreted as collapse in IVM imaging. Knowing the pathways of the intensity forming rays, geometrical optics was applied to estimate the true position of the alveolar wall. For this, the positions of the MIR and the partial reflexes were used assuming that both do not change with the height of the adjacent alveoli. In fact, while the partial reflex does not change its position at distinct axial displacements of the alveolus, the MIR reflex moves along the radial direction by a distance of approximately for the analyzed geometry, which is well below the resolution limit of our system. The shift of the MIR reflex with axial movement might be needed to be considered in studies where the bright reflex is used for area measurements. However, by analyzing the reflex positions for different heights of the alveoli, we find that the onset of the multiple internal reflex, measured from the center of the alveolus, is always at the same position. This is due to the fact that the additional pathway of a traversing ray through the edge of an alveolus [see Fig. 7(b) dotted line behind the strong solid line] does not depend on the height of the adjacent alveolus. Considering the first rising edge of the brightest reflex with respect to the center of the ring as the position of the MIR reflex, the presented correction of IVM data is still applicable. The corrected image presented in Fig. 8(c) confirms this conclusion. It shows reasonable results since the alveoli touch each other as expected for normal lung tissue. The septal wall thickness can be neglected, because it is less than the resolution of the given system. With this correction, alveolar area sizes were extracted yielding an increase of size by a factor of approximately 1.6 compared to the size of the area outlined by the bright ring. The correction factor varies strongly between 1.44 and 1.85 (extreme values), which is similar to the variation of the edge radii calculated from the distances in every alveolus. In fact, these edge radii vary along one alveolus by approximately 30% (averaged over 16 alveoli). Therefore, the increase of corrected areas mainly depends on the geometry of the alveoli, which is not identical for those alveoli analyzed within the tissue and furthermore is highly dependent on the segmentation accuracy for the faint inner ring of the alveoli. Nevertheless, averaging over all alveoli yields a mean alveolar edge radius of (), which is very close to the estimated value for the model geometry (). Power law dependence between the area and the edge radius cannot be confirmed with certainty, since the spread of area values around a least-square fit of a power function is very high. However, the exponent of 1.3, given by the best fit to the data, indicates a dependency between linearity (exponent of 1) and a quadratic behavior (exponent of 2), where the latter would be applicable if the alveoli had a similarity to a sphere. Hence, an exponent unequal to 2 can be explained by a deviation from spherical geometry, as reported by several studies,21,23,24 but also by variable surface tension between single alveoli causing anisotropic infolding of the alveolar surface. To verify this hypothesis with certainty, additional preliminary studies could be applied using high resolution imaging techniques, such as ,21 on fixed tissue samples in comparison to IVM. These should sufficiently prove the dependence between the alveolar shape and its area as seen by IVM. Finally, the equivalent diameter calculated from corrected areas according to Eq. (5) amounts to (), which corresponds well with the range for the literature data based on measurements ( as ).21 Several studies exist which use relative values of alveolar area change to quantify lung tissue dynamics via IVM.4,13 Here, it is still important to notice that the position of the brightest reflex changes with the axial position of the neighboring alveolus, as we have discussed above. During respiration, the measured size of the alveolus might change just due to relative axial movement within the tissue unless the inner onset of the bright reflex is used. Therefore, the awareness of the underlying processes of image formation in IVM is crucial for accurate interpretation of the imaging and quantification results. Additional parameters, such as the edge curvature of the alveoli at the pleural surface, can be further extracted and characterized in relation to different pathological conditions of the tissue. By using varying angles of incidence, one may also think of a geometrical 3-D reconstruction of the upper cap of the alveoli from subsequent 2-D IVM images. 5.ConclusionIn this research, the image formation in dark field IVM of alveolar tissue was demonstrated and discussed qualitatively and quantitatively. The origin of bright circular reflexes, which are characteristics for alveolar IVM images, could be explained by TIR or nearly TIRs between adjacent alveoli. To underline this hypothesis, the appearance of alveolar structures was analyzed by animal experiments using an in situ mouse model. Furthermore, theoretical considerations were used to confirm the high probability of multiple internal reflection events in the tissue, which could be proven true by calculating ray traveling paths using ray tracing software. For the interpretation of IVM images, the following main conclusions can be drawn: first, the vanishing of alveoli, suggesting alveolar collapse, might be caused by the occurrence of edema at the studied position or a small relatively vertical downward movement. Using OCT as additional imaging technique could provide clarity here. Second, quantification of the absolute alveolar area results in an underestimation by a factor of roughly , since the circular reflexes do not represent the septa but are shifted into the center of the alveoli, where the amount of radial shift mainly depends on the edge radius of the alveoli. By using simple geometrical considerations, a correction can be applied to the data using the refractive index of the tissue and the angle of incidence for the illumination of the lung tissue surface. Additionally, the edge radius of the alveoli, an important indicator for the surface tension within the tissue, is now obtainable from IVM data and can be used for further characterization of the tissue. Keeping this in mind, absolute values obtained from IVM images not corrected for imaging artifacts should be handled with great care. The parameters have to be subjected to correction analysis, as proposed in this paper, to obtain true alveolar sizes from dark field IVM data. These findings will help to gain more accurate estimates of alveolar areas as well as critical interpretations of pathological tissue morphologies for resolving the current issues in lung research, thus facilitating appropriate treatment of patients suffering from lung diseases. AcknowledgmentsThe authors thank LambdaResearch for providing a trial version of the ray tracing software TracePro® as well as their comprehensive technical support. They also want to thank Klaus Affeld, Mirko Mehner, and Stefan Geissler for technical advice and fruitful discussions, Wolfgang M. Kuebler and Hannah Nickles for introduction into the animal preparation and Dana Mueller-Niegsch for carefully proof reading the manuscript. This research was supported by the German research foundation (DFG) in the frame of a joint research project “Protective Artificial Respiration” (PAR), Project Nos. AF 3/33-2, KO 1814/6-1, and KO 1814/6-2 and the European Social Fund as well as Micro-Epsilon Optronic GmbH, Germany. ReferencesM. Mertens et al.,
“Alveolar dynamics in acute lung injury: heterogeneous distension rather than cyclic opening and collapse *,”
Crit. Care Med., 37 2604
–2611
(2009). http://dx.doi.org/10.1097/CCM.0b013e3181a5544d CCMDC7 0090-3493 Google Scholar
B. D. Daly et al.,
“Dynamic alveolar mechanics as studied by videomicroscopy,”
Respir. Physiol., 24 217
–232
(1975). http://dx.doi.org/10.1016/0034-5687(75)90115-2 RSPYAK 0034-5687 Google Scholar
D. Schwenninger et al.,
“Automated analysis of intratidal dynamics of alveolar geometry from microscopic endoscopy,”
IEEE Trans. Biomed. Eng., 57 415
–421
(2010). http://dx.doi.org/10.1109/TBME.2009.2031630 IEBEAX 0018-9294 Google Scholar
H. Runck et al.,
“Endomicroscopic analysis of time- and pressure-dependent area of subpleural alveoli in mechanically ventilated rats,”
Respir. Physiol. Neurobiol., 203 1
–8
(2014). http://dx.doi.org/10.1016/j.resp.2014.08.010 RPNEAV 1569-9048 Google Scholar
D. Carney, J. DiRocco and G. Nieman,
“Dynamic alveolar mechanics and ventilator-induced lung injury,”
Crit. Care Med., 33 S122
–S128
(2005). http://dx.doi.org/10.1097/01.CCM.0000155928.95341.BC CCMDC7 0090-3493 Google Scholar
D. E. Carney et al.,
“The mechanism of lung volume change during mechanical ventilation,”
Am. J. Respir. Crit. Care Med., 160 1697
–1702
(1999). http://dx.doi.org/10.1164/ajrccm.160.5.9812031 AJCMED 1073-449X Google Scholar
C. Salito et al.,
“Alveolar mechanics studied by in vivo microscopy imaging through intact pleural space,”
Respir. Physiol. Neurobiol., 202 44
–49
(2014). http://dx.doi.org/10.1016/j.resp.2014.07.012 RPNEAV 1569-9048 Google Scholar
W. A. Wall et al.,
“Towards a comprehensive computational model for the respiratory system,”
Int. J. Numer. Methods Biomed. Eng., 26 807
–827
(2010). http://dx.doi.org/10.1002/cnm.1378 2040-7939 Google Scholar
M. Ismail, A. Comerford and W. A. Wall,
“Coupled and reduced dimensional modeling of respiratory mechanics during spontaneous breathing,”
Int. J. Numer. Methods Biomed. Eng., 29 1285
–1305
(2013). http://dx.doi.org/10.1002/cnm.2577 2040-7939 Google Scholar
W. M. Kuebler et al.,
“Leukocyte kinetics in pulmonary microcirculation: intravital fluorescence microscopic study,”
J. Appl. Physiol., 76 65
–71
(1994). JAPHEV 8750-7587 Google Scholar
H. Mitsuoka et al.,
“Intravital laser confocal microscopy of pulmonary edema resulting from intestinal ischemia-reperfusion injury in the rat,”
Crit. Med., 27
(1999). http://dx.doi.org/10.1097/00003246-199909000-00026 CCMDC7 0090-3493 Google Scholar
S. Meissner et al.,
“Virtual four-dimensional imaging of lung parenchyma by optical coherence tomography in mice,”
J. Biomed. Opt., 15 036016
(2010). http://dx.doi.org/10.1117/1.3425654 JBOPFO 1083-3668 Google Scholar
S. Meissner et al.,
“Simultaneous three-dimensional optical coherence tomography and intravital microscopy for imaging subpleural pulmonary alveoli in isolated rabbit lungs,”
J. Biomed. Opt., 14 054020
(2009). http://dx.doi.org/10.1117/1.3247149 JBOPFO 1083-3668 Google Scholar
L. Kirsten et al.,
“Four-dimensional imaging of murine subpleural alveoli using high-speed optical coherence tomography,”
J. Biophoton., 6 148
–152
(2013). http://dx.doi.org/10.1002/jbio.v6.2 JBOIBX 1864-063X Google Scholar
E. Namati et al.,
“Four-dimensional visualization of subpleural alveolar dynamics in vivo during uninterrupted mechanical ventilation of living swine,”
Biomed. Opt. Express, 4 2492
–2506
(2013). http://dx.doi.org/10.1364/BOE.4.002492 BOEICL 2156-7085 Google Scholar
H. T. Nickles et al.,
“Mechanical ventilation causes airway distension with proinflammatory sequelae in mice,”
Am. J. Physiol. Lung Cell. Mol. Physiol., 307 L27
–L37
(2014). http://dx.doi.org/10.1152/ajplung.00288.2013 APLPE7 1040-0605 Google Scholar
C. Schnabel et al.,
“Total liquid ventilation: a new approach to improve 3D OCT image quality of alveolar structures in lung tissue,”
Opt. Express, 21 31782
–31788
(2013). http://dx.doi.org/10.1364/OE.21.031782 OPEXFF 1094-4087 Google Scholar
M. Gaertner et al.,
“Intra-vital microscopy of lung tissue: a simulation based analysis of the image formation,”
Proc. SPIE, 8798 87980G
(2013). http://dx.doi.org/10.1117/12.2032814 PSISDG 0277-786X Google Scholar
A. Tabuchi et al.,
“Intravital microscopy of the murine pulmonary microcirculation,”
J. Appl. Physiol., 104 338
–346
(2008). http://dx.doi.org/10.1152/japplphysiol.00348.2007 JAPYAA 0021-8987 Google Scholar
A. Tabuchi, A. R. Pries and W. M. Kuebler,
“A new model for intravital microscopy of the murine pulmonary microcirculation,”
FASEB J., 20 A285
–A286
(2006). Google Scholar
H. Parameswaran et al.,
“Three-dimensional measurement of alveolar airspace volumes in normal and emphysematous lungs using micro-CT,”
J. Appl. Physiol., 107 583
–592
(2009). http://dx.doi.org/10.1152/japplphysiol.91227.2008 JAPYAA 0021-8987 Google Scholar
F. P. Bolin et al.,
“Refractive index of some mammalian tissues using a fiber optic cladding method,”
Appl. Opt., 28 2297
–2303
(1989). http://dx.doi.org/10.1364/AO.28.002297 APOPAI 0003-6935 Google Scholar
H. Kitaoka et al.,
“A four-dimensional model of the alveolar structure,”
J. Physiol. Sci., 57 175
–185
(2007). http://dx.doi.org/10.2170/physiolsci.RP000807 1880-6546 Google Scholar
C. I. Unglert et al.,
“Validation of two-dimensional and three-dimensional measurements of subpleural alveolar size parameters by optical coherence tomography,”
J. Biomed. Opt., 17 126015-1-11
(2012). http://dx.doi.org/10.1117/1.JBO.17.12.126015 JBOPFO 1083-3668 Google Scholar
BiographyMaria Gaertner started her research career in the Biophysics Department at the Technische Universität Dresden by graduating in physics. She joined the Clinical Sensoring and Monitoring group at the Faculty of Medicine Carl Gustav Carus in the year 2008, receiving her PhD (Dr. rer. nat.) in 2013. Her current research interests include optical coherence tomography, fluorescence microscopy, spectroscopy, and optical tissue modeling for studies of lung tissue dynamics, as well as retinal degeneration processes. Kerstin Schirrmann studied mechanical engineering at the Technische Universität Berlin and joined the Biofluid Mechanics Laboratory at the Charité - Universitätsmedizin Berlin in 2005. In her research, she was modeling blood flow in capillary networks and alveolar dynamics. After receiving her PhD (Dr.-Ing.) in 2012, she worked in Moscow and Edinburgh in the field of microfluidics for multiorgan systems. Christian Schnabel finished his studies of physical engineering at the University of Applied Sciences Mittweida in 2010 and subsequently joined the Department of Clinical Sensoring and Monitoring at the Faculty of Medicine Carl Gustav Carus in Dresden. He is undertaking his PhD in the field of lung imaging, mechanical ventilation, and total liquid ventilation. Sven Meissner studied physical technologies at the University of Applied Sciences Mittweida, Saxony, Germany, and graduated at the Technische Universität Dresden in the research group of professor Koch in 2005. In his PhD thesis, which he successfully defended in 2009, he used optical coherence tomography (OCT) to investigate the alveolar dynamics during artifical ventilation in vivo. To date, he is the leading head of EVONTA-Technology GmbH, a company bringing OCT to the industry. Ulrich Kertzscher studied mechanical engineering at the Technical University Berlin, where he received his diploma in 1989. From 1989 until 1994, he worked as a scientific researcher at the Technical University Karlsruhe and received his PhD in 1994. Since 1997, he has been working at the Biofluid Mechanics Laboratory at the Charité - Universitätsmedizin Berlin. Lars Kirsten obtained his diploma degree in physics from the Technische Universität Dresden, Germany, in 2010. Since 2011, he is undertaking his PhD at the Department of Clinical Sensoring and Monitoring at the Faculty of Medicine Carl Gustav Carus. His research focuses on high-speed optical coherence tomography imaging and its biomedical applications. Edmund Koch received his PhD (Dr. rer. nat.) in 1984 at the Philipps-Universität Marburg. After a research period at the IBM Research Center in Yorktown Heights, USA, he joined the optical research group at Drägerwerk AG in 1986. In 1994, he became professor for optics and lasers at the University of Applied Sciences in Lübeck. In 2003, he founded the Clinical Sensoring and Monitoring research group at the Faculty of Medicine of the TU Dresden. |


