|
|
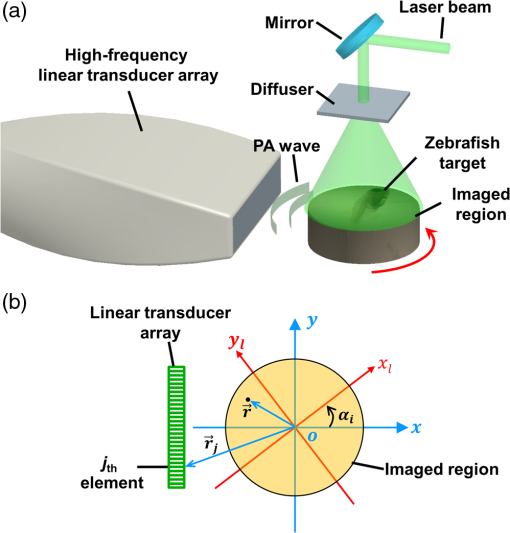
1.IntroductionPhotoacoustic computed tomography (PACT) is an incarnation of photoacoustic tomography that provides optical contrast information in deep biological tissues.1 Unlike focused-scanning photoacoustic microscopy (PAM) which forms images by combining A-lines, PACT forms images through reconstruction algorithms. To accelerate imaging speed, PACT is usually implemented with an ultrasonic transducer array employing 64–512 elements to detect photoacoustic (PA) signals in parallel. Currently, both curved and linear transducer arrays are widely used in PACT. Although curved transducer arrays, such as full-ring transducer arrays2–4 and partial-ring transducer arrays,5,6 have greater detection view coverage,7 they are custom designed, costly, and offer few frequency choices. In contrast, linear transducer arrays have the advantages of low cost, wide bandwidth selection, hand-held operation, and ultrasonic imaging integration. Although linear-array PACT suffers from the limited-view problem, rotating either the transducer array or the imaging objects circularly enables full-view linear-array PACT at the expense of a longer imaging time.8–12 Challenges still remain in full-view linear-array PACT. First, no full-view linear-array PACT has been reported with a central ultrasonic frequency higher than 24 MHz, which limits the spatial resolution. A higher central frequency would provide finer lateral resolution, and the associated wider bandwidth would result in higher axial resolution, allowing imaging of finer structures in biological tissues at the expense of penetration. Second, due to the band-pass frequency response of the transducer elements, the reconstructed images present bipolar (i.e., both positive and negative) pixel values unless the raw channel data are deconvolved with the system’s electrical impulse response (EIR) and non-negativity is enforced. Because PACT should ideally image the initial pressure or optical energy deposition, which is always non-negative, bipolar pixel values are artificial. It is also counterintuitive for physicians and biologists to interpret the images because both positive and negative peaks represent strong optical absorption. Moreover, bipolar pixel values are not conducive to quantification of physiological parameters, such as oxygen saturation () and blood flow speed. Thus far, three solutions have been proposed. The first solution is to simply threshold negative signals to zero.10–12 However, thresholding removes structures from the image and introduces image artifacts. The second solution is to deconvolve the raw channel data with the EIR. However, this method requires a high signal-to-noise ratio and accurate measurement of each element’s EIR. The third solution is to iteratively reconstruct an image with the non-negativity constraint.13,14 However, this method requires both accurate modeling of the whole imaging system and time-consuming computation. Thus, there is an urgent need for a simple and effective method to make bipolar pixel values unipolar. Hilbert transformation along the acoustic axis recovers the envelope without knowledge of the EIR. Therefore, single-view Hilbert transformation has been widely applied in computing the A-lines of a PAM image and beamformed A-lines of a single-view linear-array PACT image, along the acoustic axis. However, single-view Hilbert transformation cannot be directly applied to full-view linear-array PACT because the full-view linear-array PACT has different acoustic axis directions. Hilbert transformation along a single direction will cause artifacts due to the mismatch between the Hilbert transformation direction and acoustic axis. Therefore, we propose a multiview Hilbert transformation method that solves this problem by coherently reconstructing bipolar images in each view, then applying Hilbert transformation along each view’s acoustic axis and taking the absolute value to recover the envelope, and finally adding unipolar single-view envelope images together to form a full-view unipolar image. This algorithm has never been previously reported. 2.Materials and MethodsHere, we present a high-frequency full-view linear-array PACT imaging system, as shown in Fig. 1(a). The illumination source was a 532-nm wavelength laser beam from a second-harmonic generator, which was pumped by a Nd:YAG 1064-nm wavelength laser (Brilliant B, Quantel Inc.) at a repetition rate of 20 Hz. The laser beam was expanded by a circle–pattern engineered diffuser (EDC-5-A-2 s, RPC Photonics Inc.) to a diameter of 20 mm on the object’s surface. With a total energy of 35 mJ per laser pulse, the optical fluence on the object’s surface was estimated to be , well below the American National Standards Institute safety limit (). The excited PA waves were received by a linear transducer array (MS550D, Visualsonics Inc.) with 256 elements and an element-to-element pitch of . Each element had a central frequency of 40 MHz and a bandwidth of 33 MHz. The MS550D transducer was connected to an ultrasound/photoacoustic (US/PA) dual modality imaging platform (Vevo LAZR, Visualsonics Inc.), where co-registered US/PA images were acquired and displayed. During experiments, the object to be imaged, either a zebrafish, leaf skeleton, or black microsphere, was fixed on a manual rotation stage (, Thorlabs Inc.) and immersed in water. To get a two-dimensional (2D) full-view linear-array PACT image, samples were rotated, and images were acquired at multiple angles. After imaging, raw data acquired at all view angles were exported from the Vevo LAZR imaging platform to a computer. Fig. 1(a) Setup of the high-frequency full-view linear-array PACT system. (b) Schematic of the scan process. PA: photoacoustic. The local coordinates are aligned with the global coordinates when the object is imaged at the first view angle (i.e., ).  A schematic diagram of the reconstruction process is shown in Fig. 1(b), where two coordinate systems are used: the global coordinates attached to the fixed linear transducer array, and the local coordinates attached to the sample to be rotated. Both coordinates share the same origin, but the local coordinates rotate with the sample, while the global coordinates are fixed. At rotation step , the single-view PACT image is reconstructed under the global coordinates using the universal filtered backprojection (FBP) algorithm:15 where is the acoustic pressure measured by the transducer element located at and time . is the reconstructed initial PA pressure for the point at . As previously mentioned, due to the limited view and finite bandwidth of the transducer, the reconstructed is bipolar. is the speed of sound and is assumed to be uniform. is the solid angle subtended by the detection aperture of the transducer array with respect to the point , and represents the weighting factor of the contribution of the transducer element located at . Although the FBP is not a mathematically exact algorithm for the 2-D reconstruction, it can generate boundary-enhanced images that accurately reveal the internal structures of the object. In the future, a more accurate 2-D reconstruction algorithm may be applied.With the assumption that the light illumination is rotationally symmetric, a full-view bipolar PACT image can be formed in the local coordinates by rotating the reconstructed images acquired at all angles from the global coordinates to the local coordinates, then averaging: Here, is the image point in the local coordinates, is the reconstructed full-view bipolar PACT image, is the total number of rotation steps (views), is the rotation operator that transforms an image in the global coordinates to an image in the local coordinates , and is the rotation angle for the ’th step. To reconstruct the full-view unipolar image, we propose a four-step reconstruction procedure:
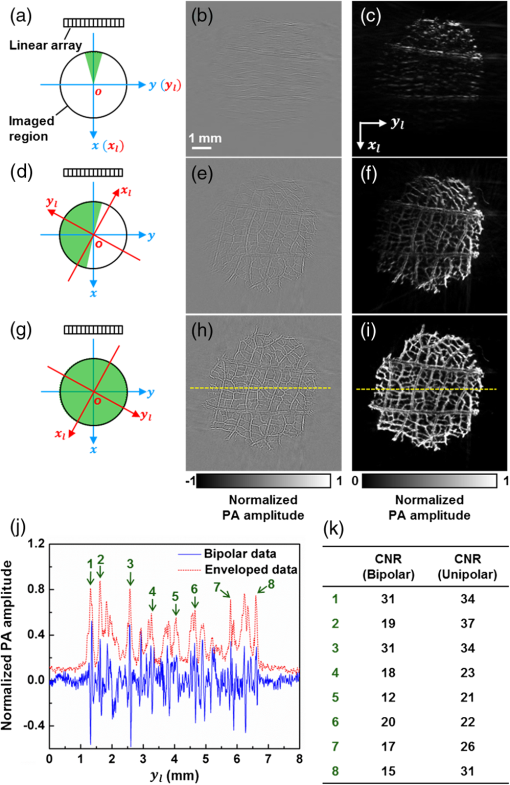
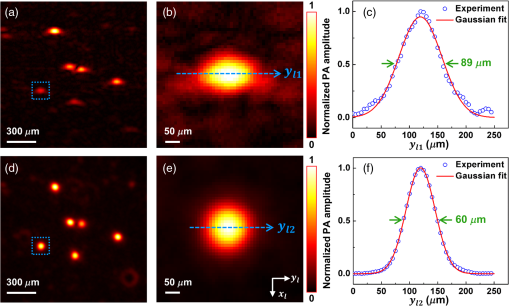
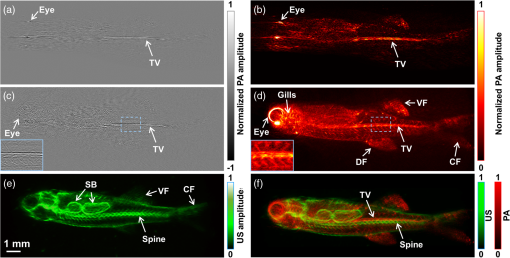
Mathematically, this process can be formulated as where is the final unipolar image, is the absolute value operator and is the Hilbert transformation operator. Note that Eq. (3) represents a nonlinear process because of the amplitude extraction, while the conventional FBP algorithm is linear.3.ResultsWe imaged a dehydrated leaf skeleton to demonstrate the full-view linear-array PACT. The leaf skeleton was sealed in a 3% agar gel. Figure 2(a) shows the setup of the single-view linear-array PACT, and Figs. 2(b) and 2(c) show a single-view bipolar image and a unipolar image, respectively. Due to the limited view of single-view linear-array PACT, only features with surface normals aligned to the acoustic axis can be reconstructed.7 Figure 2(d) shows the setup for acquiring six views with an angular step size of 30 deg, and Figs. 2(e) and 2(f) show the corresponding bipolar image and unipolar image of the leaf skeleton, respectively. Compared with the single-view images, multiview images clearly recovered more features. Figure 2(g) shows the full-view PACT setup with 12 views and an angular step size of 30 deg. Figures 2(h) and 2(i) show a full-view bipolar image and unipolar image of the leaf skeleton, respectively. Compared with the six-view images, full-view images revealed even more features. An animation (Video 1) shows the scan setups and corresponding bipolar images and unipolar images of the leaf skeleton at different views. From the movie, we can see that more features of the leaf are gradually revealed as the number of views increases. Fig. 2(a) Single-view linear-array photoacoustic computed tomography (PACT) setup with acquired, (b) bipolar image and (c) unipolar image. (d) Six-view linear-array PACT setup with acquired, (e) bipolar image, (f) unipolar image. The green area indicates the photoacoustic detection angle coverage. (g) Full-view linear-array PACT setup with acquired, (h) bipolar image, (i) unipolar image. Video 1 (MOV, 0.3 MB)[DOI: http://dx.doi.org/10.1117/1.JBO.20.6.066010.1] shows the scan setups and corresponding bipolar images and unipolar images of the leaf skeleton at different views. (j) Comparison of the full-view bipolar and unipolar image profiles along the dashed lines in (f) and (i). (k) Contrast-to-noise ratio (CNR) comparison of selected features in bipolar and unipolar profiles as marked in (j).  Comparing the full-view bipolar [Fig. 2(h)] and unipolar [Fig. 2(i)] images of the leaf skeleton, we can see that the two images have identical features. This identity confirms that the multiview Hilbert transformation followed by amplitude extraction keeps all the features of the original bipolar image. Figure 2(j) compares the profiles of Figs. 2(h) and 2(i) along the dashed lines. The contrast-to-noise ratios (CNRs) of selected features, marked with numbers 1–8 in Fig. 2(j), are presented in Fig. 2(k). Clearly, the full-view unipolar image has a better CNR than the bipolar image, mainly because, after the multiview Hilbert transformation, the noise level has been lowered more than the signals. The in-plane spatial resolutions of the multiview PACT imaging system were also quantified by imaging black-dyed microspheres (Polysciences Inc.) mixed in an agar gel. Figure 3(a) shows a single-view unipolar PACT image of the microsphere phantom, and Fig. 3(b) shows an enlarged image of a single microsphere, as enclosed by a dashed box in Fig. 3(a). Figure 3(c) shows the PA amplitude distribution along the dashed arrow in Fig. 3(b), and the Gaussian fitting result shows that the full width at half maximum (FWHM) is , which is the lateral resolution of the single-view PACT system. With the same method, the axial resolution of the single-view PACT along the direction was quantified to be . Figure 3(d) shows a full-view unipolar PACT image of the microspheres with 18 views and a 20-deg angular step size. Figure 3(e) is an enlarged image of the same microsphere shown in Fig. 3(b). It is obvious that the full-view microsphere image is isotropic in the imaging plane. Figure 3(f) shows the PA amplitude distribution along the dashed arrow in Fig. 3(e), and the Gaussian fitting result shows that the FWHM value is , less than the single-view FWHM of along the direction in Fig. 3(b). The isotropic resolution of the full-view unipolar PACT is slightly worse than the axial resolution of the single-view PACT due to the blurring effect of the incoherent sum in the unipolar image reconstruction process. Fig. 3Characterization of the full-view linear-array PACT system. (a) Single-view unipolar image of microspheres, (b) enlarged image of the single microsphere in the dashed box of (a), (c) photoacoustic amplitude distribution along the dashed line in (b), (d) full-view unipolar image of microspheres, (e) enlarged image of a single microsphere in the dashed box of (d), (f) photoacoustic amplitude distribution along the dashed line in (e).  With isotropic high resolution in the imaging plane, full-view linear-array PACT can resolve fine structures in biological tissues. The zebrafish is a major model organism for biomedical research, but low-frequency PACT cannot resolve its tiny features. Here, we use the high-frequency full-view PACT system to perform in vivo imaging of a zebrafish embedded in a low gelling temperature agarose (A9414, Sigma). All animal work was performed in compliance with Washington University’s institutional animal protocols. During the scan process, the zebrafish was alive and its heart was beating. Figure 4(a) shows a single-view bipolar PACT image of the zebrafish. Only the trunk vessel (TV) and part of the eye can be identified. Figure 4(b) is the corresponding unipolar image of Fig. 4(a) obtained by Hilbert transformation and amplitude extraction along the acoustic axis. It shows a clearer boundary of the zebrafish but still suffers from the limited-view problem. Figure 4(c) is a full-view bipolar PACT image of the zebrafish with 18 views and a 20-deg angular step size. The eye now appears round, and we can begin to discern the ventral fin and dorsal fin in addition to the TV. Figure 4(d) is a corresponding full-view unipolar PACT image, showing clearer features, such as boundaries, tails, and tiny bones close to the TV. Although Fig. 4(d) looks better than Fig. 4(c), they actually show the same details, as proved by comparing the features of the enlarged sections from the same area. Figure 4(e) shows a full-view unipolar ultrasound image of the zebrafish achieved by adding the beamformed enveloped ultrasound image at each rotation angle. Since the ultrasound image resolves mechanical contrasts, we can clearly see the swim bladders and spine. Figure 4(f) is a fused image of Figs. 4(d) and 4(e), and it shows both image contrasts (mechanical and optical contrasts). We can clearly identify the TV and spine in Fig. 4(f). Fig. 4In vivo images of a zebrafish. (a) Bipolar single-view PACT image, (b) unipolar single-view PACT image, (c) bipolar full-view PACT image with an enlarged image at the lower left corner representing the dashed area, (d) unipolar full-view PACT image with an enlarged image at the lower left corner representing the dashed area, (e) unipolar full-view ultrasound image, (f) co-registered US/PA image of the zebrafish obtained by merging (d) and (e). Note that the spine and the trunk vessel (TV) can be clearly differentiated in (f). CF, caudal fin; DF, dorsal fin; SB, swim bladders; US, ultrasound; VF, ventral fin.  4.ConclusionsIn summary, we present a high-frequency full-view linear-array PACT imaging system paired with a multiview Hilbert transformation method. The system has an isotropic spatial resolution of within the imaging plane. Such a high resolution allows us to clearly identify different vessels and organs in a live zebrafish. Compared with the conventional FBP method, the multiview reconstruction and Hilbert transformation method render much clearer envelope images of the zebrafish. If the unipolar image recovered by applying the single-view Hilbert transformation along the acoustic axis and taking the absolute value correctly represents optical absorption, the multiview Hilbert transformation images, which are achieved by linearly adding unipolar images from different views, should also correctly represent the optical absorption. The maximum imaging depth of the single-view linear-array PACT system was in this study. By rotating the sample 360 deg, we are able to image samples with diameters up to . Currently, the imaging speed is limited by the low repetition rate of the laser and the slow manual rotation scan. Therefore, the imaging speed of full-view linear-array PACT is lower than that of circular-array PACT. However, linear-array PACT provides a low cost solution with more frequency choices. Moreover, its imaging speed can be further improved by using a faster laser system and a motorized rotation scan setup. By applying side illumination plus elevational scanning, we will be able to acquire three-dimensional (3-D) whole-body images of small animals. Compared with whole-body PA macroscopy,16 the full-view linear-array PACT has higher in-plane image quality due to the full-view detection, but the 3-D whole-body image quality is worse because of the relatively poor elevational resolution of the linear transducer array. AcknowledgmentsThe authors appreciate professor James Ballard’s close reading of the manuscript and Stephen Cantor’s assistance with zebrafish husbandry and preparation. This work was sponsored in part by National Institutes of Health (NIH) grants DP1 EB016986 (NIH Director’s Pioneer Award), R01 CA186567 (NIH Director’s Transformative Research Award), S10 RR026922, and R01 EB016963. L. V. Wang has a financial interest in Microphotoacoustics, Inc., and Endra, Inc., which, however, did not support this work. ReferencesL. V. Wang and S. Hu,
“Photoacoustic tomography: in vivo imaging from organelles to organs,”
Science, 335
(6075), 1458
–1462
(2012). http://dx.doi.org/10.1126/science.1216210. SCIEAS 0036-8075 Google Scholar
J. Xia et al.,
“Three-dimensional photoacoustic tomography based on the focal-line concept,”
J. Biomed. Opt., 16
(9), 090505
(2011). http://dx.doi.org/10.1117/1.3625576. JBOPFO 1083-3668 Google Scholar
J. Xia et al.,
“Whole-body ring-shaped confocal photoacoustic computed tomography of small animals in vivo,”
J. Biomed. Opt., 17
(5), 050506
(2012). http://dx.doi.org/10.1117/1.JBO.17.5.050506. JBOPFO 1083-3668 Google Scholar
M. Nasiriavanaki et al.,
“High-resolution photoacoustic tomography of resting-state functional connectivity in the mouse brain,”
Proc. Natl. Acad. Sci. U. S. A., 111
(1), 21
–26
(2013). http://dx.doi.org/10.1073/pnas.1311868111. Google Scholar
H.-P. Brecht et al.,
“Whole-body three-dimensional optoacoustic tomography system for small animals,”
J. Biomed. Opt., 14
(6), 064007
(2009). http://dx.doi.org/10.1117/1.3259361. JBOPFO 1083-3668 Google Scholar
A. Dima, N. C. Burton and V. Ntziachristos,
“Multispectral optoacoustic tomography at 64, 128, and 256 channels,”
J. Biomed. Opt., 19
(3), 036021
(2014). http://dx.doi.org/10.1117/1.JBO.19.3.036021. JBOPFO 1083-3668 Google Scholar
Y. Xu et al.,
“Reconstructions in limited-view thermoacoustic tomography,”
Med. Phys., 31
(4), 724
–733
(2004). http://dx.doi.org/10.1118/1.1644531. MPHYA6 0094-2405 Google Scholar
R. A. Kruger et al.,
“Thermoacoustic computed tomography using a conventional linear transducer array,”
Med. Phys, 30
(5), 856
–860
(2003). http://dx.doi.org/10.1118/1.1565340. MPHYA6 0094-2405 Google Scholar
D. W. Yang et al.,
“Fast full-view photoacoustic imaging by combined scanning with a linear transducer array,”
Opt. Express, 15
(23), 15566
–15575
(2007). http://dx.doi.org/10.1364/OE.15.015566. OPEXFF 1094-4087 Google Scholar
J. Gateau et al.,
“Three-dimensional optoacoustic tomography using a conventional ultrasound linear detector array: whole-body tomographic system for small animals,”
Med. Phys., 40
(1), 013302
–013311
(2013). http://dx.doi.org/10.1118/1.4770292. MPHYA6 0094-2405 Google Scholar
J. Gateau, A. Chekkoury and V. Ntziachristos,
“High-resolution optoacoustic mesoscopy with a 24 MHz multidetector translate-rotate scanner,”
J. Biomed. Opt., 18
(10), 106005
(2013). http://dx.doi.org/10.1117/1.JBO.18.10.106005. JBOPFO 1083-3668 Google Scholar
J. Gateau, A. Chekkoury and V. Ntziachristos,
“Ultra-wideband three-dimensional optoacoustic tomography,”
Opt. Lett., 38
(22), 4671
–4674
(2013). http://dx.doi.org/10.1364/OL.38.004671. OPLEDP 0146-9592 Google Scholar
H. Chao et al.,
“Full-wave iterative image reconstruction in photoacoustic tomography with acoustically inhomogeneous media,”
IEEE Trans. Med. Imaging, 32
(6), 1097
–1110
(2013). http://dx.doi.org/10.1109/TMI.2013.2254496. ITMID4 0278-0062 Google Scholar
Z. Jin et al.,
“Effects of different imaging models on least-squares image reconstruction accuracy in photoacoustic tomography,”
IEEE Trans. Med. Imaging, 28
(11), 1781
–1790
(2009). http://dx.doi.org/10.1109/TMI.2009.2024082. ITMID4 0278-0062 Google Scholar
M. Xu and L. V. Wang,
“Universal back-projection algorithm for photoacoustic computed tomography,”
Phys. Rev. E, 71
(1), 016706
(2005). http://dx.doi.org/10.1103/PhysRevE.71.016706. PLEEE8 1539-3755 Google Scholar
M. Jeon, J. Kim and C. Kim,
“Multiplane spectroscopic whole-body photoacoustic imaging of small animals in vivo,”
Med. Biol. Eng. Comput., 1
–12
(2014). Google Scholar
BiographyGuo Li received his BS degree in mechanical engineering at Tsinghua University and his MS degree in engineering physics at Tsinghua University. Currently, he is a graduate student at Washington University in St. Louis and a research assistant in Dr. Lihong V. Wang’s laboratory. His research focuses on high-frequency linear-array photoacoustic (PA) imaging. Lei Li received his BS and MS degrees from Harbin Institute of Technology, China, in 2010 and 2012, respectively. He is working as a graduate research assistant under the tutelage of Dr. Lihong Wang at Washington University. His current research focuses on photoacoustic microscopy (PAM) and tomography, especially improving the photoacoustic imaging speed and applying it on brain functional and structural imaging. Liren Zhu is currently a graduate student in biomedical engineering at Washington University in St. Louis under the supervision of Lihong V. Wang, Gene K. Beare distinguished professor. His research focuses on the development of novel optical imaging, photoacoustic imaging, and ultrasonic imaging techniques for biomedical research. Jun Xia received his PhD at the University of Toronto and did his postdoc training at Washington University in St. Louis, under the mentorship of Dr. Lihong V. Wang. Currently, he is an assistant professor in the Biomedical Engineering Department at the University at Buffalo. His research interests include the development of novel biomedical imaging techniques including photoacoustic imaging and ultrasonic imaging. He has published more than 30 peer-reviewed journal articles in photoacoustic and photothermal research. Lihong V. Wang received his PhD at Rice University, Houston, Texas, and currently holds the Gene K. Beare distinguished professorship of biomedical engineering at Washington University in St. Louis. His laboratory invented or discovered functional photoacoustic tomography (PAT), dark-field confocal photoacoustic microscopy (PAM), optical-resolution PAM, photoacoustic Doppler effect, photoacoustic reporter gene imaging, focused scanning microwave-induced thermoacoustic tomography, and the universal photoacoustic or thermoacoustic reconstruction algorithm. |

