|
|
1.IntroductionT cell activation is an essential event in immune responses. The process of proper T cell activation is rigorously monitored and regulated by apoptosis. Specifically, apoptosis of an activated T cell has an important role in eliminating unwanted lymphocytes and maintaining T cell homeostasis after fighting infections.1 Therefore, numerous studies have been performed to understand the mechanisms by which apoptosis is regulated during T cell activation. Activation-induced cell death (AICD) is one of the major mechanisms by which the programmed death of activated T cells is achieved. Fas, the well-known AICD receptor, has been shown to regulate immune homeostasis in mutational, transcriptional and clinical studies.2–5 Following infection, Fas is rapidly expressed on the surfaces of activated T cells. However, these T cells are resistant to apoptosis for some days after activation. It has been shown that T cells only acquire sensitivity to Fas-mediated apoptosis at a few days after antigen-specific activation.6–8 Thus, only activated mature T cells gain sensitivity to apoptosis and begin to undergo cell death. During this process, activated mature T cells rapidly exhibit classic characteristics of apoptosis such as membrane blebbing, chromatin condensation and formation of deoxyribose nucleic acid (DNA) fragments.6,9 Although the process of T cell activation is being widely studied in the immunological and biochemical fields, the change in biochemical properties at a molecular level is still unknown due to the lack of a sensitive quantitative technique. Raman spectroscopy has attracted great interest as a powerful analytical tool for detecting changes in the chemical structure and composition of a substance at the molecular level10–12 together with high sensitivity and selectivity. This technology has several additional advantages in that it is noninvasive, allows for rapid detection and does not require the use of labels to study biologically relevant molecules. Indeed, intracellular information about nucleic acids, proteins and other components, as well as their conformation, can be determined by Raman spectroscopy using variations in spectral shape and intensity.13–16 In this study, we investigated the identification and quantification of biochemical properties related to apoptosis of activated mature T cell and cellular DNA using Raman spectroscopy and multivariate statistical methods. Quantitative analysis on biochemical and structural changes in activated mature T cells would be helpful in the early diagnosis and treatment of immune disorders associated with T cells. 2.Materials and Methods2.1.AnimalsC57BL/6 mice (6 to 8 weeks of age, weighing 20 to 25 g) were purchased from Orient Bio Korea (Seoul, Republic of Korea). All animal use procedures were approved by the Ethical Committee of the Kyung Hee University [IRB; KHUASP(SE)-11-010] and were in strict accordance with the National Institutes of Health Guide for the Care and Use of Laboratory Animals. 2.2.CD8+ T Cell IsolationT cells were highly purified from the spleens of C57BL/6 mice using magnetic bead separation ( cell isolation kit; Miltenyi Biotec, Bergisch-Gladbach, Germany). In brief, spleens from male C57BL/6 mice were removed and disrupted over wire mesh screens. Red blood cells were lysed in 0.85% in Tris–HCl buffer. Isolated T cells were incubated with antimouse CD8a PE (eBioscience, San Diego, California) for 30 min at 4°C in the dark. T cells were washed three times, resuspended in flow cytometry staining buffer (eBioscience, San Diego, California), and the percentage of T cells stained with specific reagents was determined by FACSCalibur and FlowJo software (Tree Star Inc., Ashland, Oregon). The purity of populations was determined by flow cytometric analysis and routinely reached . 2.3.Preparation of Activated Mature CD8+ T CellsTo activate T cells, the isolated T cells were resuspended in RPMI 1640 (GIBCO, Grand Island, New York) supplemented with 10% fetal bovine serum, penicillin, and streptomycin (Hyclone, Logan, Utah) to the desired cell density ( cells/48 well) on plates coated with anti-CD3 antibody (eBioscience, San Diego, California) and soluble anti-CD28 antibody (eBioscience, San Diego California). After three days, T cells were treated with anti-CD25 antibody (eBioscience, San Diego, California), resuspended in flow cytometry staining buffer, and immediately subjected to flow cytometric analysis. To confirm the presence of activated mature T cells, some three-day old T cells were treated with anti-CD25 antibody/anti-Fas antibody (eBioscience, San Diego California) and anti-CD25 antibody/anti-Annexin-V antibody (Sigma Aldrich, St. Louis, Missouri) for 30 min. Flow cytometric data were acquired using a FACScalibur flow cytometer. 2.4.Atomic Force Microscopy MeasurementsNoncontact mode atomic force microscopy (AFM) images were obtained using a NANOS N8 NEOS (Bruker, Herzogenrath, Germany) equipped with a XYZ scanner and two Zeiss optical microscopes (Epiplan and ). External noise was eliminated by placing the AFM on an active vibration isolation table (Table Stable Ltd., Surface Imaging Systems, Herzogenrath, Germany) inside a passive vibration isolation table (Pucotech, Seoul, Republic of Korea). Resting and activated mature T cells were scanned at a resolution of pixels at a scan rate of . Cell shape parameters, including perimeter and volume, and roughness parameters, including roughness average (Sa) and root mean square (Sq), were measured from topographic images using a scanning probe imaging processor (SPIP, Image Metrology, Hørsholm, Denmark). The Sa was defined as the arithmetic mean of the deviations in height from the mean value, while Sq was the root mean square. A total of 50 different randomly selected sections of the cell membrane were analyzed. A statistical analysis was performed to compare the surface roughness between resting and activated mature T cells using a two-tailed Student’s -test. -Values less than 0.05 were regarded as statistically significant. 2.5.Isolation of Deoxyribonucleic Acids from Resting and Activated Mature CD8+ T cellsResting and activated mature T cells were harvested and washed once in phosphate-buffered saline (PBS). DNA preparation was performed using a High Pure PCR Template Preparation Kit (Indianapolis, Indiana). Briefly, of sample material was added to of binding buffer and proteinase K. The resulting mixture was incubated at 70°C for 10 min. After adding isopropanol, the sample was loaded into high filter tubes. After centrifugation, inhibitor removal buffer was added. The samples were centrifuged and washed twice with wash buffer. Prewarmed elution buffer was added in order to elute the DNA. The concentration of DNA was calculated using a Nano-100 Micro-spectrophotometer (Allsheng, Hangzhou city, China). 2.6.Raman Spectroscopic Measurements and Data AnalysisFor Raman analysis of T cells, resting and activated mature T cells were attached in gold-coated substrates using Cytospin Cytocentrifuge (Thermo Scientific, Waltham, Massachusetts). The T cells were washed twice with PBS and fixed for 20 min in 4% paraformaldehyde at 4°C, followed by two final washes with PBS. For Raman analysis of DNA, DNA () solution isolated from resting and activated mature T cells was dropped on gold-coated substrates and then dried in air. We used gold-coated substrate to minimize spectral contributions from the glass substrate. Raman spectra were acquired using the SENTERRA confocal Raman system (Bruker Optics Inc., Billerica, Massachusetts) equipped with a 785-nm diode laser source (100 mW before objective) at a resolution of . A air objective (MPLN N. A. 0.9, Olympus), which produced a laser spot size of , was used to focus the laser on samples and collect Raman signals. Raman spectra of cell and cellular DNA were calculated as the average of 15 measurements. All experiments were performed in triplicate. The Raman spectra of the cell and cellular DNA associated with the autofluorescence background were displayed on a computer in real time and saved for further analysis. An automated algorithm for autofluorescence background removal was applied to the measured data to extract pure sample Raman spectra. Baseline correction was performed by the rubber-band method, which was used to stretch between the spectrum endpoints. Baseline corrected spectra were intensity normalized to (CH deformation) and ( stretching) for cell and cellular DNA, respectively. All Raman measurements were recorded with an accumulation time of 60 s in the 600 to range, and Raman spectral acquisition and preprocessing of preliminary data such as baseline subtraction, smoothing and spectrum analysis were carried out using the OPUS software (Bruker Optics Inc., Billerica, Massachusetts). For statistical analysis, Raman spectra datasets obtained from cell and cellular DNA consist of 30 and 18 samples measured at different Raman wave numbers (600 to ) and each dataset has the same ratio of resting to active mature T cell samples. For principal component analysis (PCA), the top two principal components explaining most of the total variance were extracted and the discriminant function was plotted to provide the best separation between the two matures based on the PCA scores obtained from PCA. 3.Results3.1.Isolation CD8+ T Cells and Confirmation of Activated Mature CD8+ T CellsT cells were isolated from splenocytes by magnetic bead separation. The purity of the population was determined by flow cytometric analysis and routinely reached [Fig. 1(a)]. Activated T cells express a number of specific surface receptors including CD25 (IL-2 receptor) and CD71 (transferrin receptor). To confirm that anti-CD3/28 antibody stimuli activated isolated T cells, we measured CD25 expression on cell surfaces after three days [Fig. 1(b)]. According to a previous paper, expression of apoptotic proteins (Fas, Annexin-V) appeared to match the peak of activation protein (CD25) at activated mature T cells.5,17,18 To confirm the presence of activated mature T cells, T cells incubated for three days were simultaneously stained with an activation marker (CD25) and apoptosis markers (Fas, Annexin-V) and analyzed by flow cytometry. Approximately 25% of activated cells exhibited high expression of Fas and Annexin-V, while none of the resting cells expressed Fas or Annexin-V [Figs 2(a) and 2(b)]. Fig. 1(a) Purity of T cells populations after magnetic bead isolation. Mouse splenocytes before (left) and after (right) separation of T cells using T Cell Isolation Kit. The population purified of T cells was determined by flow cytometry analysis and routinely reached . (b) Confirmation of T cells activation after anti-CD3/CD28 antibody stimulation. The surface marker CD25 was analyzed in activated T cells by flow cytometry analysis.  Fig. 2Confirmation of activated mature T cells. After stimulation for three days, T cells were incubated with (a) anti-CD25/anti-Fas antibody and (b) anti-CD25/anti-Annexin-V antibody and analyzed by flow cytometry.  In addition, we observed the morphological changes in activated mature T cells using AFM. AFM, which is a type of high-resolution scanning probe microscopy, is a powerful tool for imaging at the nanometer level and for observing cellular ultrastructures.19–21 Figure 3 shows representative AFM images, line profiles and histograms of single resting and activated mature T cells. There were significant structural changes in activated mature T cells. Specifically, the resting T cells had an elliptical shape with a central hunch, relatively smooth surface and height of () [Figs. 3(a)–3(e)]. However, activated mature T cells exhibited increased cell size, surface roughness and irregularity [Figs. 3(f)–3(j)]. The height of activated mature T cells was not statistically different from that of resting T cells. As shown in the magnified image in Fig. 3(i) and the histogram in Fig. 3(j), the membranes of activated mature T cell were much rougher than those of resting T cells. Likewise, we observed several surface clusters that were much denser than those of resting T cells. To identify the morphological changes between resting and activated mature T cells, changes in cell volume, perimeter and surface roughness were evaluated. Figure 4(a) shows that the cell volume of activated mature T cells increased significantly from (resting T cells) to (activated mature T cells) (, ). The cell perimeter of activated T cells was also increased compared to that of cells in a resting state ( versus , , ) [Fig. 4(b)]. Additionally, the surface roughness parameters of activated mature T cells were significantly increased to for Sa (, ) and for Sq (, ) compared with those of resting T cells ( for Sa and for Sq) (Table 1). Taken together, these results indicate that the isolated cell population consisted of activated mature T cells.4,5,17,18,22 Table 1Surface roughness analysis of resting and activated mature CD8+ T cells. Data are from 50 randomly selected 1 μm×1 μm sections of the cell membrane.
Fig. 3(a)–(e) Representative atomic force microscopy (AFM) images of a single resting T cells. (a) Three-dimensional (3-D) image (), (b) AFM topographical image (), (c) line profile generated along the white dashed line on b, (d) magnified image of the yellow square in b (), (e) histogram of the cell surface of d. (f)–(j) Representative AFM images of a single activated mature T cell. (f) 3-D image (), (g) AFM topographical image (), (h) line profile generated along the white dashed line on g, (i) magnified image of the yellow square in g (), (j) histogram of the cell surface in i.  3.2.Analysis of Raman Spectra from Activated Mature CD8+ T Cells and Cellular Deoxyribose Nucleic AcidThe averaged Raman spectra of resting and activated mature T cells are presented in Figure 5(a) (blue line: resting, red line: activated mature and black line: the difference between the spectra of resting and activated mature). The chemical assignments for those Raman spectra at different wave numbers are given in Table 2. It is evident that both the resting and activated mature T cells exhibit spectra corresponding to molecular vibrations of all cellular components, including nucleic acids, proteins, lipids, and carbohydrates.13,23,24 In order to quantitatively identify the effect of activation maturation on the T cells, we selected some specific Raman spectra and compared the changes in their spectral intensities [Fig. 5(b)]. The main changes related to the protein vibration can be observed at (symmetric ring stretching phenylalanine), and (amide III –sheet of protein). The changes of Raman spectra intensity corresponded to DNA vibration at (adenine), (cytosine/thymine ring breathing of the DNA/RNA), and (phosphodioxy groups, , of the DNA backbone). Table 2Peak assignment of the Raman spectra of CD8+ T cells.
Fig. 5(a) Averaged Raman spectra of T cells: resting (blue line) and activated mature (red line). The spectrum (black line) shows the spectral differences of resting and activated mature T cells. (b) Relative intensities of Raman spectra for resting and activated mature T cells.  On examination of apoptosis-related DNA spectral signatures, we investigated the Raman spectra of the DNA directly. DNA was isolated from the resting and activated mature T cells, respectively. Figure 6(a) shows the Raman spectra obtained from resting DNA (blue line) and activated mature DNA (red line). The difference between the spectra of resting and activated mature DNA is shown in black line. Peak assignments at different wave numbers are given in Table 3.23,25,26 The spectra at 683 and were assigned to guanine and adenine, respectively. The broad band at 765 to represented cytosine, thymine and in the DNA backbone. The band at 1053 to corresponded to vibrations in stretching and phosphodioxy groups () in the DNA backbone. Lastly, bands at 890, 1142, and were assigned to deoxyribose. We investigated specific Raman spectra and compared the changes in their spectral intensities [Fig. 6(b)]. Raman intensities of activated mature DNA were decreased compared with those of resting DNA. Table 3Peak assignments for DNA Raman spectra.
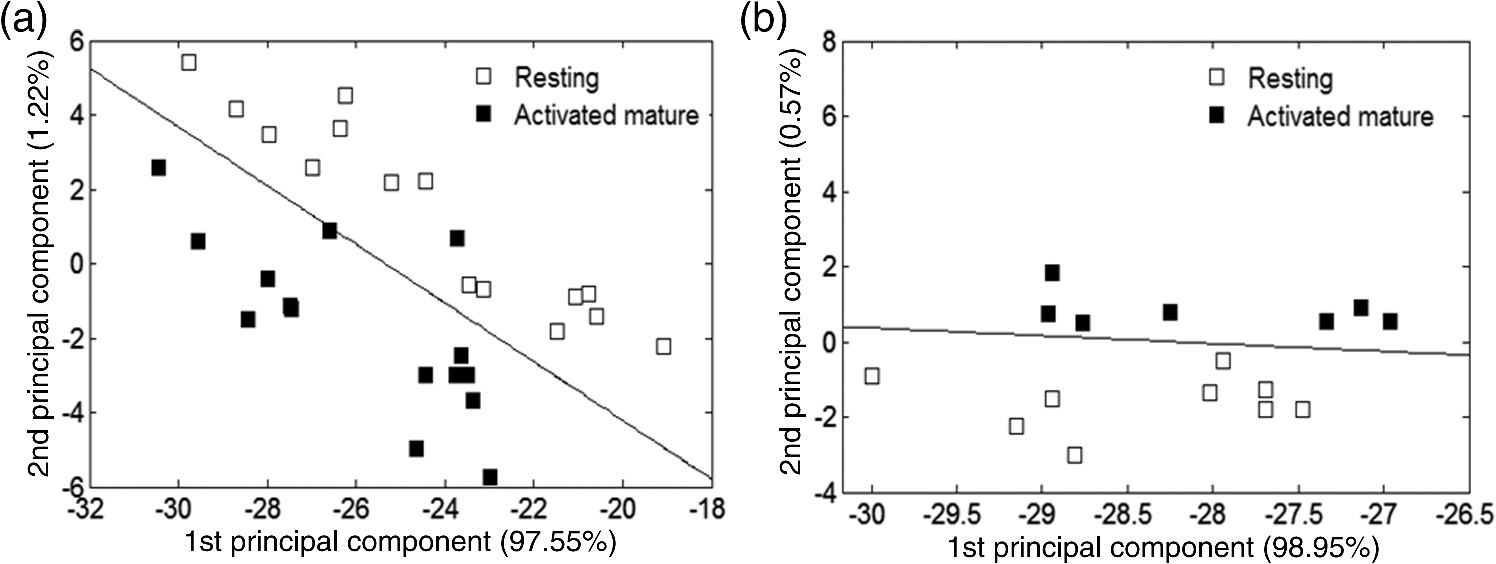
Fig. 6(a) Averaged Raman spectra of deoxyribose nucleic acid (DNA): resting (blue line) and activated mature (red line). The spectrum (black line) shows the spectral differences of resting and activated mature DNA. (b) Relative intensities of Raman spectra for resting and activated mature DNA. 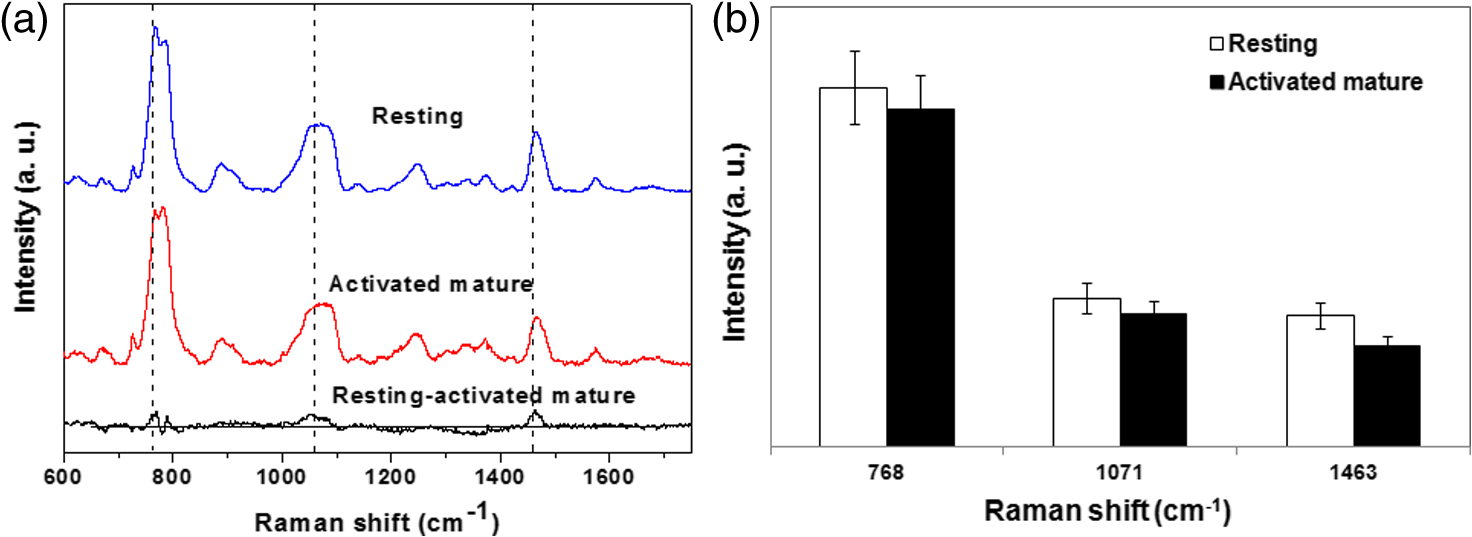 To discriminate the difference between the resting and activated mature T cells, PCA was employed. PCA transforms a set of correlated high dimensional variables into a set of uncorrelated lower dimensional components. The small number of components (i.e., PCs) obtained from PCA explain much of variability of the original variables. Therefore, the small number of PCs can replace the large number of original variables without much loss of information. To compress the Raman spectra datasets, PCA was conducted and then two PCs explaining most of total variance were selected. The lines based on two PCs give the best separation between two samples. Figure 7 shows the plots of two samples obtained by projecting them onto the two principal components. Raman spectra of cell [Fig. 7(a)] and DNA [Fig. 7(b)] both have the capability of detecting differences between resting and activated mature T cells. 4.DiscussionIn this study, we sought to identify resting and activated mature T cells at a molecular level. Activated mature T cells showed biochemical and morphological changes both inside the cell and on the cell surface. Nanoscale morphological changes in T cells were investigated using AFM. AFM is a powerful nanotechnology tool that can identify surface properties, as well as changes to mechanical properties of cell membranes.27–29 This technique also allows for the quantitative analysis of the biophysical properties of T cell activation. It was confirmed that the activated mature T cells result in an increased cell volume and cell perimeter (that is, a more irregular rim shape) over that observed in resting T cells (Fig. 3). Cell membrane integrity is vital for life as it forms a barrier between the cell and the external environment and acts as an exchange interface for materials inside and outside of the cell.30 The cell membrane also plays key roles in the physiological processes of cells, such as cell adhesion, migration, signal transduction, ion channel conductance, cellular transport, and cell-surface recognition.31 Therefore, any change in the cell membrane structure can be a sensitive indicator of the state of a cell, including normal growth conditions and death. With respect to the morphological changes associated with cellular apoptosis,22 we inferred that the increased roughness was likely due to membrane damage incurred by apoptosis. Raman spectroscopy was used to detect and identify the change in cellular components related to the apoptosis of activated mature T cells. Raman spectra of proteins (phenylalanine at and amide III at ) were increased in activated mature T cells. This phenomenon has been previously described as increases in the protein and lipid content of activated T cells.32,33 Also, it has been known that these peaks are very sensitive to the death of cells and changes in the structure of the protein.13,23 However, recent studies have shown that T cell activation state is mainly related to the changes in Raman spectra associated with DNA, not proteins.32,33 In general, a significant proportion of activated mature T cells undergo apoptosis when triggered through the CD3/T cell receptor complex. This process is rapid and is accompanied by the degradation of chromosomal DNA in most cases. Deletion of T cells by DNA degradation has an important role in regulating autoreactive T cells in the thymus.9 We observed reductions in Raman spectra intensities corresponding to DNA for activated mature T cells such as 768, 1071 and . These changes in intensity may have been due to the destruction of the ring structure, indicating disintegration of DNA related to apoptosis.24,34 A previous Raman spectral analysis of cells undergoing drug-induced apoptosis showed decreases in the DNA spectral peak at , suggesting the breakdown of phosphodiester bonds and DNA bases.35 More recently, Ong et al.36 reported the ability to discriminate between apoptosis and necrosis using Raman spectroscopy. In particular, apoptosis-related Raman DNA spectra changes were observed in in the DNA backbone (the region around 780 to ) and in in the DNA backbone (the region around 1053 to ).36 It has been suggested before that the decrease of the region may correlate with the progress of internucleosomal DNA cleavage.37,38 Together, our results indicate that the decreases in Raman intensities of activated mature DNA are related to apoptosis. These findings also suggest that Raman spectroscopy can be used as a label-free and noninvasive optical technique to determine the status of activated mature T cells. The differences between resting and activated mature T cells in the Raman spectra of cells and DNA were statistically investigated, respectively. PCA, which is a powerful multivariate statistical tool used to reduce the dimensionality of a large number of correlated variables, was conducted and then the discriminant functions (i.e., black line) between two T cells were obtained by linear discriminant analysis (LDA). LDA helps to classify data by maximizing the ratio of between-group and within-group variances.39 The activated mature T cells and DNA were significantly different from those of resting T cells and DNA. As shown in [Figs 7(a) and 7(b)], a clear separation can be seen between resting and activated mature T cells. In particular, the Raman spectra of activated mature DNA are well-discriminated from those of resting DNA. This result implies that changes in Raman spectra associated with DNA can be used as a useful determining factor when detecting activated mature T cells. 5.ConclusionIn conclusion, we sought to improve understanding about apoptosis during the process of T cell activation. Our findings regarding the biochemical and structural changes observed in activated mature T cells by Raman spectroscopy will provide new information in the area of nanomedicine for the treatment of T cell related immunity. Because the activation process of T cells is a key stage in T cell mediated immune response, the identification and quantification of the biochemical properties of activated mature T cells might lead to further understanding of the mechanism of the immune response. Additionally T cells’ activation rejects allografts or plays a role in the progression of the rejection process. Therefore, the success of the transplant is determined by monitoring for the prevention of the activation and proliferation of T cells. Further, T cells’ deficiencies are known to be involved in the pathogenesis of many autoimmune diseases. Monitoring of T cells in autoimmune diseases can be important factor for diagnosis and therapy. As far as we know, this is the first study to identify apoptosis-related molecular changes to the state of activated mature T cells. This method might be a valuable tool for the diagnosis and monitoring of allograft rejection and autoimmune diseases. AcknowledgmentsThis work was supported by a grant from Kyung Hee University in 2013 (KHU-20131081). This study was supported by the National Research Foundation of Korea funded by the Ministry of Science, ICT & Future Planning (2010-0019917). ReferencesP. H. Krammer, R. Arnold and I. N. Lavrik,
“Life and death in peripheral T cells,”
Nat. Rev. Immunol., 7
(7), 532
–542
(2007). http://dx.doi.org/10.1038/nri2115 NRIABX Google Scholar
S. S. Fleur et al.,
“Regulation of Fas-mediated immune homeostasis by an activation-induced protein, Cyclon,”
Blood, 114
(7), 1355
–1365
(2009). http://dx.doi.org/10.1182/blood-2008-11-189118 BLOOAW 0006-4971 Google Scholar
J. Drappa, N. Brot and K. B. Elkon,
“The Fas protein is expressed at high levels on CD4+CD8+ thymocytes and activated mature lymphocytes in normal mice but not in the lupus-prone strain, MRL lpr/lpr,”
Proc. Natl. Acad. Sci. U. S. A., 90 10340
–10344
(1993). http://dx.doi.org/10.1073/pnas.90.21.10340 Google Scholar
P. Meier et al.,
“Early T Cell activation correlates with expression of apoptosis markers in patients with end-stage renal disease,”
J. Am. Soc. Nephrol., 13
(1), 204
–212
(2002). JASNEU 1046-6673 Google Scholar
M. Wang, D. Windgassen and E. T. Papoutsakis,
“A global transcriptional view of apoptosis in human T-cell activation,”
BMC Med. Genomics, 1
(53),
(2008). http://dx.doi.org/10.1186/1755-8794-1-53 Google Scholar
E. O’Flaherty et al.,
“Regulation of T-cell apoptosis: a mixed lymphocyte reaction model,”
Immunology, 100 289
–299
(2000). http://dx.doi.org/10.1046/j.1365-2567.2000.00048.x IMMUAM 0019-2805 Google Scholar
E. O’Flaherty et al.,
“Examination of the of T cells to Fas ligation: induction of allospecific apoptosis,”
Transplantation, 66
(8), 1067
–1073
(1998). http://dx.doi.org/10.1097/00007890-199810270-00017 TRPLAU 0041-1337 Google Scholar
L. B. Owenschaub et al.,
“DNA fragmentation and cell death is selectively triggered in activated human lymphocytes by Fas antigen engagement,”
Cell. Immunol, 140
(1), 197
–205
(1992). http://dx.doi.org/10.1016/0008-8749(92)90187-T CLIMB8 0008-8749 Google Scholar
M. R. Alderson et al.,
“Fas ligand mediates activation-induced cell death in human T lymphocytes,”
J. Exp. Med., 181 71
–77
(1995). http://dx.doi.org/10.1084/jem.181.1.71 JEMEAV 0022-1007 Google Scholar
S. Dochow et al.,
“Tumour cell identification by means of Raman spectroscopy in combination with optical traps and microfluidic environments,”
Lab Chip, 11
(8), 1484
–1490
(2011). http://dx.doi.org/10.1039/c0lc00612b LCAHAM 1473-0197 Google Scholar
W. A. El-Said et al.,
“Analysis of intracellular state based on controlled 3D nanostructures mediated surface enhanced Raman scattering,”
PloS One, 6
(2), e15836
(2011). http://dx.doi.org/10.1371/journal.pone.0015836 1932-6203 Google Scholar
M. M. Mariani, P. J. Day and V. Deckert,
“Applications of modern micro-Raman spectroscopy for cell analyses,”
Integr. Biol., 2
(2–3), 94
–101
(2010). http://dx.doi.org/10.1039/b920572a Google Scholar
I. Notingher, J. Selvakumaran and L. L. Hench,
“New detection system for toxic agents based on continuous spectroscopic monitoring of living cells,”
Biosens. Bioelectron., 20 780
–789
(2004). http://dx.doi.org/10.1016/j.bios.2004.04.008 BBIOE4 0956-5663 Google Scholar
C. A. Owen et al.,
“In vitro toxicology evaluation of pharmaceuticals using Raman micro-spectroscopy,”
J. Cell Biochem., 99
(1), 178
–186
(2006). http://dx.doi.org/10.1002/jcb.20884 Google Scholar
B. W. de Jong et al.,
“Discrimination between nontumor bladder tissue and tumor by Raman spectroscopy,”
Anal. Chem., 78
(22), 7761
–7769
(2006). http://dx.doi.org/10.1021/ac061417b ANCHAM 0003-2700 Google Scholar
R. J. Swain et al.,
“Assessment of cell line models of primary human cells by Raman spectral phenotyping,”
Biophys. J., 98 1703
–1711
(2010). http://dx.doi.org/10.1016/j.bpj.2009.12.4289 BIOJAU 0006-3495 Google Scholar
S. I. Mannering, J. Zhong and C. Cheers,
“T-cell activation, proliferation and apoptosis in primary Listeria monocytogenes infection,”
Immunology, 106 87
–95
(2002). http://dx.doi.org/10.1046/j.1365-2567.2002.01408.x IMMUAM 0019-2805 Google Scholar
D. R. Beisner et al.,
“The requirements for fas-associated death domain signaling in mature T cell activation and survival,”
J. Immunol., 171 247
–256
(2003). http://dx.doi.org/10.4049/jimmunol.171.1.247 JOIMA3 0022-1767 Google Scholar
G. J. Lee et al.,
“Changes in collagen fibril pattern and adhesion force with collagenase-induced injury in rat Achilles tendon observed via AFM,”
J. Nanosci. Nanotechnol., 11 773
–777
(2011). http://dx.doi.org/10.1166/jnn.2011.3275 JNNOAR 1533-4880 Google Scholar
G. Binnig, C. F. Quate and C. Gerber,
“Atomic force microscope,”
Phys. Rev. Lett., 56 930
–933
(1986). http://dx.doi.org/10.1103/PhysRevLett.56.930 PRLTAO 0031-9007 Google Scholar
S. S. Schaus and E. R. Henderson,
“Cell viability and probe-cell membrane interactions of XR1 glial cells imaged by atomic force microscopy,”
Biophys. J., 73 1205
–1214
(1997). http://dx.doi.org/10.1016/S0006-3495(97)78153-0 BIOJAU 0006-3495 Google Scholar
D. C. Wang et al.,
“AFM membrane roughness as a probe to identify oxidative stress-induced cellular apoptosis,”
J. Biomech., 44 2790
–2794
(2011). http://dx.doi.org/10.1016/j.jbiomech.2011.08.021 JBMCB5 0021-9290 Google Scholar
J. Y. Ling et al.,
“Preliminary study on cordycepin-DNA interaction by Raman spectroscopy,”
Chinese Chem. Lett., 16
(1), 71
–74
(2005). Google Scholar
I. Notingher et al.,
“Discrimination between ricin and sulphur mustard toxicity in vitro using Raman spectroscopy,”
J. R. Soc. Interface, 1
(1), 79
–90
(2004). http://dx.doi.org/10.1098/rsif.2004.0008 1742-5689 Google Scholar
W. Ke, D. Zhou and J. Wu,
“Effects of UV irradiation on calf thymus DNA in aqueous solution. A Raman spectroscopic study,”
J. Raman Spectrosc., 36
(1), 39
–44
(2005). http://dx.doi.org/10.1002/jrs.1264 JRSPAF 0377-0486 Google Scholar
W. Ke, D. Yu and J. Wu,
“Raman spectroscopic study of the influence on herring sperm DNA of heat treatment and ultraviolet radiation,”
Spectrochimica. Acta Part A, 55
(5), 1081
–1090
(1999). http://dx.doi.org/10.1016/S1386-1425(98)00225-X SAMCAS 1386-1425 Google Scholar
M. Q. Hu et al.,
“Analysis of sodium benzoate biotoxicity using atomic force microscope,”
Chin. J. Biotechnol., 24
(8), 1428
–1432
(2008). http://dx.doi.org/10.1016/S1872-2075(08)60064-3 Google Scholar
J. A. Hessler et al.,
“Atomic force microscopy study of early morphological changes during apoptosis,”
Langmuir, 21
(20), 9280
–9286
(2005). http://dx.doi.org/10.1021/la051837g LANGD5 0743-7463 Google Scholar
D. J. Taatjes, B. E. Sobel and R. C. Budd,
“Morphological and cytochemical determination of cell death by apoptosis,”
Histochem. Cell Biol., 129 33
–43
(2008). http://dx.doi.org/10.1007/s00418-007-0356-9 Google Scholar
D. Marguet et al.,
“Dynamics in the plasma membrane: how to combine fluidity and order,”
EMBO J., 25 3446
–3457
(2006). http://dx.doi.org/10.1038/sj.emboj.7601204 EMJODG 0261-4189 Google Scholar
D. J. Muller,
“AFM: a nanotool in membrane biology,”
Biochemistry, 47 7986
–7998
(2008). http://dx.doi.org/10.1021/bi800753x Google Scholar
Z. J. Smith et al.,
“Integrated Raman and angular scattering microscopy reveals chemical and morphological differences between activated and nonactivated T lymphocytes,”
J. Biomed. Opt., 15
(3), 036021
(2010). http://dx.doi.org/10.1117/1.3443794 JBOPFO 1083-3668 Google Scholar
M. D. Mannie et al.,
“Activation dependent phases of T cells distinguished by use of optical tweezers and near infrared Raman spectroscopy,”
J. Immunol. Methods, 297
(1), 53
–60
(2005). http://dx.doi.org/10.1016/j.jim.2004.11.020 JIMMBG 0022-1759 Google Scholar
I. Notingher et al.,
“Spectroscopic study of human lung epithelial cells (A549) in culture: living cells versus dead cells,”
Biopolymers, 72 230
–240
(2003). http://dx.doi.org/10.1002/bip.10378 BIPMAA 0006-3525 Google Scholar
H. Yao et al.,
“Raman spectroscopic analysis of apoptosis of single human gastric cancer cells,”
Vib. Spectrosc., 50 193
–197
(2009). http://dx.doi.org/10.1016/j.vibspec.2008.11.003 Google Scholar
Y. H. Ong, M. Lim and Q. Liu,
“Comparison of principal component analysis and biochemical component analysis in Raman spectroscopy for the discrimination of apoptosis and necrosis in K562 leukemia cells,”
Opt. Express, 20
(20), 22158
–22171
(2012). http://dx.doi.org/10.1364/OE.20.022158 OPEXFF 1094-4087 Google Scholar
S. Verrier et al.,
“In situ monitoring of cell death using Raman microspectroscopy,”
Biopolymers, 74
(1–2), 157
–162
(2004). http://dx.doi.org/10.1002/bip.20063 BIPMAA 0006-3525 Google Scholar
E. Brauchle et al.,
“Cell death stages in single apoptotic and necrotic cells monitored by Raman microspectroscopy,”
Sci. Rep., 4 4698
(2014). http://dx.doi.org/10.1038/srep04698 Google Scholar
C. M. Bishop, Pattern Recognition and Machine Learning., Springer-Verlag, New York
(2006). Google Scholar
|
||||||||||||||||||||||||||||||||||||||||||||||||||||||||||||||||||||||||||||||||||||||||||||||||||||||||||||||||||||||||||||||||||||||