|
|
|
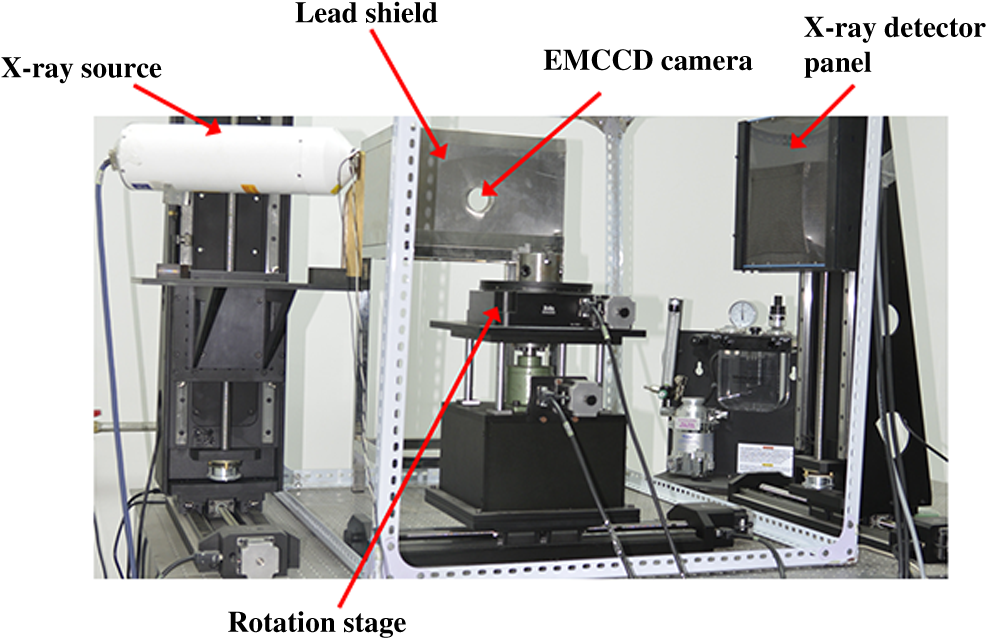
X-ray luminescence computed tomography (XLCT) has been proposed as a new molecular imaging modality.1 In principle, when irradiated with x-rays, the x-ray-excitable nanophosphors (or other similar materials)2,3 in an imaged object will produce luminescence that can be measured by sensitive photodetectors. Subsequently, by mathematically modeling the light propagation in tissues and solving an inverse problem, the three-dimensional (3-D) distributions of the nanophosphors in the imaged object can be recovered. Compared with fluorescence and bioluminescence optical tomographic imaging techniques,4 the notable advantages of XLCT include the increased tissue excitation penetration depths and the complete circumvention of tissue autofluorescence. It is helpful for the investigation of fundamental research, preclinical, and clinical experiments. In recent years, continuous research efforts have been made in XLCT imaging studies.1,5–8 The premise of XLCT imaging was demonstrated by Xing’s group in which they first reconstructed the 3-D distribution of nanoparticles by a narrow-beam XLCT imaging system.1 Further, by using a cone-beam x-ray source as irradiation, Tian et al. designed and implemented a cone-beam XLCT imaging system (CB-XLCT).5 Compared with the narrow-beam XLCT system, the CB-XLCT imaging system avoided the complex scanning model used in the narrow-beam system. As a result, it greatly decreased the data acquisition time. However, challenges remain in CB-XLCT. The main problem is that in CB-XLCT imaging processes, the nanophosphors within the cone x-ray beam region are irradiated simultaneously. This means that the acquired luminescent photons are from all irradiated nanophosphors. Due to the high degree of light scattering in biological tissues, the reconstruction of CB-XLCT is therefore a highly ill-posed inverse problem.5,6 As a result, based on the reconstructed tomographic image, it may be difficult to clearly resolve the 3-D distributions of nanophosphors within an imaged object when they are too close to each other (see Fig. 3). To some extent, it limits the wide application of CB-XLCT in biomedical research. In this work, we propose a new method to improve the imaging resolution of CB-XLCT, which is achieved by using the excitation-resolved imaging scheme combined with the principal component analysis (PCA) method. Note that in the proposed excitation-resolved imaging scheme, the nanophosphors within an imaged object are irradiated by multiband x-ray voltages. The imaging scheme is different with the conventional XLCT imaging mode where nanophosphors are only irradiated by a defined x-ray tube voltage.1,5–8 Considering that nanophosphors have a variety of excitation efficiency versus x-ray tube voltage,2,3 in the dimension of energy spectrum, the regions containing different nanophosphors will show different excitation behaviors. As a result, by using a multivariate image analysis method, it is possible to resolve and identify these regions even if they are close to each other.9,10 In this letter, PCA, as a common multivariate image analysis method, is used to resolve the adjacent nanophosphors, which is achieved by using XLCT tomographic images from the multiband x-ray voltages as the input data. In detail, in x-ray luminescence imaging, when x-rays are transported to nanophosphors in biological tissues, the nanophosphors will emit visible or near-infrared light, . Based on Lambert–Beer law, can be expressed as follows: where is the nanophosphor density, is the light yield, is the x-ray source intensity at the initial position , and is the x-ray attenuation coefficient. Furthermore, the emitted light will propagate in biological tissues, which can be modeled by the following diffusion equation:11 where is the photon density, is the absorption coefficient, and is the diffusion coefficient.Based on the finite-element method (FEM),11 the above imaging model can be converted into the following linear relationship: where is the weighted matrix, used to map the unknown nanophosphor distribution to the known measurements . In this work, the unknown is obtained by solving Eq. (4) using algebraic reconstruction technique (ART) with non-negative constraints.To clearly resolve the adjacent nanophosphors within imaged object, in this work, PCA transformation is used. In detail, here, the input data of PCA are frames 3-D XLCT tomographic images, where is the number of the used multiband x-ray voltages. If the reconstructed image has pixels, then we can represent one frame data as an column vector. By transforming all frames, the input data are arranged as a matrix . Referring to our previous studies Ref. 10, in this work, the principal component (PC) of the input data can be obtained by solving the following equation: where is the eigenvector matrix and the column of is eigenvector of the matrix with being a dataset obtained from the original data by subtracting its mean value. is a PC matrix and the first column of is the PC1, the next column is the PC2, and so on. Further, the absolute values of positive and negative elements of the PCs are, respectively, utilized as a weight factor for creating images, termed as PC-XLCT image, which can used to illustrate the distributions of nanophosphors within imaged object.The physical phantom experiment was performed with a custom-made XLCT/XCT imaging system, similar to that described in Liu et al.6 As shown in Fig. 1, in the hybrid system, the cone-beam XLCT system was placed vertically on the optical bench, while the micro-XCT system was placed horizontally. These two subsystems used a communal rotational stage. For the XLCT imaging, the x-ray source used was a microfocus x-ray source with a maximal power of 80 W (Oxford Instrument, United Kingdom). The luminescent photons emitted from nanophosphors were recorded by an electron-multiplying CCD (EMCCD) camera (iXon DU-897, Andor, United Kingdom) coupled with a Nikkor 50-mm lens (Nikon, Melville, New York). To protect the EMCCD chip from x-ray irradiation, a 4-mm depth of lead shield was used. The micro-XCT imaging was performed by the aforementioned x-ray tube combined with a CMOS x-ray flat-panel detector (2923, Dexela, United Kingdom). Figure 2(a) shows the schematic diagram of the phantom geometry, where a transparent glass cylinder (outer diameter 3.0 cm) was used as the phantom. The phantom was filled with 1% intralipid and water with and . Two transparent glass tubes (outer diameter 4.2 mm) filled with the red nanophosphor () and the blue nanophosphor () were used as the x-ray luminescent targets. To evaluate the imaging performance of CB-XLCT, the two tubes were separated with an edge-to-edge distance of about 4.2 mm along -axis. In this work, the nanophosphors ( and ) were purchased from Jiangxi Illuma Fluorescent Materials Co., Ltd., China. Fig. 2Setup for the phantom experiment. (a) Schematic diagram of the phantom geometry. (b) Schematic diagram of the cone-beam XLCT imaging experiment. Two glass tubes filled with the x-ray-excitable nanophosphors [ (red) and (blue)] are immerged inside the phantom as the luminescence targets.  To implement the proposed excitation-resolved imaging scheme, in XLCT imaging processes, the nanophosphors were irradiated by multiband x-ray source voltages (55, 60, 65, 70, and 75 kV). Note that the x-ray source current was fixed at 1 mA in all the aforementioned cases. For each specific voltage, 360 deg x-ray luminescence tomography imaging was performed using 24 projections in a 15 deg step. When collecting these luminescence projections, the integrating time of EMCCD was set to 3 s, the EM gain was set to 260, and the EMCCD binning was set to . Figure 3 shows the reconstructed XLCT tomographic images, which are obtained by using different x-ray voltages as excitation. For XLCT reconstruction, the imaged object (phantom) was discretized into 2787 nodes and 11,476 tetrahedral elements. The reconstruction region was a 3-D region. The experimental results indicate that it is difficult to resolve the distributions of nanophosphors in the two adjacent tubes based on these reconstructed tomographic images. This is mainly because of the diffusive nature of photon migration in tissues. Fig. 3Tomographic images of the nanophosphors ( and ) in the phantom experiment. These XLCT tomographic images are obtained by using different x-ray voltages (55, 60, 65, 70, and 75 kV) as excitation. All XLCT images are displayed in the same range. 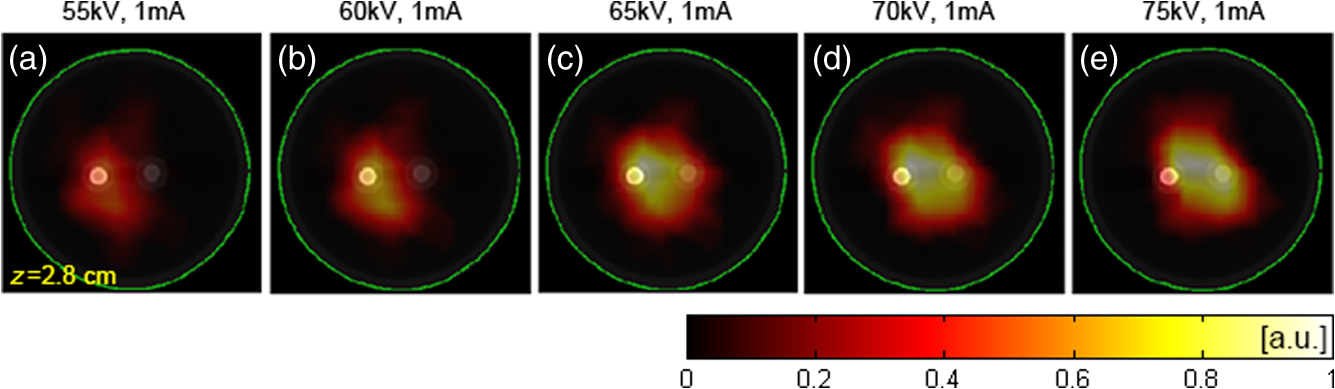 Figure 4 shows the generated PC-XLCT images. As expected, when PCA was applied to the above reconstructed XLCT images (see Fig. 3), we generated the corresponding PC-XLCT images which could be used to illustrate the distributions of nanophosphors within the imaged object even if they were close to each other. As shown in Fig. 4(a), the distribution of nanophosphors () in the phantom is illustrated by the positive PC2-XLCT image. Similarly, the distribution of nanophosphors () in the phantom is illustrated by the negative PC2-XLCT image [see Fig. 4(b)]. Furthermore, Figs. 4(d) and 4(e) show the 3-D visualization results of the positive and the negative PC2-XLCT images using different views, respectively. Fig. 4The PC2-XLCT images obtained when principal component analysis is applied to the reconstructed three-dimensional (3-D) XLCT sequence (see Fig. 3). (a) and (b) The positive and the negative PC2-XLCT images obtained from the proposed method. (c) The fusion results of the positive and the negative PC2-XLCT images. (d) and (e) The 3-D visualization results of the positive and the negative PC2-XLCT images, which are shown using different views. 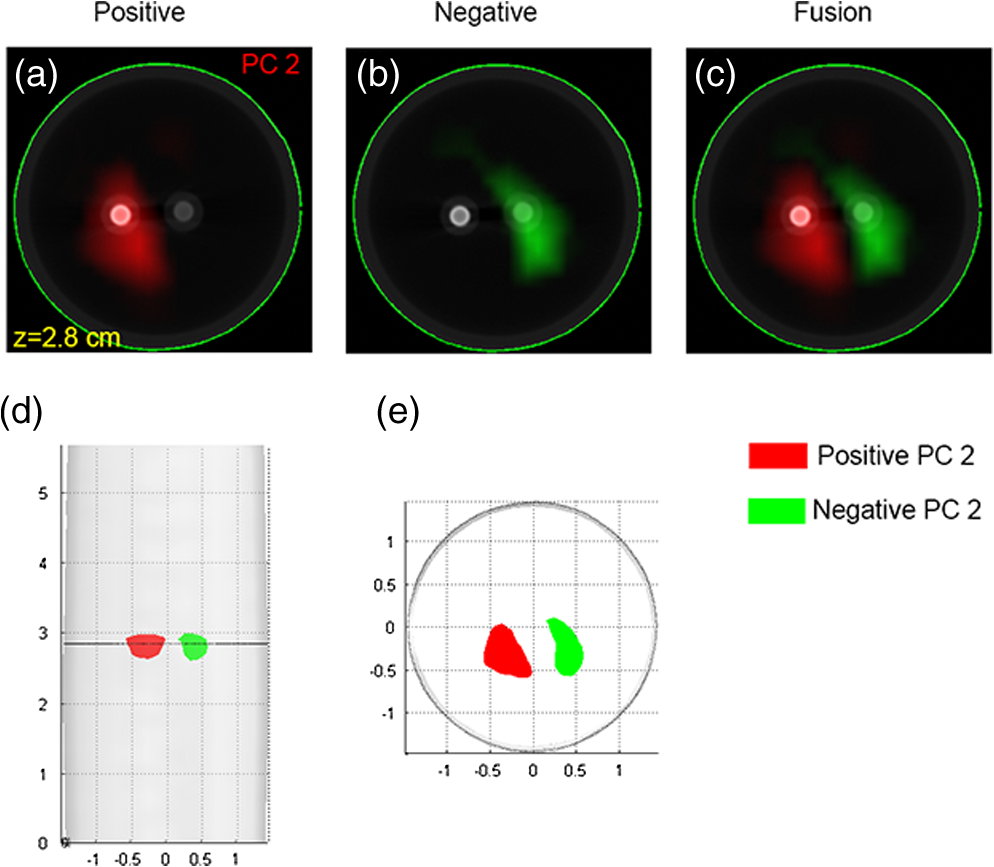 In conclusion, by using a multiband excitation-resolved imaging scheme combined with PCA method, we resolve two nanophosphors with edge-to-edge distance 2.4 mm. This method has potential for improving the imaging performance of CB-XLCT. However, when using the multiband excitation-resolved imaging scheme, the nanophosphors must be irradiated by different x-ray voltages in the imaging processing. As a result, it increases the data acquisition time. In addition, the generated PC images only reflect the structural information of the nanophosphors. To obtain the concentration of nanophosphors, independent component analysis can be considered as an effective method. Further, we must also point out that the x-ray energy information may also be used in the XLCT reconstruction, which is helpful for improving the imaging performance. Finally, more complex phantom experiments (e.g., resolving the nanophosphors of the same color with different or same concentrations) and in vivo experiments should also be considered, which will extend the application of the proposed method. Systematic studies will be investigated in our future work. AcknowledgmentsThe authors are grateful for the support from the National Natural Science Foundation of China under Grant Nos. 81371604 and 61372046. ReferencesG. Pratx et al.,
“Tomographic molecular imaging of x-ray-excitable nanoparticles,”
Opt. Lett., 35 3345
–3347
(2010). http://dx.doi.org/10.1364/OL.35.003345 OPLEDP 0146-9592 Google Scholar
C. W. E. van Eijk,
“Inorganic scintillators in medical imaging,”
Phys. Med. Biol., 47 R85
–R106
(2002). http://dx.doi.org/10.1088/0031-9155/47/8/201 PHMBA7 0031-9155 Google Scholar
I. Kandarakis et al.,
“X-ray induced luminescence and spatial resolution of :Tb phosphor screens,”
Phys. Med. Biol., 41 297
–307
(1996). http://dx.doi.org/10.1088/0031-9155/41/2/007 PHMBA7 0031-9155 Google Scholar
A. H. Hielscher,
“Optical tomographic imaging of small animals,”
Curr. Opin. Biotechnol., 16 79
–88
(2005). http://dx.doi.org/10.1016/j.copbio.2005.01.002 CUOBE3 0958-1669 Google Scholar
D. Chen et al.,
“Cone beam x-ray luminescence computed tomography: a feasibility study,”
Med. Phys., 40 031111
(2013). http://dx.doi.org/10.1118/1.4790694 MPHYA6 0094-2405 Google Scholar
X. Liu, Q. Liao and H. Wang,
“In vivo x-ray luminescence tomographic imaging with single view data,”
Opt. Lett., 38 4530
–4533
(2013). http://dx.doi.org/10.1364/OL.38.004530 OPLEDP 0146-9592 Google Scholar
W. Cong, H. Shen and G. Wang,
“Spectrally resolving and scattering-compensated x-ray luminescence/fluorescence computed tomography,”
J. Biomed. Opt., 16
(6), 066014
(2011). http://dx.doi.org/10.1117/1.3592499 JBOPFO 1083-3668 Google Scholar
C. Li et al.,
“X-ray luminescence optical tomography imaging: experimental studies,”
Opt. Lett., 38 2339
–2341
(2013). http://dx.doi.org/10.1364/OL.38.002339 OPLEDP 0146-9592 Google Scholar
E. M. C. Hillman and A. Moore,
“All-optical anatomical co-registration for molecular imaging of small animals using dynamic contrast,”
Nat. Photonics, 1 526
–530
(2007). http://dx.doi.org/10.1038/nphoton.2007.146 NPAHBY 1749-4885 Google Scholar
X. Liu et al.,
“Principal component analysis of dynamic fluorescence diffuse optical tomography images,”
Opt. Express, 18 6300
–6314
(2010). http://dx.doi.org/10.1364/OE.18.006300 OPEXFF 1094-4087 Google Scholar
M. Schweiger et al.,
“The finite element method for the propagation of light in scattering media: boundary and source conditions,”
Med. Phys., 22 1779
–1792
(1995). http://dx.doi.org/10.1118/1.597634 MPHYA6 0094-2405 Google Scholar
|