
|
|
1.IntroductionIn dental health care, about 80% of the patients suggest that a treatment with erbium lasers, which have pulse durations in the order of , is more comfortable compared to a treatment with classical mechanical tools.1 In recent years, several investigations showed that the use of ultrashort pulse lasers (USPL) can be a promising technology in the future of dentistry.2–4 USPL enable the ablation of nearly all materials, because nonlinear absorption is dominated by intensity rather than wavelength.5 One of the major challenges for the application of ultrafast lasers in dentistry is to achieve ablation rates comparable to high speed turbines, which are in the order of .6 A discussion about how the ablation rate can be scaled using USPL can be found in several publications.7–9 Recently, Schelle et al.10 demonstrated that the ablation rate scales linearly with power up to 50 W at a repetition rate of 500 kHz, enabling removal rates of up to . Besides the ablation rate, there are also open questions regarding the consequences of particle formation and their deposition in the oral region during laser application. Due to the use of USPL in dentistry, the generation of nanoparticles is unalterable.11 Nanomaterials do not constitute a homogeneous group and possess unique physically, chemically, mechanically, and structurally very different properties compared to their bulk counterparts.12 As an example, titanium dioxide, a frequently used material for dental implants, was classified as biologically inert but, in contrast, adverse effects on human health have been discovered for nanoparticles.13,14 The contamination of nanoparticles occurs via the respiratory tract (inhalation), absorption through the skin, or by oral route through food ingestion in the digestive tract. Permeation through the gastrointestinal barrier has been shown for micro- and nanoparticles. In laboratory animals, an accumulation of metal and metal oxide nanoparticles was found in their liver, spleen, and kidneys.15,16 The transport of the nanoparticles in the organ region occurs via any type of mucosa. Penetration parameters are, therefore, the apparent size (in the nanometer range) of the particles, their surface charge, the rapid regeneration of the mucosa and the change of pH values (influenced by the particles) and local effects after oral exposure including abnormal mucous production.17 This can also occur on the direct route in the oral mucosa. Thus, the risk assessment must always be made on a case-by-case basis.18 This led to an open discussion in dental health care on how this contamination causes health risks. This circumstance requires a characterization of the ablation debris, which arises from irradiation of dental hard substances. Recent investigations showed that nano- and microparticles up to a size of are ejected after irradiation with USPL.19 For a deeper understanding of the nature of these nano- and microparticle generation during the ablation process, a time-resolved investigation is necessary. For this purpose, pump–probe microscopy, a method that was already used to study the ablation stages of metals,20,21 semiconductors,20,22 dielectrics,23 or thin film systems,24 is utilized in this study to investigate the driving mechanism of nano- and microparticle formation during USPL ablation of dentin-like ivory. 2.Material and Methods2.1.Sample SelectionThe material used for this investigation was mammoth ivory. This material provides the benefits of good availability, a large surface () for experiments, and also has a structural similarity to normal/healthy human dentine.25–27 The sample was polished with diamond paste, which has a grain size of , to increase the planarity and to decrease the surface roughness. Afterward, the sample was cleaned in an ultrasonic bath. 2.2.Pump–Probe MicroscopyAn overview of the pump–probe microscopy setup is given in Fig. 1. An ultrafast laser source (Spectra-Physics, Spirit) emits pulses of a duration of 660 fs (full width at half maximum, FWHM) at a center wavelength of 1053 nm, which are divided into pump and probe pulses by beam splitter 1 beyond the laser exit. The pump pulse, used for initiating the ablation, is focused by a lens with a focal length of on the sample generating a spot diameter of about at the intensity level. In this configuration, the maximum available peak fluence is about . It should be noted that all fluence values in this study are defined as the peak fluence of a Gaussian beam. The probe pulse, used for sample illumination, is frequency doubled (SHG) to a wavelength of 527 nm and has a pulse duration in the order of 510 fs (FWHM). Subsequently, a linear translation stage delays the probe pulse optically up to 4 ns. For probing with delay times longer than 4 ns, an actively Q-switched laser source (Innolas, picoloAOT) emits a second probe pulse with a duration of 600 ps (FWHM) at a wavelength of 532 nm. Both optical paths are superimposed in beam splitter 2 for coaxial illumination of the dentin-like mammoth ivory sample. The sample is imaged by a microscope objective (, working distance 30.8 mm) to a CCD camera (PCO, pixelfly USB). An area of is imaged on a single pixel. The spatial resolution according to the Rayleigh criterion is . The exposure time of the sample is determined by the pulse duration of both probe sources. A detailed description of the pump–probe microscopy setup is given in Ref. 28. Fig. 1Overview of the pump–probe microscopy setup. The pump pulse (red branch) is focused on the mammoth ivory sample to initiate the ablation procedure. The probe pulse (green branch) illuminates the sample that is imaged by a microscope and CCD camera at different delay times. Up to 4 ns, a frequency doubled probe pulse with a duration of 510 fs is delayed on a linear stage (delay line). Above 4 ns, a probe pulse with a duration of 600 ps is triggered by an electronic delay. 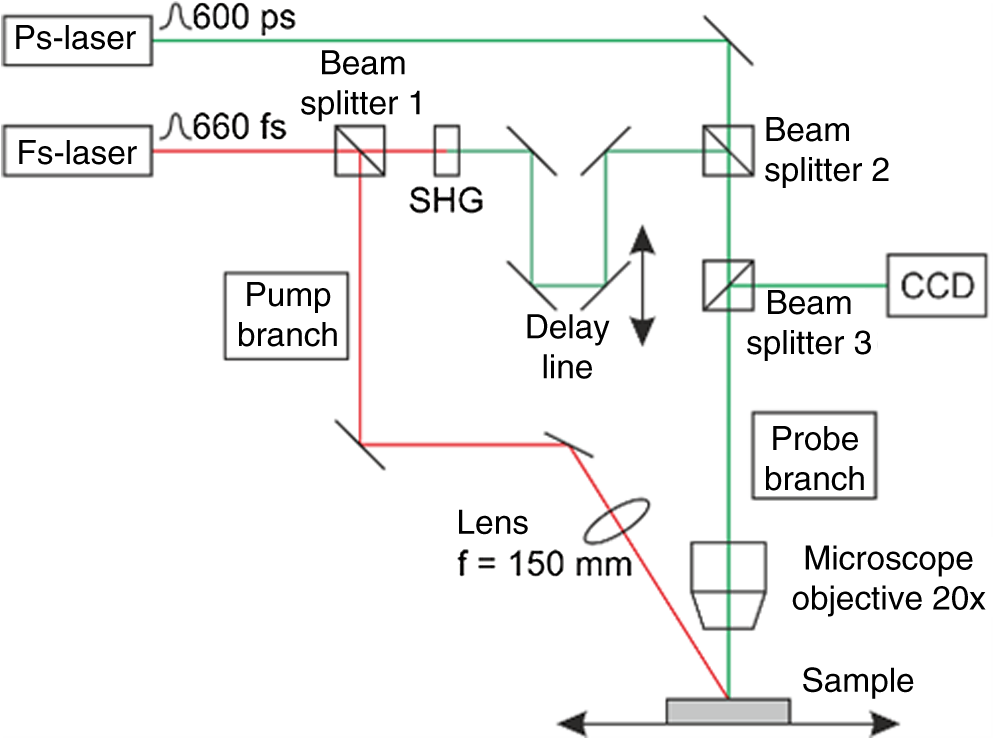 2.3.Determination of the Ablation ThresholdThe ablation threshold fluence of the mammoth ivory sample was determined by the method of Liu.29 The squared radius of the ablated crater is supposed to increase linearly with the logarithm of the applied peak fluence for an ideal Gaussian beam with the focus radius : 2.4.Image Processing and Determination of the Transient Relative Reflectivity ChangeThe camera has a dynamic range of 14 bits. Each pixel can have 16,384 different gray values. The energy of the probe pulse was adjusted to use the full dynamic range of the camera. The sample was always moved to a new position for taking a time-resolved image at a specific delay time . Three images were taken at each position. The first image was taken more than 1 s before laser interaction [Fig. 2(a)], the second image was taken at delay time [Fig. 2(b)], and the third image was taken more than 1 s after laser interaction [Fig. 2(c)]. The three 14 bit raw images in Fig. 2 were converted to 8 bit images. Then the sample was moved by about to the next position. The crater, which was ablated before, can be seen on the right side in Figs. 2(a)–2(c). Fig. 2Images of the mammoth ivory sample taken with the pump–probe microscopy setup (a) before laser interaction, (b) at a delay time of , and (c) in the final state after . The crosshair in image (a) marks the position where the laser hits the sample. The black region next to the crosshair corresponds to a crater, which was ablated for taking a time-resolved image at a previous time step. Image (d) is the normalized difference image of (a) and (b). 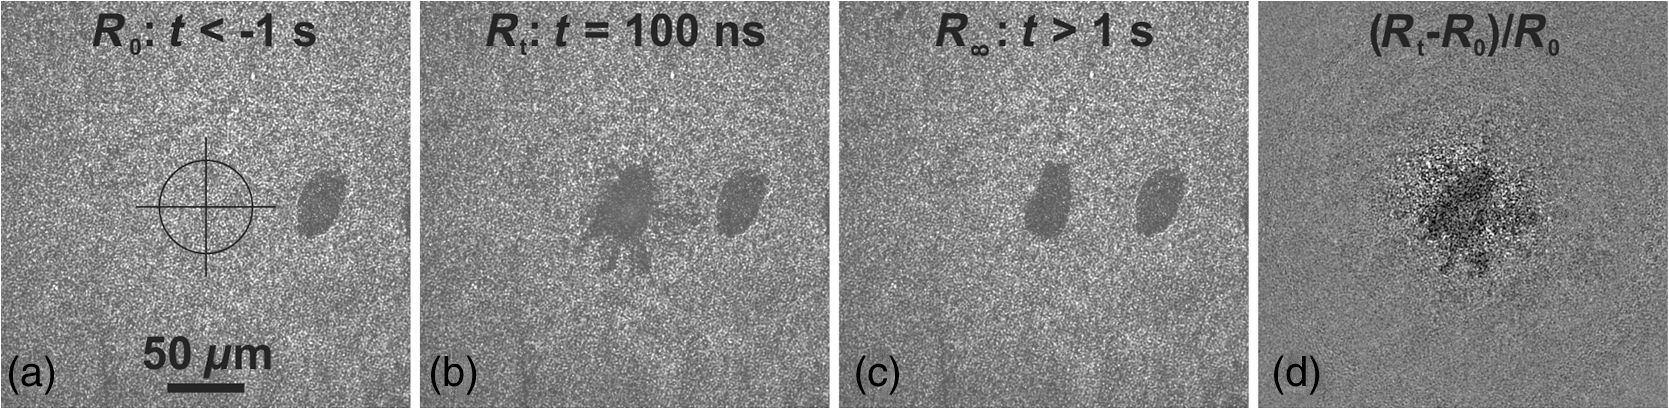 The raw images were processed as follows. In first step, the images were normalized. The gray value of each pixel was divided by the average gray value. This average gray value was calculated from the pixels of two areas covering 20% of the total number of pixels at the left and 20% at the right side of the image. These areas were located far outside the laser–matter interaction zone. In this way, fluctuations of the pulse energy could be compensated. In the second step, difference images were calculated. The normalized image taken before laser interaction [Fig. 2(a)] was subtracted from the normalized image taken at delay time [Fig. 2(b)]. The difference was then divided by the normalized image taken before laser interaction. In this way, the calculated values for each pixel represent the relative reflectivity change, which can be written as where is the reflectivity of the original sample and is the reflectivity at the pump–probe delay time .The minimum value of the relative reflectivity change is . The maximum value in the experiment was not higher than 5. To create a grayscale image, the values of the relative reflectivity change are shifted and stretched so that the minimum was 0 and the maximum was 256. The final difference image is shown in Fig. 2(d). The speckle contrast in the background is reduced significantly and the ablation dynamics can be distinguished from irregularities on the sample surface. For example, the crater at the right side of the raw images in Figs. 2(a)–2(c) vanishes completely in the difference image in Fig. 2(d). The transient relative reflectivity change was measured in the center of the irradiated spot. The relative reflectivity change was averaged over an area of pixels, which corresponds to a region of and is plotted as function of the delay time. 2.5.Model Function of the Transient Relative Reflectivity ChangeThe transient relative reflectivity change of the USPL excitation of metals,20 semiconductors,22 and dielectrics23 has already been investigated in several publications. This has not yet been the case for mammoth ivory. Since dental tissue has dielectric properties, the relative reflectivity change during absorption, excitation and relaxation of electrons, and phase transitions of mammoth ivory should be also comparable to that of dielectrics.23 In this case, the laser pulse is absorbed by the valence band electrons. The excited electrons are then transferred to the conduction band.30 The electron density in the conduction band increases, the surface becomes metallic, and the reflectivity increases, as was already observed for semiconductors.20,22 Mero et al.23 showed that the reflectivity is proportional to the electron density in the conduction band. The measured excitation time should be governed by the cross-correlation time of the pump- and probe pulse .28 The transient relative reflectivity change of the excitation can be described by the error function.31 Electron–phonon collisions then lead to a decrease of the electron density in the conduction band.23 The consequence is a decrease of the reflectivity, which can be described by a falling exponential function with the relaxation time and the initial value . This is the case for fluences below the ablation threshold. Just above the ablation threshold, scattering and absorption of the probe light in an expanding liquid–gas phase mixture can decrease the relative reflectivity change to negative values.20 At even higher fluences, plasma shielding can also decrease the reflectivity of the probe pulse.21 The transient relative reflectivity change is expressed by the following model equation:31 where is the final value of the relaxation term and defines the delay time zero point.2.6.Determination of the Speed of Pressure WavesThe sample is observed from the top and the time-resolved images are difference images (see Fig. 2). The speckle contrast can thus increase either if the sample has moved or if the probe pulse was deflected. The first case can occur if a pressure wave propagates through the material. In this case, a ring with an increased speckle contrast can be observed and its diameter increases with time. The radius of such a pressure wave as a function of time is where is the speed of the pressure wave and is its initial radius.The second case (deflection of the beam) can occur if a shock wave propagates in air. Laser-induced shock waves in air were already observed by other pump–probe observations from the side21,32 and can also be observed from the top.21 An outgoing wavefront originating from a shock wave in air (see Sec. 3) can be observed in the example for the calculation of a difference image in Fig. 2(d) and is clearly visible at the borders of the image. The Taylor–Sedov equation33 describes the spherical expansion of a shock wave originating from an infinitesimally small source. The radius in dependency of the delay time is33 where is a constant, depending on the released energy, the ambient pressure, and the gas constant. The velocity of the shock wave can be obtained by differentiating Eq. (5) with respect to .The comparison of the first derivatives of Eqs. (4) and (5) indicates that the velocity of a pressure wave in the bulk is constant, whereas the velocity of a shock wave in air decreases with time. These different behaviors are used to identify the nature of expanding rings in the time-resolved image series. 3.Results3.1.Steady State Investigation of the Single Pulse Ablation BehaviorThe mammoth ivory sample was irradiated with different fluences. The threshold fluence for ablation was determined to be , using the method of Liu28 that was described in the chapter earlier. Figure 3 shows a confocal microscopy image of a sample position that was irradiated with a fluence of . Several plateaus and deep holes with an average depth of about can be observed inside the crater. The edge of the crater has an irregular shape. Thermal side effects, such as melting or microcracks, cannot be observed. Fig. 3Confocal microscopy image of the ablated spot on a dentine like mammoth ivory sample. The sample was irradiated by a single laser pulse at a fluence of , a spot radius of , and a pulse duration of 660 fs. The topography reveals that about deep craters were ablated, while some plateaus remained inside the irradiated region.  3.2.Time-Resolved Transient Ablation StagesTime-resolved microscopy images of the sample, which was irradiated with a fluence of , are shown in Fig. 4. As described above, the gray values of the image represent the relative reflectivity change at the respective delay time. The image series shows that a bright spot appears in the center within a time frame of at delay time 0. Within 10 ps, the center becomes dark. For delay times longer than 10 ps, the radius of the dark region increases up to in the horizontal axis between 10 and 20 ps. Then its diameter remains constant up to 1 ns. The radius of the dark region in the center increases further between 1 and 20 ns. An ellipse of speckles with increased contrast can be observed around the dark region. The diameter of this ellipse increases with time. Individual dark regions appear around the circle between 50 and 200 ns. These dark regions can be observed up to a delay time of about . Some areas around the dark center also show an increased speckle contrast. In the final state, the radius of the dark region in the center is larger than that below 2 ns. The total diameter of about fits to the diameter of the crater in Fig. 3. 3.3.Transient Relative Reflectivity ChangeFigure 5 shows the relative reflectivity change measured in the center of the irradiated region. The reflectivity increases strongly in the center within at delay time 0, followed by a reflectivity decrease to negative values within 10 ps. Equation (3) was fitted to the data points (red curve). The least square fit procedure returned for the initial relative reflectivity change and for the final relative reflectivity change . The determination of was used to shift the measured values to delay time 0. The excitation time was kept constant at , defined by the cross-correlation time of pump- and probe pulse.27 The decay term revealed a relaxation time of . The relative reflectivity change becomes negative after a delay time of about 7 ps. Fig. 5Relative reflectivity change () measured in the center of the irradiated region versus time (black squares). Variable time steps were used to resolve the steep reflectivity increase and subsequent decrease. A model function, which describes the reflectivity increase by an error function and the decrease by an exponential decay function, was fitted to the data points (red curve). 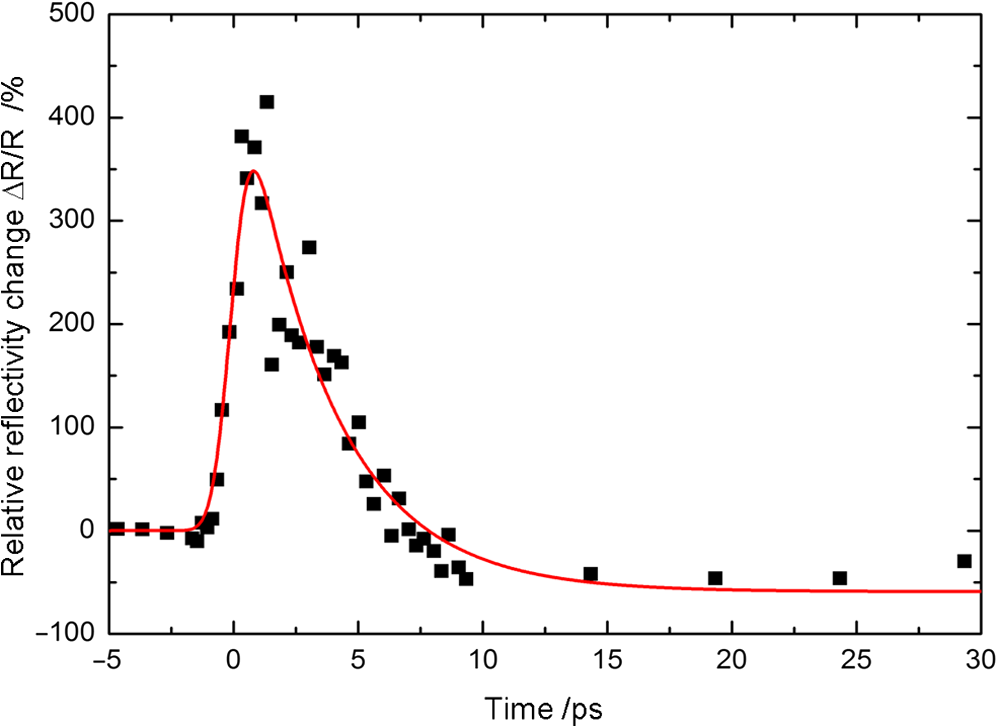 3.4.Pressure Wave in the BulkFigure 6(a) shows a time-resolved image at a delay time of 20 ns. An ellipse of increased speckle contrast can be observed. The radii of both axes are plotted as a function of the delay time and Eq. (4) was fitted to the data points in Fig. 6(a). The radii of both axes increase linearly with time between 2 and 20 ns. The slope of the fit function reveals that the slow and fast axes of the ellipse expand at constant velocities of and , respectively. The velocity of a shock wave in air would decrease with time according to Eq. (5). Thus, the expanding ellipse can be related to an anisotropic sound wave that propagates with directional sound velocities through the mammoth ivory. The extrapolation of the data points to indicates that the starting point of the sound wave in the fast axis is and in the slow axis, it is . Fig. 6(a) Difference image taken at a delay time of 20 ns and a fluence of . An ellipse with increased speckle contrast can be observed, caused by anisotropic sound waves that locally deform the bulk ivory. (b) The radius of the fast and slow axis of the axis increases linear with time at velocities of 2.8 and , respectively. It has to be mentioned that the ellipticity of the shock wave also depends on the sample position. It was seen most clearly at a position where an image sequence at a fluence of was recorded. However, the average shockwave velocity is about the same at a fluence of 6.0 J/cm².  3.5.Shock Wave in AirA second wavefront can be observed between 50 and 200 ns, but this time with a circular shape, as shown in Fig. 7(a). Equation (5) was fitted to the data points between 60 and 200 ns. The good agreement and the fact that the shock wave velocity drops to the speed of sound in air indicate that this wavefront can be identified as shock wave propagation in air and not in the bulk material. Similar shock waves in air were already observed by other pump–probe observations from the side in the same time region.21,32 The data points do not follow the trend at earlier delay times, indicating that the shock wave cannot be approximated as a spherical shockwave at the beginning. Fig. 7(a) Difference image taken at a delay time of 100 ns and a fluence of . Particle ablation can be observed in the center and a circular shock wave, which propagates in air, can be identified at the edges of the image. (b) Radius of the shock wave in air versus time (black squares). The Taylor–Sedov equation, which describes the spherical expansion of a shock wave in air originating from an infinitesimal small source, was fitted to the data points between 60 and 200 ns (red solid line). The data points do not follow the trend at earlier delay times, indicating that shock wave cannot be approximated as spherical shockwave at the beginning (red dashed line). The derivated velocity of the shock front (blue dotted line) decreases below and above 200 ns, which is almost the sound velocity in air.  4.Discussion4.1.Origin of NanoparticlesThe good agreement of the fit of Eq. (3) suggests that the observed reflectivity dynamics (shown in Fig. 5) are comparable to those of dielectrics. The decay term, which describes the relaxation of excited electrons23 and the formation of a liquid–gas mixture,20,22 revealed a relaxation time of . Moreover, the relative reflectivity change drops to negative values after a delay of 7 ps. The relaxation of the electrons itself does not cause a negative relative reflective change at fluences below the ablation threshold.23 For this reason, the drop to negative values must be related to the onset of ablation.20,22 Figure 4 shows that the radius of the dark region increases up to in the horizontal axis between 10 and 20 ps. This observation suggests that the ablation process could be slower at lower fluences. Then the diameter remains constant up to 1 ns. This region is called the excited region in the following. Nanoparticles are smaller than the spatial resolution of the pump–probe microscope, which is about , and thus cannot be resolved individually. Figure 4 shows that the speckle contrast is increased locally between 50 and 200 ns. As mentioned above, the time-resolved images represent difference images. The speckle contrast can increase either if the sample has moved or if the probe pulse was deflected. A local movement of the sample is not expected. Since individual particles cannot be resolved, the increase of the speckle contrast could be related to scattering of particles that are smaller than a few micrometers. The increased speckle contrast could also originate from Rayleigh and Mie scattering if the size of the particles is smaller than or in the order of the wavelength of the probe beam, respectively. These could be nanoparticles, which were already captured and observed after USPL irradiation of dentin-like material with a fluence of about .19 These nanoparticles might arise from the condensing and solidifying gas–liquid mixture, which was created in the excited region. 4.2.Origin of MicroparticlesFigure 6 shows the propagation of an anisotropic pressure wave through the mammoth ivory. The directional velocities of the pressure wave could be connected to the growth direction of the sample. The starting position of the sound wave was determined to be and in the fast and slow axes, respectively. The initial radius of the pressure wave in the fast axis, which propagates in the horizontal direction, is thus equal to the horizontal radius of the excited region. This observation suggests that the pressure was generated by the expansion of the excited region. Such pressure waves can already be generated by ultrafast thermal expansion and by the density change during melting.34 Figure 4 shows that the radius of the dark circle in the center is nearly constant between 20 ps and 1 ns. Subsequently, the radius increases by about between 1 and 5 ns. After 5 ns and in the final state, the radius of the dark region in the center remains constant. Now the dark region measures about in diameter and fits the diameter of the crater in Fig. 3. The delayed expansion of the dark circle suggests that material removal outside the excited region could be driven by a different second ablation mechanism, which can be explained as follows. The measured pressure waves with velocities of 2.8 and take about and 1.8 ns, respectively, to pass the distance . The time the dark region takes to increase correlates with the doubled runtime of the shock wave. This calculation suggests that the pressure wave, which was initiated at the edges of the excited region, propagates through the surrounding region. The rarefaction wave behind causes spallation35,36 leading to the material removal around the excited region. Individual dark regions appear around the dark circle, which can be clearly observed between 50 and 200 ns in Fig. 4 and are shown enlarged in Fig. 7(a) at a delay time of 100 ns. The increase of the dark region in the center and the subsequent appearance of individual dark regions can be related to the ejection of microparticles. The microparticles cover the crater up to about . The profile of the crater in Fig. 3 shows that the shape of the edges is irregular and that plateaus can be found in the center. These observations suggest that the microparticles might arise from the spallation of the tissue around and below the excited region. 4.3.Transient Stages of the Ultrafast Laser Ablation of Dental TissueThe observations and the discussion of the origin of nano- and microparticle formation in combination with literature suggest that the transient stages of dentin-like mammoth ivory ablation using ultrafast lasers can be described in five steps, as shown in Fig. 8. These steps are as follows:
Fig. 8Model of (dental) tissue ablation with ultrashort pulse lasers. The pulse is absorbed by the electrons at delay time 0. The electron relaxation heats the ivory sample and initiates melting and evaporation between 1 and 10 ps. The ultrafast expansion generates pressure, causing a shock wave in the bulk and in the air. Nanoparticles expand from the excited region, whereas a shock wave propagates through the bulk and the rarefaction wave behind causes fragmentation within 2 ns. Microparticles are thus ejected and leave a crater in the bulk. The final state is reached after .  4.4.Consequences for the Application of USPL in DentistryDental hard tissue removal with erbium lasers has been implemented in dentistry for more than 25 years. The ablation process is primarily based on the resonant absorption of laser radiation in water. Based on different interaction mechanisms on the tissue surface and in the subsurface region, an explosive removal of the mineral matrix occurs.37 For that reason, an external water spray, which is utilized for laser–tissue interaction and cooling during hard tissue preparation, is always needed. The sizes of the created ablated particles (i.e., enamel and dentin) are mainly in the order of tens of micrometers.38 In contrast to USPL, the multiphoton absorption process is responsible for material removal. Compared to the classical, linear laser–tissue interaction mechanism mentioned above, the effect is much stronger and is accompanied with a plasma formation. Particles in the micrometer and especially in the nanometer range are unalterable.19 We will do further investigations to determine if an additional water spray and a suction is sufficient to avoid deposition of nanoparticles on the oral mucosa. Regarding the ablation rates, the spallation also enables high ablation rates of about in dentin using a USPL system with a power output of 50 W and a pulse repetition rate of 500 kHz as reported in Ref. 10. This is comparable to using a classical Er:YAG laser with a pulse repetition rate of 50 Hz and 8 W average power (estimation based on Ref. 37). However, at higher pulse repetition rates, the efficiency may be reduced by particle shielding, as observed for metal drilling with USPL and pulse frequencies above 500 kHz.39 By contrast, particles shielding the ablated crater were observed in Fig. 4 only up to a delay time of , but not at longer delay times. For this reason, particle shielding should not occur if pulse repetition rates below 1 MHz will be applied. 5.ConclusionThe aim of this study was to investigate the driving mechanisms of particle formation during ultrafast laser ablation of dental tissue. For this purpose, time-resolved microscopy was utilized to investigate the ablation dynamics of dentin like mammoth ivory after irradiation with 660 fs laser pulses. The results suggest that the ultrafast expansion of the excited and heated material generates a pressure wave in the surrounding bulk tissue. The rarefaction wave behind the pressure wave causes spallation in the surrounding region. Nanoparticles might arise from the excited region during condensation and solidification of the expanding gas–liquid mixture. Microparticles are ejected from the surrounding region and leave a crater with plateaus in the mammoth ivory sample. AcknowledgmentsThe authors gratefully acknowledge funding of the Erlangen Graduate School in Advanced Optical Technologies (SAOT) by the German Research Foundation (DFG) in the framework of the German excellence initiative. Additionally, this work was partly funded by the Seventh Framework Programme of the European Commission within the project “Solardesign,” under grant No. 310220 and the BMBF funding initiative MABRILAS, under the grant No. 13 N10190. Spectra Physics is acknowledged for the close collaboration and the financial support of the Josef Ressel Center for material processing with ultrashort pulsed lasers. The financial support by the Austrian Federal Ministry of Economy, Family and Youth and the National Foundation for Research, Technology and Development is gratefully acknowledged. ReferencesU. Keller et al.,
“Erbium:YAG laser application in caries therapy. Evaluation of patient perception and acceptance,”
J. Dent., 26
(8), 649
–656
(1998). http://dx.doi.org/10.1016/S0300-5712(97)00036-5 JDENAB 0300-5712 Google Scholar
M. H. Niemz et al.,
“Tooth ablation using a CPA-free thin disk femtosecond laser system,”
Appl. Phys. B, 79
(3), 269
–271
(2004). http://dx.doi.org/10.1007/s00340-004-1579-2 Google Scholar
M. Fahey et al.,
“Precise dental ablation using ultra-short-pulsed 1552 nm laser,”
Int. J. Heat Mass Transfer, 51
(23–24), 5732
–5739
(2008). http://dx.doi.org/10.1016/j.ijheatmasstransfer.2008.04.034 IJHMAK 0017-9310 Google Scholar
M. Straßl et al.,
“Novel applications of short and ultra-short pulses,”
Appl. Surf. Sci., 247
(1–4), 561
–570
(2005). http://dx.doi.org/10.1016/j.apsusc.2005.01.174 ASUSEE 0169-4332 Google Scholar
M. C. L. Luengo et al.,
“Evaluation of micromorphological changes in tooth enamel after mechanical and ultrafast laser preparation of surface cavities,”
Lasers Med. Sci., 28
(1), 267
–273
(2013). http://dx.doi.org/10.1007/s10103-012-1144-x LMSCEZ 1435-604X Google Scholar
G. B. Altshuler, A. V. Belikov and Y. A. Sinelnik,
“A laser-abrasive method for the cutting of enamel and dentin,”
Lasers Surg. Med., 28
(5), 435
–444
(2001). http://dx.doi.org/10.1002/lsm.1071 LSMEDI 0196-8092 Google Scholar
A. V. Rode et al.,
“Subpicosecond laser ablation of dental enamel,”
J. Appl. Phys., 92
(4), 2153
–2158
(2002). http://dx.doi.org/10.1063/1.1495896 JAPIAU 0021-8979 Google Scholar
M. H. Niemz,
“Ultrashort laser pulses in dentistry: advantages and limitations,”
Proc. SPIE, 3255 84
–91
(1998). http://dx.doi.org/10.1117/12.308211 PSISDG 0277-786X Google Scholar
M. S. Bello-Silva et al.,
“Precise ablation of dental hard tissues with ultra-short pulsed lasers. Preliminary exploratory investigation on adequate laser parameters,”
Lasers Med. Sci., 28
(1), 171
–184
(2013). http://dx.doi.org/10.1007/s10103-012-1107-2 LMSCEZ 1435-604X Google Scholar
F. Schelle et al.,
“Ultrashort pulsed laser (USPL) application in dentistry: basic investigations of ablation rates and thresholds on oral hard tissue and restorative materials,”
Lasers Med. Sci., 29
(6), 1775
–1783
(2014). http://dx.doi.org/10.1007/s10103-013-1315-4 LMSCEZ 1435-604X Google Scholar
S. Barcikowski, A. Hahn and B. N. Chichkov,
“Nanoparticles as potential risk during femtosecond laser ablation,”
J. Laser Appl., 19
(2), 65
–73
(2007). http://dx.doi.org/10.2351/1.2402526 Google Scholar
E. A. J. Bleeker et al.,
“Considerations on the EU definition of a nanomaterial: science to support policy making,”
Regul. Toxicol. Pharm., 65
(1), 119
–125
(2013). http://dx.doi.org/10.1016/j.yrtph.2012.11.007 Google Scholar
M. Shimizu et al.,
“Maternal exposure to nanoparticulate titanium dioxide during the prenatal period alters gene expression related to brain development in the mouse,”
Part. Fiber Toxicol., 6 20
(2009). http://dx.doi.org/10.1186/1743-8977-6-20 Google Scholar
J. A. Keelan,
“Nanotoxicology: nanoparticles versus the placenta,”
Nat. Nanotechnol., 6
(5), 263
–264
(2011). http://dx.doi.org/10.1038/nnano.2011.65 NNAABX 1748-3387 Google Scholar
C.-M. Lee et al.,
“Optical imaging to trace near infrared fluorescent zinc oxide nanoparticles following oral exposure,”
Int. J. Nanomed., 7 3203
–3209
(2012). http://dx.doi.org/10.2147/IJN.S32828 Google Scholar
Y. Wang et al.,
“Susceptibility of young and adult rats to the oral toxicity of titanium dioxide nanoparticles,”
Small, 9
(9–10), 1742
–1752
(2013). http://dx.doi.org/10.1002/smll.201201185 SMALBC 1613-6810 Google Scholar
E. Fröhlich and E. Roblegg,
“Models for oral uptake of nanoparticles in consumer products,”
Toxicology, 291
(1–3), 10
–17
(2012). http://dx.doi.org/10.1016/j.tox.2011.11.004 TXCYAC 0300-483X Google Scholar
W. Aust et al.,
“Risk of nanoparticles?,”
Laryngol. Rhinol. Otol., 88
(3), 162
–166
(2009). http://dx.doi.org/10.1055/s-0029-1192011 Google Scholar
J. Meister et al.,
“Particle characteristics of different materials after ultra-short pulsed laser (USPL) irradiation,”
Proc. SPIE, 8208 82080B1
(2012). http://dx.doi.org/10.1117/12.910181 PSISDG 0277-786X Google Scholar
D. Von Der Linde and K. Sokolowski-Tinten,
“Physical mechanisms of short-pulse laser ablation,”
Appl. Surf. Sci., 154–155 1
–10
(2000). http://dx.doi.org/10.1016/S0169-4332(99)00440-7 ASUSEE 0169-4332 Google Scholar
J. Jandeleit et al.,
“Fundamental investigations of micromachining by nano- and picosecondlaser radiation,”
Appl. Surf. Sci., 127–129 885
–891
(1998). http://dx.doi.org/10.1016/S0169-4332(97)00762-9 ASUSEE 0169-4332 Google Scholar
J. Bonse et al.,
“Time- and space-resolved dynamics of ablation and optical breakdown induced by femtosecond laser pulses in indium phosphide,”
J. Appl. Phys., 103
(5), 054910
(2008). http://dx.doi.org/10.1063/1.2885105 JAPIAU 0021-8979 Google Scholar
M. Mero et al.,
“Femtosecond dynamics of dielectric films in the pre-ablation regime,”
Appl. Phys. A, 81
(2), 317
–324
(2005). http://dx.doi.org/10.1007/s00339-005-3216-2 Google Scholar
M. Domke et al.,
“Ultra-fast movies of thin-film laser ablation,”
Appl. Phys. A, 109
(2), 409
–420
(2012). http://dx.doi.org/10.1007/s00339-012-7072-6 Google Scholar
R. K. Nalla et al.,
“Ultrastructural examination of dentin using focused ion-beam cross-sectioning and tranmission electron microscopy,”
Micron, 36 672
–680
(2005). http://dx.doi.org/10.1016/j.micron.2005.05.011 MICNB2 0047-7206 Google Scholar
M. Locke,
“Structure of ivory,”
J. Morphol., 269
(4), 423
–450
(2008). http://dx.doi.org/10.1002/jmor.10585 JOMOAT 0362-2525 Google Scholar
C. Heckel,
“Physical characteristics of mammoth ivory and their implications for ivory work in the upper paleolithic,”
Mitt. Ges. Urgesch., 18 71
–91
(2009). Google Scholar
M. Domke et al.,
“Ultrafast pump-probe microscopy with high temporal dynamic range,”
Opt. Express, 20
(9), 10330
–10338
(2012). http://dx.doi.org/10.1364/OE.20.010330 OPEXFF 1094-4087 Google Scholar
J. M. Liu,
“Simple technique for measurements of pulsed Gaussian-beam spot sizes,”
Opt. Lett., 7
(5), 196
(1982). http://dx.doi.org/10.1364/OL.7.000196 OPLEDP 0146-9592 Google Scholar
B. C. Stuart et al.,
“Laser-induced damage in dielectrics with nanosecond to subpicosecond pulses,”
Phys. Rev. Lett., 74
(12), 2248
–2251
(1995). http://dx.doi.org/10.1103/PhysRevLett.74.2248 PRLTAO 0031-9007 Google Scholar
W. Holzapfel et al.,
“Initial electron-transfer in the reaction center from Rhodobacter sphaeroides,”
Proc. Natl. Acad. Sci. U. S. A., 87
(13), 5168
–5172
(1990). http://dx.doi.org/10.1073/pnas.87.13.5168 Google Scholar
I. Mingareev and A. Horn,
“Time-resolved investigations of plasma and melt ejections in metals by pump-probe shadowgrpahy,”
Appl. Phys. A, 92
(4), 917
–920
(2008). http://dx.doi.org/10.1007/s00339-008-4562-7 Google Scholar
G. Taylor,
“The formation of a blast wave by a very intense explosion. I. Theoretical discussion,”
Proc. R. Soc. A, 201
(1065), 159
–174
(1950). http://dx.doi.org/10.1098/rspa.1950.0049 Google Scholar
J. Sotrop et al.,
“Numerical simulation of ultrafast expansion as the driving mechanism for confined laser ablation with ultra-short laser pulses,”
Appl. Phys. A, 113
(2), 397
–411
(2013). http://dx.doi.org/10.1007/s00339-013-7849-2 Google Scholar
A. Vogel and V. Venugopalan,
“Mechanisms of pulsed laser ablation of biological tissues,”
Chem. Rev., 103
(2), 577
–644
(2003). http://dx.doi.org/10.1021/cr010379n CHREAY 0009-2665 Google Scholar
G. Paltauf and P. E. Dyer,
“Photomechanical processes and effects in ablation,”
Chem. Rev., 103
(2), 487
–518
(2003). http://dx.doi.org/10.1021/cr010436c CHREAY 0009-2665 Google Scholar
J. Meister et al.,
“Influence of the water content in dental enamel and dentin on ablation with erbium YAG and erbium YSGG lasers,”
J. Biomed. Opt., 11
(3), 034030
(2006). http://dx.doi.org/10.1117/1.2204028 JBOPFO 1083-3668 Google Scholar
U. Keller et al.,
“Ultrastructural changes of enamel and dentin following Er:YAG laser radiation on teeth,”
Proc. SPIE, 1200 408
–415
(1990). http://dx.doi.org/10.1117/12.17486 PSISDG 0277-786X Google Scholar
A. Ancona et al.,
“High speed laser drilling of metals using a high repetition rate, high average power ultrafast fiber CPA system,”
Opt. Express, 16
(12), 8958
–8968
(2008). http://dx.doi.org/10.1364/OE.16.008958 OPEXFF 1094-4087 Google Scholar
BiographyMatthias Domke is a research assistant at the University of Applied Science in Vorarlberg, Austria. He received his MSc degree in photonics from the University of Applied Science in Munich in 2010. He started his PhD at the University Erlangen-Nuernberg in 2010. His current research interests include material processing with ultrashort pulse lasers. Anna Gavrilova is studying photonics as a master’s student at the University of Applied Sciences in Munich, Germany. Currently, she is writing her master’s thesis at the Laser Center of Munich University, where she investigates laser-material-interaction. Before, she received her BSc degree for physics at the same Institute. Stephan Rapp is a PhD student at the Laser Center Munich in co-operation with the Friedrich-Alexander University Erlangen-Nuernberg, Germany. He received his MSc degree in photonics from the University of Applied Sciences Munich in 2012. His current research interests include material processing with ultrashort pulse lasers with special focus on the investigation of the temporal laser-material interaction by pump-probe techniques. Matthias Frentzen holds the position of a full professor in Periodontology and Laser Research at the University of Bonn, Germany, in 2006. He was appointed to a co-director of CEMBIO (Center of Molecular Biotechnology of the University of Bonn). Since 1988, he has served as the head of the “Laser Research Unit” of the Dental School. His special research interests are related to laser diagnostics, the use of lasers in operative dentistry and periodontology, and USPL. Joerg Meister holds the position of a research group leader of the “Laser Research Unit” at the Department of Periodontology, Conservative and Preventive Dentistry at Bonn University, Germany. He is also employed as a scientific co-worker at the Department of Conservative Dentistry, Periodontology and Preventive Dentistry, at RWTH Aachen Dental Faculty. His research field is focussed on laser tissue interaction processes, diode-pumped erbium lasers, ultrashort pulse lasers and lasers in operative dentistry. Heinz P. Huber currently holds a position as professor for Laser Technology and Photonics at the Munich University of Applied Sciences, Germany. In his research, he focuses on laser ablation with ultrafast lasers. With his research group he is performing temporally and spatially resolved simulations and experiments of laser-matter interaction. He received his PhD in physics (on ultrafast laser spectroscopy) at LMU Munich and a master’s degree in physics from TUM in Germany. |


