
|
|
1.IntroductionColorectal cancer is the third most common cancer diagnosed in both men and women in United States. The American Cancer Society’s most recent estimates for the number of colorectal cancer cases in the United States for 2013 are: 102,480 new cases for colon cancer, 40,340 new cases for rectal cancer, and 50,830 deaths. The estimated numbers for 2014 are: 96,830 new cases of colon cancer, 40,000 new cases of rectal cancer, causing 50,310 yearly deaths.1,2 It is estimated that over 40,000 members of the adult population in the UK are diagnosed with colorectal cancer each year.3 Colorectal cancer, when detected in the early stages, is one of the most curable gastrointestinal cancers. Treatment is mainly surgical, during which the cancerous section of the bowel is removed. Surgery is followed by chemotherapy and radiotherapy, according to disease staging.4 Full recovery after five years can theoretically be achieved if the tumor is completely removed before metastases evolve. Relapse of colorectal cancer is high and has a deep influence on quality of life.5 Three kinds of recurrence are diagnosed: (a) local recurrence (), (b) local recurrence with distant metastasis (), and (c) recurrence only by distant metastasis without local recurrence (). Because the margins of the removed cancerous lesion cannot always be determined very well macroscopically, surgeons may occasionally leave malignant cells during the surgery. The margins of the removed (diseased) colonic section may lead to 83% of the local recurrences. This shortcoming apparently arises due to the normal morphology often observed in the resection margins in standard pathology tests, although an early stage of abnormality may be present. Colon cancer tumors that have high microvessel density tend to recur or spread.6 The likelihood that rectal cancer will recur within five years of treatment is 11% for an original tumor smaller than 3 cm and 28% for an original tumor larger than 3 cm.7 Colon and rectal cancers’ recurrence also depends on the stage of the disease.7 Researchers have confirmed that the more advanced the rectal cancer, the more likely it was to recur. The local recurrence rate of rectal cancer is double that of other parts of the colon. Cancer recurrence rates during a five-year period are as follows: 10% for stage 1 rectal cancer, 24% for stage 2 rectal cancer, and 41% for stage 3 rectal cancer. Thus, careful assignment of the patients into subgroups with different risks of recurrence is very important and enables physicians to more precisely focus their treatment strategies. Previous studies demonstrate that up to 55% of rectal cancer patients experience a recurrence within five years from the time of surgery.7,8 The high variance between study results may derive from the variety of different cancer cases, original tumor size, the stage of the disease in which the surgery is performed, and the expertise of the surgical team.7,9 The leading cause of high local recurrences of rectal cancer (up to 83% in some studies),10,11 is attributed to the fact that the surgical margins of the removed cancerous colorectal part, although macroscopically “clean,” may be microscopically involved with malignant cells. This is why surgery always takes safe margins (5 to 7 cm) away from the tumor limits when needed and feasible. Colorectal cancer patients undergo follow-up routine monitoring of the colon for any relapse and for diagnosis of malignant polyps. This is accomplished using tests such as colonoscopy, flexible sigmoidoscopy, and CT colonoscopy and barium enema, or biochemical tests such as fecal immunochemical test or sDNA test.12 A fecal occult blood test is used for screening the healthy population at risk. These protocols are time-consuming and sometimes uncomfortable for the patient. There is a clear need for a new methodology that can lead to early diagnosis of abnormality—one that would result in a better prognosis for patients as well as help the surgeon decide if the resection margin contain foci with recurrence and metastatic potential. Fourier transform infrared (FTIR) spectroscopy has emerged as a powerful tool for chemical analysis because of its ability to provide detailed information on the spatial distribution of chemical composition at the molecular level.13 In applications requiring qualitative and quantitative analyses, the potential of IR spectroscopy to identify biochemical components via analysis of their vibrational spectrum fingerprint is unsurpassed.13 The biochemical fingerprint of cells, tissues, and fluids that become altered in a diseased state can be detected using FTIR spectroscopy. Applications of FTIR spectroscopy in the field of medicine, especially diagnosis, have shown encouraging trends. Various biomolecular components of the cell give rise to a characteristic spectrum that is rich in structural and functional aspects.13–15 Distinctions between normal and neoplastic cells and tissues have been made by utilizing spectroscopic methods.16,17 FTIR microscopy (FTIR-MSP) has been shown to provide important clues to the changes in the biochemical composition of cells and tissues, especially during carcinogenesis.18–21 Many studies have shown that FTIR has a good potential as a diagnostic tool to evaluate different tissues from different organs, such as the colon and cervix,22–24 which exhibit spectral variations in the mid-IR region, congruent with the biochemical variations in the tissue. These organs have a well-defined pattern of cell growth in their epithelia, resulting in established spectral variations that can be exploited for detecting changes during disease initiation, progression and remission. Biological changes associated with abnormal cell proliferation are reliable markers for detecting the initiation of colorectal malignancy.25,26 Abnormal maturation and migration of colonic crypt cells indicate premalignant or malignant stages of cancer.27 Thus, the detection of abnormal crypts becomes an integral part of the diagnosis and management of colorectal cancer28,29 and the potential of FTIR spectroscopy adds a translational dimension to the field of IR spectroscopy in biomedicine.30 Our previous studies have shown that IR spectroscopy can detect the early development of diseases or cell transformation at a stage when the morphology is still normal.31,32 This important observation was named by our group as the “crypt model.”33,34 Our research group has reached important milestones in the overall understanding of the complex changes that occur in single cells as well as tissues on the level of biochemical composition when a cell undergoes changes between normal and abnormal conditions.19,20,22,33 Our overall goal in this study is to evaluate the potential of IR optical technology as a tool for the objective detection and assessment of abnormality in the colon tissue, enabling a “correct” determination of the margins of the diseased part and thus reducing colorectal cancer recurrences. 2.Material and MethodsIn this study we included 128 crypts from eight colorectal cancer patients. The biopsies used in this study were cut from blocks of the anastomosis area of colorectal sections of these patients. According to expert pathology review, these blocks have normal morphology. One patient (21 crypts) who has no recurrence will be used as control, four patients had local recurrence,35 and three patients had distant recurrence36 (Table 1). Table 1Details about the samples included in this study, including patient numbers, number of biopsies from each patient, number of measured crypts from each biopsy, and the medical files of the patient.
2.1.Preparation of SamplesFormalin-fixed, paraffin-embedded colorectal tissues were retrieved from the histopathology files of Soroka University Medical Center (SUMC) in Beer-Sheva, Israel. The colorectal cancer patients have undergone surgery since 2007 and their records were retrieved with their consent, after the SUMC Institutional Review Helsinki Board approval. Two paraffin longitudinal tissue sections were cut from each biopsy; one was placed on an IR-transparent zinc–selenium slide, and the other on a glass slide. We followed the method proposed by Argov et. al.19 for sample preparation and data acquisition, where sections 10-microns thick were used. The second slide was stained with hematoxylin and eosin for histology review by an expert pathologist. Three measurements were taken from each crypt, one from the bottom, the second from the middle, and the third from the top, as can be seen in Fig. 1. The average size of the crypt in normal colonic mucosa is about 0.5 mm. 2.2.FTIR MeasurementsData were collected in the transmission mode, as used in all our previous studies on colonic tissues, because this sampling method provides a good signal to noise ratio. Spectra were collected at spectral resolution from 600 to . The measured spot has a circular shape with a diameter of and it takes about one minute to acquire a spectrum of 128 scans. For the analysis, ranges from 600 to and 2800 to were used. Previous studies have shown that these spectral ranges are most informative in terms of detection of cell activity and proliferation. 2.3.Spectral ManipulationSpectral manipulations of the measured samples were performed using OPUS 7. The spectra were bisected into high (2800 to ) and low (900 to ) regions, respectively. Both regions were subjected to baseline corrected ranges using concave rubber band methods (with 32 and 64 consecutive points for the low region, the high region, respectively, and five iterations in the manual mode). In addition, the spectra were normalized using vector normalization followed by offset correction. 2.4.Multivariate AnalysisMultivariate analysis is commonly used in problems of classification. Principle component analysis (PCA) and linear discriminant analysis (LDA) are extensively used as differentiation tools in issues involving biological samples.37–42 The PCA and LDA calculations were done using the software codes developed in-house, and based on MATLAB® (The MathWorks, Natick, Massachusetts) software. PCA is used for dimensionality reduction of the measured spectra. Using PCA we find PCs with the highest variability and ignoring the direction with low variability in order to improve the recognition. In the PCA procedure, the data is represented by only a partial set of the new basis vector (in the present work we used PC1-PCK, with ). Moreover, many experiments show that in a significant number of problems the variability is correlated with the reparability, so that properly choosing will lead to a better characterization of the sample. The LDA calculations followed the PCA as a linear classifier.43 The assumptions using LDA are that the probability density of each class is assumed to be Gaussian and centered around the mean and the covariance matrix is the same for all classes. In the leave one out (LOO) algorithm, the training set contained all but one of the measured spectra. The category of the left-out spectrum was then calculated and compared to the known category. This procedure was repeated many times, but in each repetition a different measured spectrum was left out. The LOO algorithm is a good method when the number of points is relatively small, as it uses all the points except one for training. In the LOO algorithm all the data points are included, both for training and validation, exactly in the same manner; therefore randomness does not play a role. 3.ResultsOur study is based on 128 crypts from 12 biopsies; all were taken from resection margins of eight colorectal adenocarcinoma patients. The resection margins were identified as normal by standard histology methods. Figure 2 shows the typical IR control absorption spectra measured from three different sites along the height of the longitudinal section of the same crypt-base, middle, and top—as shown in Fig. 1. Fig. 2Infrared (IR) absorption spectra measured from three different sites of the same crypt, taken from the control section in the range 900 to before manipulation. The main vibrations are assigned in the figure. 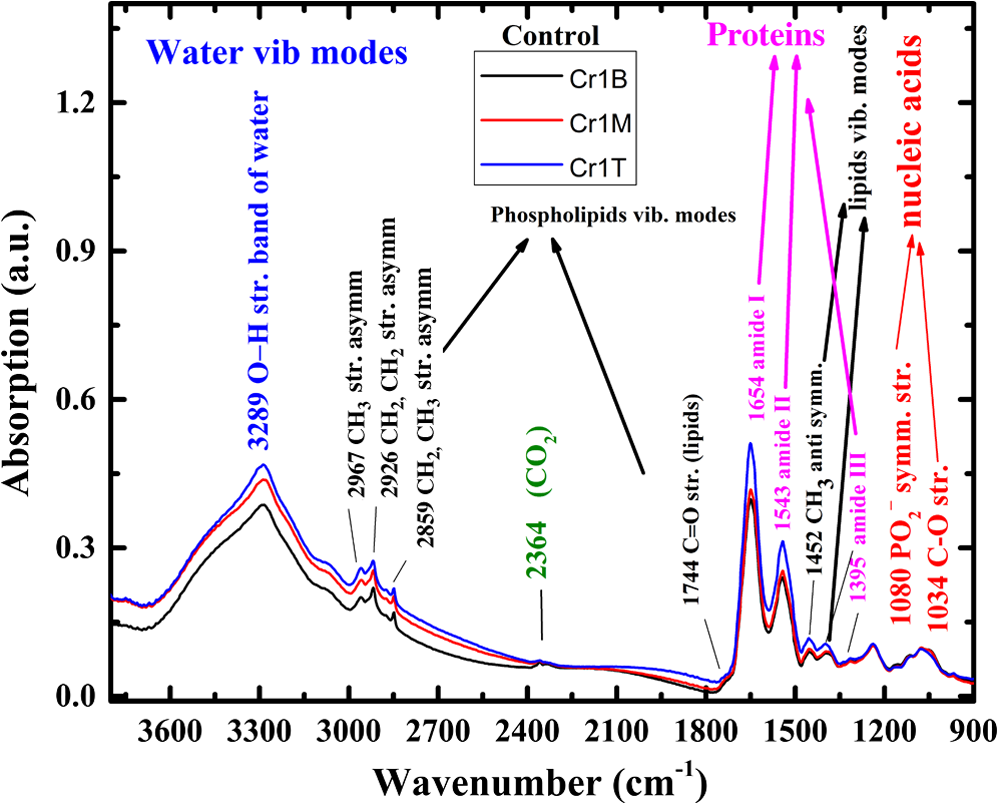 These spectra are displayed in the full mid-IR region before manipulation. In the 400 to mid-IR region, the main features of the spectra are due to the organic molecules such as phospholipids, proteins, lipids, carbohydrates, and nucleic acids. The absorption bands with centroids at 2967, 2926, and are due to and symmetric and antisymmetric vibrations44 and at they are due to the phospholipids and ester vibration.45 Amide I ( stretching and stretching vibrations at ), amide II ( stretching and a CNH bending vibration at ), and amide III () bands are due to proteins.46–49 The peaks at 1241 and are attributed to ionized antisymmetric and symmetric stretching, respectively.50 The lower range of the spectrum, at 800 to , reflects mainly carbohydrates. , , functional groups of proteins, lipids, and phosphate compounds are the main attributers to the absorption bands in the 1185 to range. Figure 3 shows the absorption spectra from three different crypts in the 950 to range after spectral manipulation, baseline correction, bisecting, and vector normalization. Fig. 3IR absorption spectra measured from the bottom, middle, and top sites of the same crypt in the range 950 to after spectral manipulation: (a) control crypt, (b) local recurrence crypt, and (c) distant recurrence crypt.  The spectra were measured from bottom, middle, and top sites of the same crypt, respectively: (a) the same control crypt shown in Fig. 2, (b) crypt from a section belonging to a patient who experienced a local recurrence, and (c) crypt from section belonging to a patient who experienced a distant recurrence. In all the measured crypts, we noticed that carbohydrates and nucleic acids absorption bands in the 900 to range have higher absorption intensities for the middle sites when compared to the top and bottom spectra measured from the same crypt. There was no trend in the other sites; in some cases, the bottom was higher and in other cases the top was higher, without regard to the specific crypt type. Our main goal in this study was to classify the investigated crypts into three categories—control, local recurrence, and distant recurrence, based on their IR absorption spectra. We tried to differentiate among the three categories using spectra measured from bottom, middle, and top sites of the crypts. When we plotted the spectra measured from all 128 crypts from the same sites, the spectra were similar and overlapped, making it difficult to classify them using simple methods such as comparison of specific absorbance bands intensities, k-means, and clustering; thus, we used PCA followed by LDA for the classification goal. wWe used PCA for dimensionality reduction. In this study the dimensions were reduced from hundreds to just a few. In PCA the data is expressed by a few points in such a way that most of the information in the measured data is preserved. The maximum dimension used in this study was eight. Two-dimensional plots of PC components were tried in order to check the PCA potential in differentiating between the various categories of the crypts. Figure 4 shows the results of PCA performed in the low wavenumber range of 900 to for the classifications in the three groups. In this figure, we show the projection of the data on specific planes; the classification was done in couples. In Fig. 4(a), the data was classified into two groups, control and abnormal, the latter containing the crypts from local and distant recurrence patients. In Fig. 4(b), the classification was performed between the control and local recurrence crypts data. Figure 4(c) makes the same comparison using distant instead of local crypts data. Figure 4(d) shows the classification comparisons between local and distance recurrence crypts. Fig. 4Two-dimensional plots of the control, local recurrence, and distant recurrence crypts based on the principle component analysis (PCA) calculations in the 950 to range. Part (a) represents PC4 versus PC1 for all data, clustered as control and abnormal categories. Part (b) represents PC4 versus PC1 for control and local recurrence crypts. Part (c) represents PC2 versus PC1 for the control and distant recurrence crypts data. Part (d) represents PC2 versus PC1 for the local and distant recurrence crypts data. In these plots, each individual spectrum is represented as one point in the specific projection plane. The variance of each PC is given in percentage.  We are using PCA to look for a new basis called loadings or PCs, and each spectrum is represented as a linear combination of its basis. The variances among the classes is captured by the different PCs. PC1 has the largest variance reflected by the ratio of its eigenvalue over the sum of all the eigenvalues of all the PCs . As can be seen, there is a clear trend of clustering in the four plots, but nevertheless, some of the data points of the different groups are mixed. In order to improve the classification results we applied LDA to the data after PCA calculation. LDA is a classifier that is applied to the data for classification purposes. The LDA separation rule suggests a larger variance between classes and a small variance within classes. LDA calculations were applied to three different regions—the low region (950 to ), the high region (2800 to ), and the combined regions (2800 to , 950 to ), in order to evaluate the classification rates of the spectra into the control, local recurrence, and distant recurrence groups. For this goal in our spectra analyses, after PCA we used LDA—a statistical multivariate supervised method, with the LOO approach for validation. We repeated this algorithm many times (in many experiments), using different ranges and different sites of the spectra. LDA determines the best differentiation of the groups for each number of PCs, assigning the errors in identification of the spectra to the correct group. These errors are displayed as a function of PC numbers. As examples, we plotted two Figs. 5(a) and 5(b). Figure 5(a) shows the percentage of identification errors versus PC number, with the calculation based on the low wavenumber range 950 to . The same calculations were performed three times—in the first we used data from the bottom sites of the crypts, in the second we used data from the middle sites, and in the third we used data from the top sites. Fig. 5Identification errors in percentage as a function of PC numbers for data in the (950 to ) range. (a) The data was classified into three classes, control, local recurrence, and distance recurrence. (b) The data was classified into two classes, control and abnormal (with local and distance recurrence added together). The identification was estimated using linear discriminant analysis calculations, applied to the data after PCA calculations were performed. For both plots, the calculation was based on spectra measured from bottom (green), middle (red), and top (blue) sites of the crypts included in this study.  We tried two different strategies of classification. In the first strategy, we required simultaneous classification of the spectra into three categories—control, local recurrence, and distant recurrence [Fig. 5(b)]. In the second strategy, the classification was done in two stages. In stage 1 the data was classified as control and abnormal, while the abnormal contains both local and distant recurrence crypts [Fig 5(a)]. In stage 2, the abnormal crypts were classified into local recurrence and distant recurrence crypts (data not shown). As can be seen from Figs. 5(a) and 5(b), the middle and bottom sites gave better results than the top. The second strategy gave better results than the first strategy, as reflected in the lower errors achieved using the first five PCs. Using the first strategy, the error was more than 20%, while using the second strategy with the same PCs number the error was less than 7%. We used a specific number of PCs to generate confusion matrixes, which were used to calculate the errors associated with each experiment. In each matrix we listed the success and error rates of the classification procedure. Table 2 shows the confusion matrices for several experiments for different classifications employing different PCs. We tried the same analysis for the high wavenumber region but the results were poor. In addition, using the combined region also did not improve the results achieved in the low wavenumber region. Thus, we chose to introduce the classification results based on the low wavenumber region alone. Table 2Successful identification of the colorectal crypts using linear discriminant analysis (LDA) with the leave one out (LOO) approach. In (a), the identifications were obtained using LDA calculations and the LOO approach for the middle sites spectra, with six PCs. In (b), the identifications were obtained using the middle site spectra with one PC. In (c), the identifications were obtained using the bottom spectra with five PCs. In (d), the identifications were obtained using the middle sites spectra with one PC. In (e), the identifications were obtained using middle sites spectra with eight PCs.
In order to make some speculation about biological changes in the epithelial cells in the colonic tissue in three biological systems, the LDA analysis was performed on three different ranges of the 950 to low region—range I (950 to ), range II (1350 to ), and range III (1480 to ). The first range is dominated by carbohydrates and nucleic acids, the second range is dominated by lipids and proteins, and the third range is dominated mainly by the protein absorption bands. The calculations were performed on the spectra measured from the middle sites of the crypts. The error rates of the classification results, together with the number of PCs used in each calculation, are summarized in Table 3. Table 3Identification errors in percentage versus PC number, derived using LDA calculation for ranges I (950 to 1350 cm−1), II (1195 to 1726 cm−1), and III (600 to 1195 cm−1). The calculation was performed to differentiate between all couples within the three categories.
In our analyses, every spectrum was treated as individual case, but many of them are from the same biopsy. Thus, we repeated our LDA analysis using a “voting procedure.” In this procedure, from each class of the same tissue, several FTIR spectra were obtained from different crypts. The category of a given tissue was determined by a voting procedure: the training set is taken from all the other tissues. Then we pick each spectrum of the tissue, one by one, and determine its category. The tissue’s category is chosen as the one that was predicted the maximal number of times (hence the name “voting”). Using the voting procedure, an 83.3% success rate was achieved. 4.DiscussionRelapse of colorectal cancer causes great burdens, both mentally and physically, with inconvenience induced by the need for long treatments and follow-up. Determining safe surgical margins of the removed cancerous lesion during colorectal surgery is of great importance, because it will hopefully minimize both the local recurrence and subsequently, any distant cancer disease. As a consequence, it may improve patient survival and quality of life, and may also reduce a patient’s distress. The main purpose of this interdisciplinary study is to evaluate the potential of FTIR spectroscopy in tandem with multivariate analysis to detect and predict whether the patient will experience colorectal cancer recurrence based on colorectal tissue taken during surgery from the margins of the removed diseased part of the colon. The promising classification results obtained in this study are very important in this direction. Enlarging the database and the number of patients and intensive studies in this field may lead, in the future, to helping surgeons detect and assess the existence of free micrometastasis margins of the removed section of the colon in order to reduce the recurrence rate. The final goal of the project is to analyze frozen tissue sections during surgery and this initial study was based on formalin-fixed, paraffin-embedded tissue samples. It is important to emphasize that all the samples have passed the same procedure of formalin fixation and deparaffinization before measurements. This procedure may influence the lipid signatures in the higher wave number region as previously shown.33 However, all our samples have passed the same procedure of preparation and our analysis was based on all of the wavenumbers of the spectrum where proteins, carbohydrates, and other molecules do exist. These molecules are not influenced by the preparation procedure. Thus, we believe that our results are good and similar to what could be achieved using frozen tissues. Our logical next step should be to perform the analysis on FTIR spectra obtained from frozen tissues. Thus, we may be able to give the surgeon a quick and safe enough FTIR spectrum analysis report during the surgery to decide about the level of resection margins. The PCs, calculated using PCA, are arranged according to their weights in generating the calculated spectra as linear combinations of these PCs. PC1 has the largest weight; the second PC (PC2), has the largest weight after PC1, and so on. The weights of these PCs are determined by their eigenvalues. Based on the characters of these PCs, it is possible to suggest a correlation between the differences among the various classes and the number of PCs used in order to classify them. In other words, it is possible to suggest that the largest spectral differences between the categories are in those sites where the differentiation is the best, according to a lower number of PCs. According to this suggestion, the best results of the classification were obtained from the middle site spectra, as can be seen from Fig. 5 and Table 2. These results can be explained due to the biochemical changes along the crypt height. The human large intestinal surface consists of small crypts having epithelial cells secreting mucosa at a rate of about three liters per day. According to the “crypt model,” the cells in the normal crypt have a high turnover rate, with a life cycle of approximately 48 h. The epithelial cells in a normal crypt continuously undergo mitosis at the bottom of the crypt, move gradually upward along the basement membrane, and are finally disposed into the intestinal lumen.27,51–53 In the middle of the crypts the epithelial cells are mature and are different relative to the bottom and top crypt cells. Thus, the maturation and migration of cells in the colonic crypt hold important clues to the origin of the premalignant and malignant stages of cancer.25 Abnormal cell proliferation and biological changes have been known to be an indicator of the initiation of malignancy.35,54 Studies about the growth pattern of the crypts have been undertaken to trace abnormal proliferation. Although certain markers have been used to identify abnormal cell proliferation51,52,54 the actual maturation of the crypt in terms of total biochemical changes has not been established. The detection of abnormal crypts is essential for the diagnosis of the spread of colorectal cancer and its effective management.16,36 In our previous studies, we have shown the possibility of using FTIR-MSP to help identify abnormal crypt proliferation in histologically normal biopsies.30,34 This abnormal growth cannot yet be observed by expert pathologists (based on cell morphology), but may develop later into premalignant and malignant stages. As can be seen from Fig. 3, in all the crypts, without exception, the middle sites spectra have higher absorption bands in the carbohydrate region of 900 to . It is important to outline that there are significant advantages to investigating the crypts using longitudinal sections over transverse sections, as can be seen from Fig. 3. There are clear differences in the spectra measured from different sites along the height of the crypt. Thus, using transverse cross, the changes due to different sites along the height of the crypt may interrupt and confuse the spectral changes due to different categories such as normal and abnormal. A correct classification was recorded when the decision method was correlated with the patient’s medical files. Our preliminary results showed a good agreement with the relapse of colorectal malignancy, as appeared in the medical files (Fig. 5). The classification procedure was done with two strategies. The second strategy was better than the first, as reflected in Fig. 5. Using PCA calculations the PCs were set in descending order relative to their weight, as reflected in their eigenvalues. Thus, PC1 has the largest weight because it has the largest eigenvalue. As can be seen from Figs. 5(a) and 5(b), the differentiation based on the middle sites using the first five PCs has the lowest number of errors. This may lead to speculation that major changes may have occurred in the epithelial cells at the middle sites of the crypt. It was possible to differentiate between control and distant recurrence crypts with 81% sensitivity and 100% specificity using the first PC only [Table 2(c)], while we needed five PCs to achieve 90% sensitivity and 100% specificity [Table 2(b)]. We may speculate that the differences between distant recurrent crypts and normal crypts are larger than the differences between the control and local recurrences. The differences between the local and the distant crypts are minor, but our system is still capable of differentiating between them. Using the middle sites’ spectra and eight PCs, it was possible to achieve 92.5% accuracy, calculated as the diagonal sum of [Table 2(d)] divided by the total number of spectra. In choosing the number of PCs in this study, we considered the complexity of the problem in addition to the number of classes to be classified. PCA enables the use of vectors for features that have a lower dimension while preserving the classification performance. This dimensionality reduction has many advantages because it enables us to simplify the classifier and to improve the processing time.55 The choice of the number of PCs depends on the number of classes and the level of classification. In this study, the investigated crypts were identified “morphologically” as normal crypts. This identification was made by an experienced surgeon during surgery. Their spectra are similar and overlap, with minute differences in intensities. Thus the classification of these spectra into different classes requires the utilization of advanced mathematical and statistical tools to differentiate among them with high accuracy. We, therefore, used the first eight PCs for the classification procedure. LOO is an approach that is extensively explored in machine learning. This approach was used with LDA calculation for cross-validation using, each time, different sets for prediction so that the test sets would be statistically independent. This approach is commonly used to estimate the error in a small sized population as well as ensuring the validation of results.56,57 Examining the LDA classification results listed in Table 3, using the LOO algorithm for all the ranges in the low region, using PC1 (the highest variance), we observe several conclusions. (1) The changes between the different couples of the three categories are spread in all the cell components. It was possible to differentiate between the different couples with good accuracy. (2) The spectral differences between control crypts and distant crypts are the largest. Using the 1350 to and 1480 to ranges, it was possible to differentiate between control and distant sites with more than a 93% success rate. (3) The classification errors are high when differentiating between local recurrence and distant recurrence crypts, relative to the other couples. Thus, the biological changes are minor and we need more PCs to achieve good classification results. Moreover, the largest changes between these crypts are in the amide I and II bands, resulting from proteins absorption bands. This is also true for control and local recurrence crypts [Table 3(b)], where amide I and amide II bands gave the best differentiation results. (4) Range I (950 to ) gave the lowest classification results for all four different pairs. Although the middle sites gave the highest absorbance in the same crypt, for the control, local, and distant crypts (Fig. 2), when comparing the different classes, this range did not show a good differentiation trend. Using the “voting” procedure in LDA calculation with the first three PC’s, an 83.9%, success rate was achieved. It is important to mention that using this procedure our calculation was based on 12 biopsies while we have 128 crypts. We believe that this is the main reason for the success reduction and that using a higher number of biopsies can improve our success rate. Typically, three measurements are made on a crypt at the base, middle and apex and about ten crypts were measured per histological section. It takes about 30 min for a quick diagnosis. In frozen sections no staining is involved, alleviating the need for extra processing time. The extra time required will involve transport of the tissue from the OT to the laboratory, time taken for preparing frozen section and data analysis which should be in the range of another 30 min. Therefore, within one hour, while the patient is still under surgical procedure a quick diagnosis can be made and the results conveyed back to the surgeon. Our method is objective and is fully computerized, fast, and simple to use. As a consequence, it may be possible to develop the method for frozen tissue sections. The success of this method using frozen sections may initiate the process of applying the method on site during colorectal surgery in order to assist the surgeon in determining the safe surgical margins of the removed cancerous lesion. 5.ConclusionsIt was possible to differentiate between control, local, and distance recurrence crypts based on their IR absorption spectra and using multivariate analysis PCA followed by LDA. The longitudinal sections of the crypts contain viable information due to their unique biological structure. Such information does not exist in the transverse sections. Enlarging the database to include more crypts from the three categories will enable the use of more sophisticated nonlinear classifiers, which may improve the results and achieve even higher success rates. AcknowledgmentsThe authors mourn the loss of their esteemed colleague Dr. Shmuel Argov from the Department of Pathology, Soroka University Medical Center, who passed away during the performance of this study. This manuscript is dedicated to him in loving memory. Dr. Elad Shufan is gratefully acknowledged for fruitful discussion concerning pattern recognition issues. References, “Cancer facts and figures 2014,”
((2014)) http://www.cancer.org/acs/groups/content/@research/documents/webcontent/acspc-042151.pdf Google Scholar
, “Cancer facts and figures 2013,”
((2013)) http://www.cancer.org/acs/groups/content/@epidemiologysurveilance/documents/document/acspc-036845.pdf Google Scholar
M. S. Cappell,
“From colonic polyps to colon cancer: pathophysiology, clinical presentation, screening and colonoscopic therapy,”
Minerva Gastroenterol. Dietolo., 53
(4), 351
–373
(2007). MGADEJ Google Scholar
R. G. Beets-Tan and G. L. Beets,
“Rectal cancer: review with emphasis on MR imaging,”
Radiology, 232
(2), 335
–346
(2004). http://dx.doi.org/10.1148/radiol.2322021326 RADLAX 0033-8419 Google Scholar
Y. B. Chen et al.,
“Correlation of tumor microvessel density to metastasis and recurrence of rectal cancer,”
Chin. J. Cancer, 23
(10), 1203
–1206
(2004). Google Scholar
S. Manfredi et al.,
“Population-based study of factors influencing occurrence and prognosis of local recurrence after surgery for rectal cancer,”
Br. J. Surg., 88
(9), 1221
–1227
(2001). http://dx.doi.org/10.1046/j.0007-1323.2001.01861.x Google Scholar
L. Stocchi et al.,
“Impact of surgical and pathologic variables in rectal cancer: a United States community and cooperative group report,”
J. Clin. Oncol., 19
(18), 3895
–3902
(2001). Google Scholar
A. Wibe et al.,
“Effect of hospital caseload on long-term outcome after standardization of rectal cancer surgery at a national level,”
Br. J. Surg., 92
(2), 217
–224
(2005). http://dx.doi.org/10.1002/bjs.4821 Google Scholar
I. J. Adam et al.,
“Role of circumferential margin involvement in the local recurrence of rectal cancer,”
Lancet, 344
(8924), 707
–711
(1994). http://dx.doi.org/10.1016/S0140-6736(94)92206-3 LANCAO 0140-6736 Google Scholar
P. Quirke et al.,
“Local recurrence of rectal adenocarcinoma due to inadequate surgical resection. Histopathological study of lateral tumour spread and surgical excision,”
Lancet, 328
(8514), 996
–999
(1986). http://dx.doi.org/10.1016/S0140-6736(86)92612-7 LANCAO 0140-6736 Google Scholar
, “Cancer facts and figures,”
(2009) http://www.cancer.org/research/cancerfactsstatistics/cancerfactsfigures2009/index Google Scholar
H. Mantsch and D. Chapman, Infrared Spectroscopy of Biomolecules, Wiley-Liss, New York
(1996). Google Scholar
A. Zwielly et al.,
“Advanced statistical techniques applied to comprehensive FTIR spectra on human colonic tissues,”
Med. Phys., 37
(3), 1047
–1055
(2010). http://dx.doi.org/10.1118/1.3298013 MPHYA6 0094-2405 Google Scholar
M. M. Mariani et al.,
“Micro-Raman detection of nuclear membrane lipid fluctuations in senescent epithelial breast cancer cells,”
Anal. Chem., 82
(10), 4259
–4263
(2010). http://dx.doi.org/10.1021/ac1006987 ANCHAM 0003-2700 Google Scholar
G. I. Zonios et al.,
“Morphological model of human colon tissue fluorescence,”
IEEE Trans. Biomed. Eng., 43
(2), 113
–122
(1996). http://dx.doi.org/10.1109/10.481980 Google Scholar
I. Georgakoudi et al.,
“NAD(P)H and collagen as in vivo quantitative fluorescent biomarkers of epithelial precancerous changes,”
Cancer Res., 62
(3), 682
–687
(2002). CNREA8 0008-5472 Google Scholar
L. Chiriboga, H. Yee and M. Diem,
“Infrared spectroscopy of human cells and tissue. Part VI: a comparative study of histopathology and infrared microspectroscopy of normal, cirrhotic, and cancerous liver tissue,”
Appl. Spectrosc., 54
(1), 1
–8
(2000). http://dx.doi.org/10.1366/0003702001948204 APSPA4 0003-7028 Google Scholar
S. Argov et al.,
“Diagnostic potential of Fourier-transform infrared microspectroscopy and advanced computational methods in colon cancer patients,”
J. Biomed. Opt., 7
(2), 248
–254
(2002). http://dx.doi.org/10.1117/1.1463051 JBOPFO 1083-3668 Google Scholar
A. Salman et al.,
“FT-IR microscopic characterization of normal and malignant human colonic tissues,”
Cell. Mol. Biol., 47 159
–166
(2001). CMBID4 0145-5680 Google Scholar
E. Bogomolny et al.,
“Early spectral changes of cellular malignant transformation using Fourier transform infrared microspectroscopy,”
J. Biomed. Opt., 12
(2), 024003
(2007). http://dx.doi.org/10.1117/1.2717186 JBOPFO 1083-3668 Google Scholar
A. Salman et al.,
“Probing cell proliferation in the human colon using vibrational spectroscopy: a novel use of FTIR-microspectroscopy,”
Vib. Spectrosc., 34
(2), 301
–308
(2004). http://dx.doi.org/10.1016/j.vibspec.2004.01.009 VISPEK 0924-2031 Google Scholar
L. Chiriboga et al.,
“Infrared spectroscopy of human tissue. II. A comparative study of spectra of biopsies of cervical squamous epithelium and of exfoliated cervical cells,”
Biospectroscopy, 4
(1), 55
–59
(1998). http://dx.doi.org/10.1002/(SICI)1520-6343(1998)4:1<55::AID-BSPY6>3.0.CO;2-R BIOSFS 1075-4261 Google Scholar
R. K. Sahu et al.,
“Prediction potential of IR-micro spectroscopy for colon cancer relapse,”
Analyst, 135
(3), 538
–544
(2010). http://dx.doi.org/10.1039/b920926n ANALAO 0003-2654 Google Scholar
J. M. Keller et al.,
“Peroxisome through cell differentiation and neoplasia,”
Biol. Eur. Cell Biol. Organ., 77
(1), 77
–88
(1993). http://dx.doi.org/10.1016/S0248-4900(05)80177-7 Google Scholar
D. Naumann,
“FT-Infrared and FT-Raman spectroscopy in biomedical research,”
Infrared and Raman Spectroscopy of Biological Materials, 323
–377 Marcel Dekker, Inc, New York
(2000). Google Scholar
G. L. Eastwood,
“Gastrointestinal epithelial renewal,”
Gastroenterology, 72
(5 Pt 1), 962
–975
(1977). GASTAB 0016-5085 Google Scholar
M. J. Wargovich et al.,
“Aberrant crypts as a biomarker for colon cancer: evaluation of potential chemopreventive agents in the rat,”
Cancer Epidemiol. Biomarkers Prev., 5
(5), 355
–360
(1996). Google Scholar
E. E. Deschner,
“Cell proliferation as a biological marker in human colorectal neo plasia,”
Colorectal Cancer: Prevention, Epidemiology, and Screening, 13
–142 Raven Press, New York
(1980). Google Scholar
R. K. Sahu et al.,
“Detection of abnormal proliferation in histologically ‘normal’ colonic biopsies using FTIR-microspectroscopy,”
Scand. J. Gastroenterol., 39
(6), 557
–566
(2004). http://dx.doi.org/10.1080/00365520410004695 SJGRA4 0036-5521 Google Scholar
A. Salman et al.,
“FTIR spectroscopic method for detection of cells infected with herpes viruses,”
Biopolymers, 67
(6), 406
–412
(2002). http://dx.doi.org/10.1002/bip.10171 BIPMAA 0006-3525 Google Scholar
E. Bogomolny et al.,
“Early detection of premalignant changes in cell cultures using light-induced fluorescence spectroscopy,”
Eur. Biophys. J., 38
(7), 971
–980
(2009). http://dx.doi.org/10.1007/s00249-009-0488-z Google Scholar
R. K. Sahu et al.,
“Can Fourier transform infrared spectroscopy at higher wavenumbers (mid IR) shed light on biomarkers for carcinogenesis in tissues?,”
J. Biomed. Opt., 10
(5), 054017
(2005). http://dx.doi.org/10.1117/1.2080368 JBOPFO 1083-3668 Google Scholar
A. Salman et al.,
“Probing cell proliferation in the human colon using vibrational spectroscopy: a novel use of FTIR-microspectroscopy,”
Vib. Spectrosc., 34
(2), 301
–308
(2004). http://dx.doi.org/10.1016/j.vibspec.2004.01.009 VISPEK 0924-2031 Google Scholar
D. F. Griffiths et al.,
“Demonstration of somatic mutation and colonic crypt clonality by X-linked enzyme histochemistry,”
Nature, 333
(6172), 461
–463
(1988). http://dx.doi.org/10.1038/333461a0 Google Scholar
T. Enomoto, M. Kuranami and A. Kakita,
“Variations in the expression of platelet-derived endothelial cell growth factor in human colorectal polyps,”
Surg. Today, 30
(8), 711
–717
(2000). http://dx.doi.org/10.1007/s005950070082 SUTOE5 1436-2813 Google Scholar
A. Salman et al.,
“Detection and identification of cancerous murine fibroblasts, transformed by murine sarcoma virus in culture, using Raman spectroscopy and advanced statistical methods,”
BBA, 1830
(3), 2720
–2727
(2013). http://dx.doi.org/10.1016/j.bbagen.2012.11.023 Google Scholar
A. Salman et al.,
“Identification of fungal phytopathogens using Fourier transform infrared-attenuated total reflection spectroscopy and advanced statistical methods,”
J. Biomed. Opt., 17
(1), 017002
(2012). http://dx.doi.org/10.1117/1.JBO.17.1.017002 JBOPFO 1083-3668 Google Scholar
A. Salman et al.,
“Utilizing FTIR-ATR spectroscopy for classification and relative spectral similarity evaluation of different Colletotrichum coccodes isolates,”
Analyst, 137
(15), 3558
–3564
(2012). http://dx.doi.org/10.1039/c2an35233h ANALAO 0003-2654 Google Scholar
A. Pomerantz et al.,
“Characterization of Phytophthora infestans resistance to mefenoxam using FTIR spectroscopy,”
J. Photochem. Photobiol. B Biol., 141C 308
–314
(2014). Google Scholar
A. Salman et al.,
“Classification of Colletotrichum coccodes isolates into vegetative compatibility groups using infrared attenuated total reflectance spectroscopy and multivariate analysis,”
Methods, 68
(2), 325
–330
(2014). http://dx.doi.org/10.1016/j.ymeth.2014.02.021 MTHDE9 1046-2023 Google Scholar
A. Salman et al.,
“Characterization and detection of vero cells infected with herpes simplex virus type 1 using Raman spectroscopy and advanced statistical methods,”
Methods, 68
(2), 364
–370
(2014). http://dx.doi.org/10.1016/j.ymeth.2014.02.022 MTHDE9 1046-2023 Google Scholar
R. A. Fisher,
“The use of multiple measurements in taxonomic problems,”
Ann. Eugen., 7
(2), 179
–188
(1936). http://dx.doi.org/10.1111/j.1469-1809.1936.tb02137.x Google Scholar
Z. Movasaghi, S. Rehman and D. I. ur Rehman,
“Fourier transform infrared (FTIR) spectroscopy of biological tissues,”
Appl. Spectrosc. Rev., 43
(2), 134
–179
(2008). http://dx.doi.org/10.1080/05704920701829043 APSRBB 0570-4928 Google Scholar
R. K. Dukor,
“Vibrational spectroscopy in the detection of cancer,”
Handbook of Vibrational Spectroscopy, John Wiley & Sons, Ltd., (2006). Google Scholar
G. Kos et al.,
“A comparative study of mid-infrared diffuse reflection (DR) and attenuated total reflection (ATR) spectroscopy for the detection of fungal infection on RWA2-corn,”
Anal. Bioanal. Chem., 378
(1), 159
–166
(2004). http://dx.doi.org/10.1007/s00216-003-2245-y ABCNBP 1618-2642 Google Scholar
N. Stone et al.,
“Raman spectroscopy for identification of epithelial cancers,”
Faraday Discuss., 126 141
–157
(2004). http://dx.doi.org/10.1039/b304992b FDISE6 1359-6640 Google Scholar
E. O. Faolain et al.,
“Raman spectroscopic evaluation of efficacy of current paraffin wax section dewaxing agents,”
J. Histochem. Cytochem., 53
(1), 121
–129
(2005). http://dx.doi.org/10.1369/jhc.4A6536.2005 Google Scholar
D. Naumann,
“Infrared and NIR Raman spectroscopy in medical microbiology,”
Proc. SPIE, 245
–257
(1998). http://dx.doi.org/10.1117/12.306089 Google Scholar
P. G. Andrus and R. D. Strickland,
“Cancer grading by Fourier transform infrared spectroscopy,”
Biospectroscopy, 4
(1), 37
–46
(1998). http://dx.doi.org/10.1002/(SICI)1520-6343(1998)4:1<37::AID-BSPY4>3.0.CO;2-P BIOSFS 1075-4261 Google Scholar
T. C. Ko, W. A. Bresnahan and E. A. Thompson,
“Intestinal cell cycle regulation,”
Prog. Cell Cycle Res., 3 43
–52
(1997). Google Scholar
C. S. Potten and M. Loeffler,
“A comprehensive model of the crypts of the small intestine of the mouse provides insight into the mechanisms of cell migration and the proliferation hierarchy,”
J. Theor. Biol., 127
(4), 381
–391
(1987). http://dx.doi.org/10.1016/S0022-5193(87)80136-4 JTBIAP 0022-5193 Google Scholar
L. Roncucci et al.,
“Aberrant crypt foci in colorectal carcinogenesis. Cell and crypt dynamics,”
Cell Proliferation, 33
(1), 1
–18
(2000). http://dx.doi.org/10.1046/j.1365-2184.2000.00159.x CPROEM 1365-2184 Google Scholar
M. Lipkin,
“Proliferation and differentiation of normal and diseased gastrointestinal cells,”
Physiology of the Gastrointestinal Tract, 255
–284 2nd ed.Raven Press, New York
(1987). Google Scholar
I. Lapidot and J.-F. Bonastre,
“Optimizing feature representation for speaker diarization using PCA and LDA,”
in Speech Processing Conf.,
(2012). Google Scholar
T. Evgeniou, M. Pontil and A. Elisseeff,
“Leave one out error, stability, and generalization of voting combinations of classifiers,”
Mach. Learn., 55
(1), 71
–97
(2004). http://dx.doi.org/10.1023/B:MACH.0000019805.88351.60 MALEEZ 0885-6125 Google Scholar
A. Elisseeff and M. Pontil,
“Leave-one-out error and stability of learning algorithms with applications,”
Learning Theory and Practice, IOS Press(2002). Google Scholar
BiographyAhmad Salman is a senior lecturer of physics in the Department of Physics, Shamoon College of Engineering, Israel. He received his PhD from Ben-Gurion University, Beer-Sheva, Israel. His research interests include vibrational spectroscopy (Raman and FTIR), and optical diagnostics. He has published many journal papers on biomedical optics. Gilbert Sebbag received his medical graduation from Faculte de Medecine Rangueil, Toulouse III, France, and his Israel Surgery Board Certification. He received his master’s degree in health administration from Ben Gurion University, Beer Sheva. He is the chairman of Surgery B Department, Soroka Medical Center, and a senior lecturer in surgical oncology in the Faculty of Health Sciences, Ben Gurion University, Beer Sheva, Israel. Shaul Mordechai is a professor of physics and the head of the Biomedical Spectroscopy Laboratory at the Department of Physics, Ben Gurion University, Israel. He received his PhD from the Racah Institute of Physics, Hebrew University, Jerusalem. His research interests include medical physics, biomedical optics, FTIR-microscopy, FTIR-imaging, mid-IR spectrometry, fluorescence spectroscopy, and optical diagnostics. He has published numerous journal papers and book chapters in biomedical optics and collaborated with scientists from universities and national laboratories. Ranjit K. Sahu is an adjunct professor at CUTM Paralakhemundi India. He received his PhD from Central Food Technological Research Institute, Mysore, India. He was a postdoctoral fellow at Ben Gurion University Israel and continues to contribute to the field biomedical optics (infrared spectroscopy). |
||||||||||||||||||||||||||||||||||||||||||||||||||||||||||||||||||||||||||||||||||||||||||||||||||||||||||||||||||||||||||||||||||||||||||||||||||||||||||||||||||||||||||||||||||||||||||||||||||||||||||||||||||||||||||||||||||||||||||||||||||||||||||||||||||||||||||||


