
|
|
1.IntroductionNeutrophils are the most common type of white blood cell in the body and are the first responders of the immune system.1 The total number of neutrophils in the body is an important clinical diagnostic for surveying the health of the immune and hematologic system. When the count is too low, the patient has neutropenia which is associated with a higher risk of infection. When the count is too high, the patient is in the process of responding to an infection and has released young neutrophils into the circulation.2 Because these two outcomes are coupled, the total neutrophil count does not always accurately represent the current state of the immune system. Instead of the total neutrophil number, it would be extremely valuable to quantify the neutrophil age distribution. The age distribution would yield information on the number of young neutrophils that were recently released into the blood stream and possibly how long these cells remained in circulation before they leave through extravasation to fight infection. Using measurements of cellular and nuclear physical dimensions, we hope to obtain a better understanding of the neutrophil age distribution in order to construct a better predictive diagnostic for the early indication of infection. Neutrophils are produced in the bone marrow, where they progress through the stages of granulopoeisis, from myeloblast, to metamyelocyte, to band cell and finally, to a segmented or mature cell. The last three stages can be found in circulation. It has previously been observed that their average volume decreases as they progress through their life cycle, from 465 fL for metamyelocytes, 415 fL for band cells, and finally to 364 fL for segmented cells.3 It is also suspected that a neutrophil’s nuclear morphology becomes more complex or “segmented” as it progresses through its life cycle. Myeloblasts have classical ellipsoidal nuclei similar to other cell types, but metamyelocytes begin to develop distinct nuclei that have an indentation or are “lima bean” shaped. Band cells have further distorted nuclei that have a “horseshoe” shape and segmented cells have nuclei with multiple lobes and narrow necks connecting them. It has long been recognized that counting young or band neutrophils could be useful as a simple diagnostic of infection and pathologists often perform a “band count” by manual inspection of neutrophils that have their nuclei stained. Unfortunately, the result of this manual count is extremely variable and has questionable reliability.2 Using a high-throughput imaging flow cytometer, we are investigating whether the band count can have greater utility using a much larger collection of cells than is possible with manual inspection. In addition, automated machine vision algorithms can take out much of the variability that is caused by different outcomes from different pathologists. In this paper, we correlate nuclear morphology to cell volume. We also investigate cell dry mass density as a new metric of cell age. Cell density has previously been proposed as an indicator of red blood cell age, but this conclusion is also controversial. Cells often increase their density while they undergo apoptosis, which is the final stage of their life cycle.4 To the best of our knowledge, the density distribution of neutrophils has never been measured and while the volume distribution has been measured with electrical impedance methods, it has not been correlated to other cell geometric parameters. 2.Methodology2.1.Volume, Density, and ScatteringSeveral optical techniques have been developed recently to quantify cell volume. While flow cytometry is the current gold standard optical technique for high-throughput cell measurements, it has difficulty accurately quantifying cell volume.5 The forward scattering channel in a flow cytometer is often used as a proxy for cell volume, but cells that have nonspherical shapes and variable refractive indices make this measurement not quantitative. Recent advances in quantitative phase imaging have demonstrated that the optical path length of cells with arbitrary shapes can be measured with extremely high resolution.6,7 These microscopes, however, only yield optical path length, and in order to get a quantitative volume estimation, the refractive index distribution of a cell must be known. Surprisingly, even cells of identical cell type and existing in identical chemical and mechanical environments can have remarkably variable densities and consequently refractive indices. The result is that by assuming cells have a uniform refractive index, much of the variability that differentiates themselves from their average values is ignored. Recently, we developed an optical technique that quantifies cell volume that is nearly independent of the cell’s optical properties.8,9 It borrows the operating principal of the electrical coulter counter and translates it into the optical regime. Cells are suspended in a buffer that contains an absorbing dye and imaged as they flow through a microfluidic channel in a simple widefield microscope in transmission. If the absorbing dye is impermeable to the cell membrane, the cell displaces a number of dye molecules that is proportional to the cell volume. Figure 1(a) shows an optical schematic of the experimental setup. The cells are illuminated with three LEDs that emit light that has a wavelength of 625, 530, and 455 nm and are imaged onto a color CCD camera using a LU Plan Nikon objective lens. Images at each color are transformed into transmission functions (, , ) by dividing an image when the cell is inside the field of view by an image when the field of view is empty. The microfluidic channel has a thickness of and contains of acid blue (AB9) absorbing dye to produce an extinction coefficient () of for 625 nm light. The absorption at 530 and 455 nm is negligible. White blood cells are enriched from whole blood by first lysing and removing the red blood cells and blood plasma. The white blood cells are then suspended in an isotonic buffer containing the AB9 and of bovine serum albumin (BSA), giving the buffer a refractive index of 1.4. The BSA is used to reduce scattering which adds artifacts to the dye exclusion measurement and to match the buoyancy of the white blood cells which makes loading them into the microfluidic channels easier. While the BSA solution removes much of the scattering due to lowering the refractive index contrast, the cells still scatter light out of the collection aperture of the microscope. Because the dye exclusion measurement uses light attenuation to quantify volume, we correct for scattering loss by imaging at a second wavelength (455 nm), as has been previously described.8 We use the blue channel to correct for scattering in the red channel because the LU Plan objective lens has a similar focal length at both 455 and 625 nm, but has some focal shift at 530 nm. The height map () is calculated using Fig. 1Optofluidic system and design. (a) A schematic of the optofluidic system for cell volume, scattering strength, and density characterization. The system is a transmission microscope using three LEDs and a color camera for image acquisition. Cells are driven through a microfluidic channel using a syringe pump and are acquired in a single camera exposure. (b)–(d) Images of a representative cell in blue, green and red. (e) A height map of the cell calculated using dye exclusion. (f) A mass map of the cell calculated using the transport of intensity equation phase imaging method. 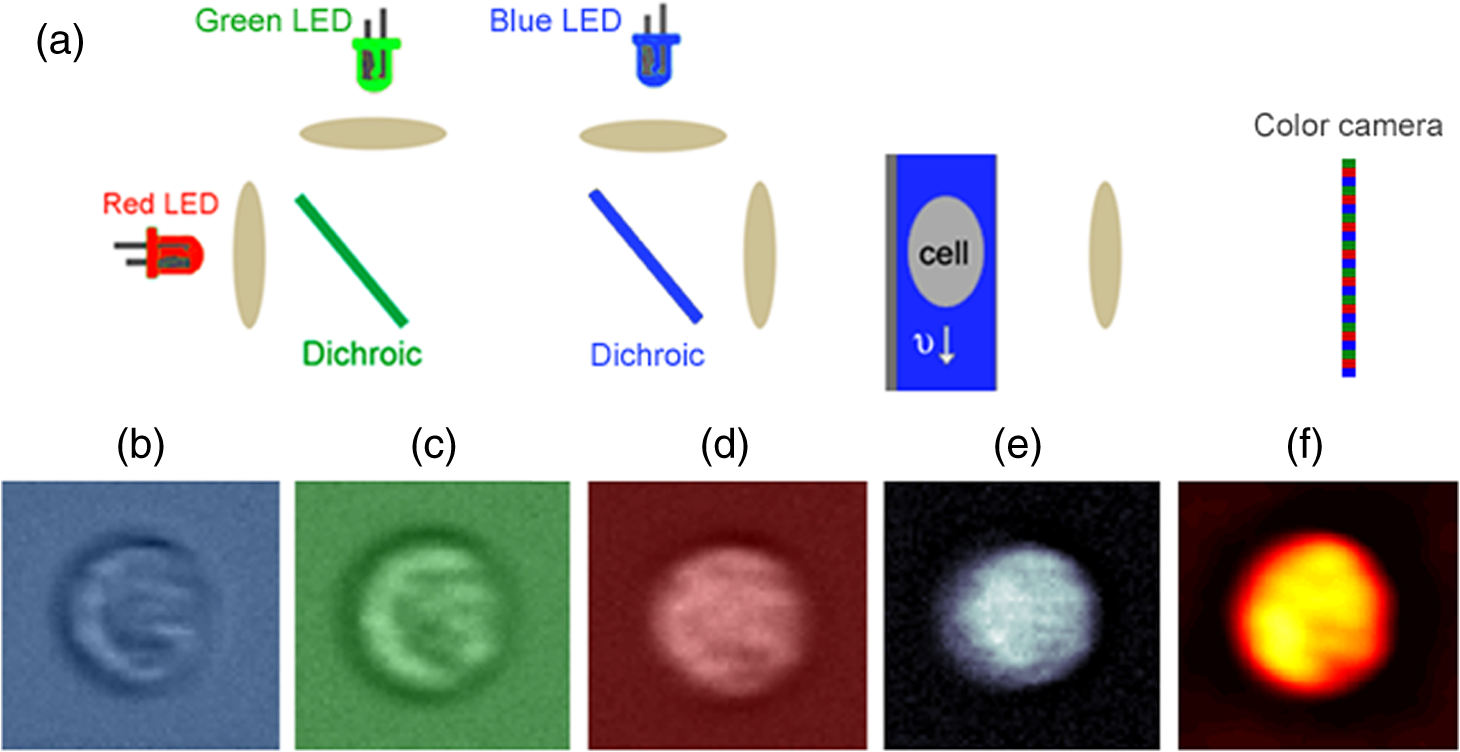 Images of an example white blood cell for blue, green, and red illumination are shown in Figs. 1(b)–1(d). The height map for this cell is shown in Fig. 1(e) as calculated by dye exclusion. While the blue and red image pair can be used for calculating the height map, the blue and green image pair can be used to calculate a dry mass map of the cell using the transport-of-intensity equation phase imaging method. Chromatic aberration and a color camera provide a method to acquire focus shifted images in a single exposure,10 which is critical for imaging cells in motion.11 Figure 1(f) shows the retrieved mass map calculated by the blue and green image pair. By integrating the height and mass map over the cell area, we then retrieve the total cell volume () and cell mass (), respectively. Finally, we can evaluate the scattering amplitude of each cell by integrating the transmission values over the cell area of just the blue image. We define a scattering strength (SS) by normalizing the scattering amplitude by the cell volume, defined as 2.2.Volume and Nuclear MorphologyHistorically, nuclear morphology has been the primary method to quantify the age of a neutrophil. Clinically, this is done with histological stains and manual observation by a trained pathologist. Recently, the Amnis imaging flow cytometer was used in conjunction with a nuclear fluorescence stain in an effort to speed up the process and produce a larger data set. In this paper, we have stained white blood cells with Syto16 which is a nucleic acid stain that primarily localizes to the cell nucleus. This stain emits in the green, so we have modified the schematic shown in Fig. 1(a) to illuminate cells in epifluorescence mode with a 488-nm wavelength laser and use just the red LED to quantify cell volume. Because we no longer have the image using the blue LED, we do not correct for scattering, so our volume estimates are reduced and are now just relative. In a single exposure, we capture images in the red and use them for volume estimation and capture images in the green to quantify nuclear morphology. The shape of the nucleus is analyzed using the machine vision toolbox in MATLAB®, where we primarily analyze the perimeter and area. Because of the occasional difficulty of segmenting the lobular structure of neutrophil nuclei, we discard any image of a cell that has multiple nonconnected elements. 3.Results3.1.Three-Part White Blood Cell DifferentialThere are three basic types of white blood cells, granulocytes, monocytes, and lymphocytes. These three can be differentiated without staining using the forward and side scatter ports of a flow cytometer. Instead of side and forward scatters, we can assemble a scatter plot of SS and cell volume, as shown in Fig. 2(a). As can be seen in the figure, there are three subpopulations representing the three basic types, lymphocytes (L), monocytes (M), and granulocytes (N). There are actually three different types of granulocytes, but by far the most common are the neutrophils, so we ignore the other two. Both monocytes and lymphocytes have a small SS, where neutrophils have high SS. We find that for this sample, neutrophils have a mean volume of 460 fL and a standard deviation () of 57 fL, monocytes have a mean volume of 400 fL and of 43 fL and lymphocytes have a mean volume of 195 fL and a of 33 fL. These values agree reasonably well with the literature for mean values, except that our values for σ are smaller than has been measured for neutrophils using electrical impedance, which could be caused by a greater accuracy of our system compared to other systems. Fig. 2Neutrophil volume and density correlation. (a) A scatter plot of the scattering strength and cell volume, which can be used to do a three part differential of (N) neutrophils, (M) monocytes, and (L) lymphocytes. (b) A scatter plot of cell density and volume for the gated neutrophils. (c)–(f) Height maps (gray) and mass maps (orange) of four representative cells from different regions of the scatter plot.  3.2.Neutrophil Density DistributionQuantifying the correlation between red blood cell volume and cell density has been extremely valuable in clinical hematology and is part of the complete blood count that is universally collected on laboratory blood samples. There is a negative correlation between red cell volume and density9 and it is commonly assumed that young red blood cells have a larger volume and a smaller density than older blood cells. This can be tested by quantifying reticulocyte, young red blood cells, indices. Figure 2(b) shows a scatter plot of volume and density for neutrophils that have been gated from Fig. 2(a). Cell density has been calculated by dividing cell mass, calculated using phase images, by cell volume, calculated using dye exclusion. Interestingly, there is the same negative correlation that is found with red blood cells, where cells with higher volume have smaller density and cells with smaller volume have higher density. Four height and mass maps of representative cells from different regions of the scatter plot are shown next to Fig. 2(b). Similar to red blood cells,9 cell density is regulated much tighter than either cell mass or cell volume. Mass and volume each have a coefficient of variation of approximately 10%, whereas density has a coefficient of variation of only 2%. 3.3.Neutrophil Volume and Nuclear MorphologyThe shape transformation of the nucleus is the most established method to quantify cell age, but has not been correlated to other cellular characteristics. Figures 3(a) and 3(b) show scatter plots of white blood cell volume and nuclear area and circularity, respectively. Circularity is defined as , where a circle has a value of one and other shapes are greater than one. As can be seen in Fig. 3(a), all three cell types have a similar nuclear area, but the larger cell types have a great variability in circularity. Because we don’t have scattering information for these cells, we do not know which of the large volume population are neutrophils and which are monocytes, but we know that monocytes account for only 5% of the total population, so their effect is small. We observe a small positive correlation between cell volume and circularity. The images next to Fig. 2(b) show representative cells from three gated regions of small, medium and large circularity. The average volumes for these three regions are 201, 203 and 206 fL, respectively. Remember that the volumes in this case are only proportional to the actual volumes because we have not performed scattering correction for this set of measurements. The positive correlation is surprising, given that it was expected that young cells have more circular nuclei and were expected to be larger in volume, from the general model of granulopoiesis. It is unclear what the cause of this inconsistency is, but we have found this affect to occur in multiple blood samples and it deserves further study. 4.ConclusionsIn this paper, we have presented a multiparametric study of a neutrophil phenotype in the hope of developing a greater understanding of how the neutrophil phenotype progresses with cell age. We have combined dye exclusion cell volumetric imaging with both quantitative phase imaging to correlate cell volume with cell mass and fluorescence imaging to correlate cell volume with nuclear morphology. We have quantified the relationship between cell volume and cell density in neutrophils for the first time and seen that they have the same trend as has been observed for red blood cells, namely that smaller cells have a higher density. In the correlation between nuclear complexity and cell volume, we find that larger cells have more complex nuclear morphology than smaller cells, which conflicts with a previous expectation. Possibly, cells do not shrink as they age as previously thought or that some subset of the cells becomes activated during measurement and that this activation is dependent on cell age. Neutrophil volume and its standard deviation have previously been shown to be correlated to infection and it would be interesting to study whether or not nuclear shape and cell density reliably predict risk of infection as well. ReferencesA. Mantovani et al.,
“Neutrophils in the activation and regulation of innate and adaptive immunity,”
Nat. Rev. Immunol., 11 519
–531
(2011). http://dx.doi.org/10.1038/nri3024 Google Scholar
P. J. Cornbleet,
“Clinical utility of the band count,”
Clin. Lab. Med., 22
(1), 101
–135
(2002). http://dx.doi.org/10.1016/S0272-2712(03)00069-6 Google Scholar
O. Linerkamp et al.,
“Passive deformability of mature, immature and active neutrophils in healthy and septicemic neonates,”
Pediatr. Res., 44 946
–950
(1998). http://dx.doi.org/10.1203/00006450-199812000-00021 Google Scholar
M. Model and E. Schonbrun,
“Optical determination of intracellular water in apoptotic cells,”
J. Physiol., 591
(23), 5843
–5849
(2013). http://dx.doi.org/10.1113/jphysiol.2013.263228 Google Scholar
A. Tzur et al.,
“Optimizing optical flow cytometry for cell volume-based sorting and analysis,”
PLoS One, 6
(1), e16053
(2011). http://dx.doi.org/10.1371/journal.pone.0016053 POLNCL 1932-6203 Google Scholar
G. Popescu et al.,
“Diffraction phase microscopy for quantifying cell structure and dynamics,”
Opt. Lett., 31
(6), 775
–777
(2006). http://dx.doi.org/10.1364/OL.31.000775 Google Scholar
B. Rappaz et al.,
“Comparative study of human erythrocytes by digital holographic microscopy, confocal microscopy, and impedence volume analyzer,”
Cytom. A, 73 895
–903
(2008). http://dx.doi.org/10.1002/cyto.a.20605 Google Scholar
E. Schonbrun, G. Di Caprio and D. Schaak,
“Dye exclusion microfluidic microscopy,”
Opt. Express, 21
(7), 8793
–8798
(2013). http://dx.doi.org/10.1364/OE.21.008793 Google Scholar
E. Schonbrun et al.,
“Quantitative absorption cytometry for measuring red blood cell hemoglobin mass and volume,”
Cytometry, 85
(4), 332
–338
(2014). http://dx.doi.org/10.1002/cyto.a.22450 CYTODQ 0196-4763 Google Scholar
L. Waller et al.,
“Phase from chromatic aberrations,”
Opt. Express, 18
(22), 22817
–22825
(2010). http://dx.doi.org/10.1364/OE.18.022817 Google Scholar
S. S. Gorhi and E. Schonbrun,
“Phase imaging flow cytometry using a focus-stack collecting microscope,”
Opt. Lett., 37
(4), 707
–709
(2012). http://dx.doi.org/10.1364/OL.37.000707 Google Scholar
BiographyEthan Schonbrun is a Harvard junior fellow and is the principal investigator of the Rowland Institute Optofluidic Cytometry Group. His interests lie in developing optical instrumentation for quantifying properties of individual cells faster and more accurately than currently available methods. He has published 34 papers in peer reviewed journals and is an author of ten patents. Giuseppe Di Caprio received his MS in physics in 2007 and his PhD in 2011, both from the University of Naples Federico II. During his PhD program, he spent a period at the Université Libre de Bruxelles under the supervision of Prof. F. Dubois. He is currently postdoctoral research fellow at the Rowland Institute, Harvard University. His research interests include optical microscopy, imaging flow cytometry, and microfluidic for the development of organ-on-chip. |


