
|
|
1.IntroductionHead and neck cancer accounts for 3 to 5% of all cancers in the United States.1 Despite all the advances in nonsurgical treatments, surgery remains an important tool in the management of these cancers. Primary or salvage surgeries are extensive and often lead to major head and neck defects that require complex reconstructions with local flaps, regional flaps, or free tissue transfer flaps. No widely accepted method of monitoring flap vascularity has been established. When flap ischemia is a concern, most surgeons rely primarily on careful and frequent visual examination of the flap.2,3 Several tools and techniques are currently in use to monitor flaps in order to detect changes in viability in a time frame that allows for salvage of the flap from its nonviable state. While transcutaneous or implantable ultrasound Doppler technologies are commonly used to assess blood flow through large axial vessels, peripheral flap blood flow remains largely subjective in its clinical assessment.4–7 A laser Doppler technique has also been used to monitor blood flow at a tiny spot of superficial tissue,8–10 which may not precisely reflect hemodynamic changes in the bulk flap tissue. Near-infrared (NIR) diffuse optical technologies for the quantification of tissue hemodynamics have gained popularity in recent years owing to the noninvasive, portable, relatively inexpensive, fast, and continuous nature of the measurement.11–15 More importantly, NIR spectroscopy (NIRS) can probe oxygenation changes in deep tissue (millimeters to centimeters below the tissue surface) owing to the low-tissue absorption of light in the NIR range (650 to 950 nm). Another emerging dynamic NIR technique, namely diffuse correlation spectroscopy (DCS), has recently been more developed for direct measurement of blood flow in the microvasculature of deep tissues.16–22 DCS utilizes NIR light to penetrate deep tissue and monitors the speckle fluctuations of the scattered light out of the detected tissue, which are sensitive to the motions of scatterers in the tissue (primarily the red blood cells traveling in tissue microvasculature). NIRS technology has been previously explored for the monitoring of flap oxygenation,23–25 where contact measurements were performed using fiber-optic probes placed on tissue surfaces. Potential problems with contact measurements include the risk for infection and the deformation of vulnerable tissues distorting tissue hemodynamics. We have recently extended the DCS to a noncontact DCS (ncDCS) technique using optical lenses to project sources and detectors onto a tissue region of interest.26,27 This extension enables a fast data acquisition in the recipient site without touching the target tissues. Our previous studies show that the noncontact measurement of tissue blood flow has a high consistency with a contact measurement.26 The aim of this study is to explore the use of ncDCS technology for noninvasive assessment of blood flow in free flaps during and after reconstructive surgery of the head and neck. Our emphasis is on assessing microcirculatory changes that occur during flap elevation and after vessel anastomosis as well as at an early postoperative time-period (one week) following the elevation of the flap reconstruction. 2.Methods and Materials2.1.Noncontact Diffuse Correlation Spectroscopy SystemOur custom-made ncDCS system for the noncontact measurement of tissue blood flow is shown in Fig. 1. A noncontact optical probe is held by a platform connected to a linear motorized stage. A multiple axis stand holder provides free movements to adjust the location and incident angle of the probe. A DCS flowmetry is controlled by a laptop for continuous monitoring of tissue blood flow as soon as the noncontact probe is aligned over the target tissue. The four-channel DCS device consists of a long-coherence-length () NIR laser diode (785 nm, 100 mW, CrystaLaser Inc, California), four single-photon-counting avalanche photodiodes (APDs, Perkin Elmer, Canada), and a four-channel correlator (correlator.com, New Jersey). The ncDCS system is integrated compactly and portably to ensure convenient operation in both operating and patient rooms. Fig. 1(a) The custom-made noncontact diffuse correlation spectroscopy (ncDCS) system including (1) a noncontact optical probe, (2) a linear motorized stage, (3) a multiple-axis stand holder, (4) a laptop control panel, and (5) a DCS flowmetry device and (b) the front view of DCS flowmetry device. 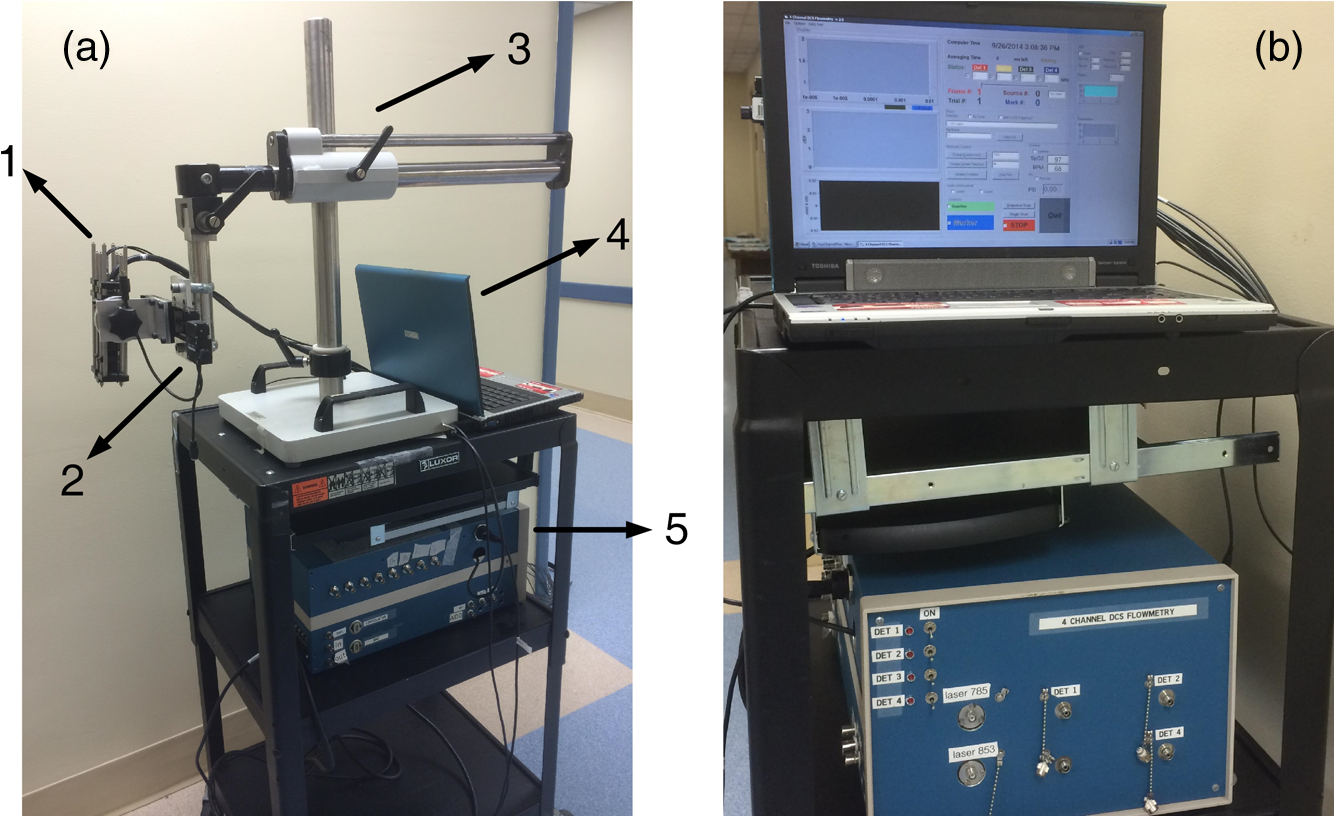 Figure 2(a) shows the details of the noncontact probe structure. The source fiber (WF200/220/245, CeramOptec, Massachusetts) connected to the long-coherence laser is projected onto the tissue surface through achromatic lenses [Fig. 2(b)]. The detector fiber bundle [Fig. 2(a)], including four single-mode fibers (SM800-5.6-125, Fibercore, California), are equally arranged in a 7-mm line to cover a 20-mm range through the magnification of lenses. The source and detector fibers are aligned to focus on the tissue surface. Photons emitted from the laser are injected through the source path into the tissue sample. Only a few photons traveling through the sample can be eventually collected through the detection path by the linear detector array of four APDs. The four source-detector (S–D) distances are set as 10.0, 15.7, 22.8, and 30.0 mm [Fig. 2(b)]. According to the diffuse theory, the photon penetration depth is about half of the S–D distance.28–30 Thus, for the probe structure described above, corresponding light penetration depths range approximately from 5 to 15 mm. The correlator takes the four APD outputs and calculates the light intensity autocorrelation functions, which are used to extract tissue blood flow information. The sampling rate of DCS measurement is 1 Hz. Fig. 2(a) The mechanical configuration and (b) optical paths of ncDCS probe. The source and detector fibers are projected through separated lens paths onto the tissue surface.  Details about DCS theory and data processing have been described in literature.21,22,26,27,31,32 Briefly, light intensity fluctuation with time detected by APD is associated with the motion of red blood cells in tissue microvasculature and can be quantified by the decay of the intensity autocorrelation function calculated by the autocorrelator. From the normalized intensity autocorrelation function, the electric field temporal autocorrelation function is determined, which satisfies the correlation diffusion equation in highly scattering media.16 By fitting the electric field autocorrelation curve to an analytical solution of correlation diffusion equation with a semi-infinite medium geometry, a blood flow index (BFI) is extracted.30 The relative change of blood flow (rBF) can be calculated by normalizing the time-course BFI data to the baseline value taken before physiological changes to be studied. 2.2.Stability Tests for Noncontinuous Flow Measurements by Noncontact Diffuse Correlation SpectroscopyMost previous DCS measurements were based on a continuous manner, either with contact19,22,32–36 or noncontact26,27 probes, to quantify blood flow changes without variation of the DCS device in long period intervals. In this study, however, we intended to measure the same flap at different days with the noncontact probe. In order to investigate ncDCS stability with this noncontinuous measurement protocol, the ncDCS probe was first tested on a homogenous liquid phantom placed in an aquarium. The tissue-like liquid phantom comprised Intralipid (Fresenius Kabi, Sweden), distilled water, and India ink (Black India, Massachusetts) and has been used extensively for DCS calibrations.37 Intralipid particles provide control of scattering ( and Brownian motion (flow) while India ink controls absorption (). We set and . We measured the same liquid phantom once a day over seven days. We also tested the stability of ncDCS measurements on the forearm of a healthy subject in a similar manner. For each measurement in a day, flow data were taken for 2 min from the same location of the phantom/forearm with the same ncDCS probe. The flow values measured over seven days were normalized to the first day, representing flow variations over a week. 2.3.Blood Flow Measurement Protocol of Free Tissue TransferSeven patients with head and neck cancer undergoing free tissue transfer participated in this study as part of their oncologic extirpation and reconstruction procedure at the University of Kentucky hospital. Written consents were obtained from all patients as well as the healthy subject (as a control for the forearm measurement) in accordance with approval by the University of Kentucky’s Institutional Review Board. In total, eight free flaps were elevated on the seven patients. Patient 7 underwent a flap that failed (case 8) and another subsequent successful flap (case 7). Details for patient demographic and reconstruction information are listed in Table 1. Table 1Patient demographic and reconstruction information.
Note: RFFF, radial forearm free flap; ALT, anterior lateral thigh free flap; FFF, fibular free flap. All free flaps were raised in a usual manner.38 After complete elevation of the flap with only the main arterial pedicle and venae comitantes remaining attached to its native blood supply, an optical measurement using the ncDCS probe was performed [Fig. 3(a)]. After this measurement, the arterial pedicle and venae comitantes were ligated. The appropriate free flap was inset to reconstruct the corresponding head and neck defects and the venous and arterial pedicles were anastomosed to recipient vessels from the external carotid system and internal jugular venous system. Each arterial pedicle was anastomosed in an end-to-end configuration using 9-0 nylon sutures. Venous pedicles were attached in either an end-to-end or an end-to-side configuration using venous couplers. Fig. 3The protocol for perioperative blood flow monitoring during free tissue transfer: (a) intraoperative measurement on the elevated flap; (b) intraoperative measurement on the flap after anastomosis through mouth cavity; (c) postoperative measurement on the transferred flap.  Approximately 30 min after anastomosis of these vessels, a second optical measurement was performed at the location of the transferred tissue within the head and neck (oral cavity, orbit, or neopharynx) [Fig. 3(b)]. In addition, multiple optical measurements probing at the same location of the transferred free tissue were performed on postoperative days 2, 4, and 7 in a similar fashion to the intraoperative measurement after anastomosis [Fig. 3(c)]. Figure 3 illustrates the protocol of blood flow measurements performed specifically for the reconstruction of an oral cavity defect (P7). In each setting, optical measurements were taken with the ncDCS optical probe directed toward the cutaneous surface of the reconstructed tissue and were kept at the same working distance and spot throughout the protocol. During intraoperative measurements, we took photos using a camera to record the locations of the ncDCS source. Note that the focused light source point (785 nm) on the tissue surface can be recorded by the camera. For postoperative measurements, we tried our best to align our probe to cover the same region of the flap. DCS data collection time for each measurement was approximately 2 min at a sampling rate of 1 Hz. 2.4.Data AnalysisThe BFI data (2 min) obtained from the four S–D distances of ncDCS during the operation at the intraoperative flap elevation step and on the three postoperative days (i.e., days 2, 4, and 7) were normalized to the averaged BFI baseline values (assigning “1”) taken at after flap anastomosis, yielding rBF. The 2-min rBF data were then averaged to generate mean rBF values at four S–D distances, respectively. Finally, the of the rBF values at four S–D distances were calculated to represent the rBF value and corresponding flow heterogeneity across the measured bulk flap tissue. Statistical tests for averaged rBF differences at different time points were performed using one-way repeated measures ANOVA with main effects of the time period. value was considered significant for statistical results. 3.ResultsFigure 4 shows relatively smaller changes in flow over seven days measured from the liquid phantom [Figs. 4(a)–4(d)] and healthy forearm [Figs. 4(e)–4(h)]. Flow variations over days measured at all S–D pairs were fairly constant, indicating the stability of ncDCS for noncontinuous measurements. By averaging rBF (or relative flow in the phantom) values over the four S–D separations, we found that the largest flow variations were only from the phantom and from the forearm (). Fig. 4The flow variations at the four different S–D separations (10.0, 15.7, 22.8, 30.0 mm) measured by ncDCS on the (a)–(d) liquid phantom and (e)–(h) healthy forearm over seven days. The error bars represent the standard deviations over the 2-min measurements.  By contrast, remarkably larger rBF variations were observed from all patients over the seven days. Figure 5 shows illustrative results measured from one typical successful case (case 1) and the failure case (case 8). Figure 6 shows the average results over the seven successful cases; significant differences were found among the flow responses obtained from the four separations (one-way ANOVA test, ). Although heterogeneous flow responses at different S–D pairs existed due to the tissue heterogeneity at different depths and regions of tissues, the trends of blood flow alterations measured at different S–D separations were fairly consistent in each case (Fig. 5) and over subjects (Fig. 6). Fig. 5The blood flow variations (rBF) measured at (a)–(d) four S–D separations in one successful case (case 1) and (e)–(h) the unsuccessful case during the operation and at postoperative days 2, 4, 7 (data are not available at postoperative day 7 for the unsuccessful case). “E” represents the time point when the flap is raised. Day “0” represents after flap anastomosis, which is used as the baseline for normalization. Error bars represent standard deviations over the 2-min time course data.  Fig. 6Averaged rBF data measured at four S–D separations in all successful cases over seven days. Error bars represent standard errors over subjects.  We then calculated bulk blood flow in the flap by averaging DCS data obtained from the four S–D detectors, which represented the overall flap hemodynamics better than that from a local tissue volume detected by a single S–D pair. Figure 7 shows these results from all eight free flap cases including seven successes (cases 1 to 7) and one failure (case 8). Larger variations in rBF were observed in all patients at all measurement time points. In the group data of successful cases, an initial decrease of the blood flow was observed intraoperatively (from the elevation of free flap to the end of vessel anastomosis), followed by a graduate flow recovery during the following postoperative days. By contrast, rBF changes/recoveries in the unsuccessful flap during and post vessel anastomosis were smaller than all successful flaps. Fig. 7The rBF data measured from all flap cases (cases 1 to 8) including the unsuccessful one (case 8) highlighted with large hexagrams. Note that data from the unsuccessful case (case 8) at day 7 are not available due to the subsequent reflap before that day. The error bars (see Fig. 5) for individual cases are not shown for clarity.  For better comparison, the averaged rBF values over the seven successful flaps as compared to the unsuccessful flap (case 8) are shown in Fig. 8. For the group data of seven successful flaps, average intraoperative rBF at the time of flap elevation was (). Average postoperative rBF on postoperative days 2, 4, and 7 were , , and (), respectively. The rBF variations over all measurement time points were significant (one-way ANOVA test, ). By contrast, rBF values observed from the unsuccessful flaps were 0.82, 1.14, and 1.34, respectively, at the time of flap elevation and on postoperative days 2 and 4, which were apparently lower than the successful cases. Fig. 8The comparison of rBF changes between the successful and unsuccessful flaps. Averaged rBF values over the seven successful cases during operation and on postoperative days 2, 4, 7 are presented as (error bars represent the variations over seven cases). rBF from the unsuccessful flap (case 8) was measured at the time of flap elevation and on postoperative days 2 and 4.  4.Discussion and ConclusionsThis study focused on evaluating the microvascular circulation of free flaps both intraoperatively and postoperatively using a novel ncDCS technique. Due to previous blood flow measurements using DCS or ncDCS performed mostly in a continuous manner,19,22,26,27,32–36 a challenge of this study was the quantitative stability of the noncontinuous measurements over several days. To facilitate a quantitative comparison during perioperative monitoring period (7 days) in the protocol, rBF (or relative flow) in the liquid phantom with a stable flow and in the healthy forearm were monitored by ncDCS once a day over one week. The results demonstrated fairly stable flow values during the noncontinuous measurements (see Fig. 4). The mean flow variations over the four S–D pairs during the measurement period were less than 9% (phantom) and 13% (forearm), respectively. By contrast, the results shown in Figs. 5–8 indicated significantly larger flow variations in the reconstructed flaps over the perioperative measurement period. The perioperative variations of blood flow in the elevated flaps meet the expectation of physiological responses to any surgical insult. There is almost always an initial drop of blood flow after vessel anastomosis as fresh flaps are ischemic.39 The postoperative continuous increase in rBF results from the gradual recovery of tissue injuries associated with the decrease of vascular resistance in those elevated flaps.7 Depending of the degree of ischemia and the amount of time before recovery of blood flow, the flap will either die or recover.39 Interestingly, blood flow in the unsuccessful case did not show either the initial drop of blood flow after vessel anastomosis or the postoperative recovery. Although more cases need to be performed, the observed perioperative differences in blood flow between the unsuccessful and successful flaps (see Figs. 7 and 8) demonstrate the potential of ncDCS measurements to predict early free flap failures. Our results are comparable to data available in literature obtained using other technologies such as laser Doppler8 and ultrasound Doppler.4–6 For example, intraoperative decreases in blood flow after flap anastomosis6,8 and postoperative increases/recoveries in blood flow/velocity4,5,8 were observed, which are similar to our results (see Figs. 6 and 8). A previous case study also reported lower blood flow after anastomosis in an unsuccessful flap.6 In addition, preliminary results from a pilot study showed the potential of blood flow measurements using laser Doppler to predict flap failure before other clinical signs.8 However, in contrast to ultrasound or laser Doppler technology that focuses on evaluating blood flow/velocity in large vessels or superficial tissues, the nature of ncDCS measurement is to quantify blood flow changes in deep tissue microvasculature.20,26 Since appropriate blood flow in tissue microvasculature is the key for the survival of flaps,40,41 ncDCS may become a useful tool with more sensitive measurements than the ultrasound/laser Doppler technology in monitoring tissue flap vascularity. The ncDCS technology is feasible for perioperative measurements of tissue blood flow in all flaps included within this study, despite the anatomical challenges that these flaps present intraoperatively and postoperatively. These findings are encouraging as this technology may offer surgeons the ability to assess tissue blood flow in real time during the surgery, immediately after vessel anastomosis, as well as in the early postoperative period when flap compromise is the highest. A prominent advantage of the ncDCS system is the use of its noncontact probe, which allows measurements to be taken under nonsterile conditions. It also avoids potential distortion in blood flow signals resulting from contact-probe compression on the target tissue. Furthermore, the noncontact probe is able to assess blood flow over the reconstructed tissue without interfering with the sterility of the surgical fields and the surgical setup. Several challenges have arisen in the early implementation and use of this device. The complex anatomical configurations of head and neck reconstructions and patients’ limitations have been successfully addressed. For example, flaps used to reconstruct the oral cavity are difficult to assess fully. Adaptations by measuring through the intact skin and submental tissues up to the reconstruction tissue have shown promise (cases 5 and 7). Practically, tissue blood flow can be assessed approximately up to 15 mm below the skin surface with this current model of the DCS system (i.e., half of the maximum S–D distance of 30 mm). However, tissue congestion and edema may affect light penetration and blood flow measurement, which needs further evaluations using tissue-simulated phantoms.42 In this study, tissue blood flow was measured by ncDCS intraoperatively and postoperatively. During intraoperative measurements, the patient was anesthetized and thus there was no motion artifact in blood flow measurements. During postoperative measurements, the subject was asked to keep still during the short period of measurements (). We did not find obvious motion artifacts in postoperative measurements either. Moreover, we averaged the 2-min data to reduce the variation during measurements. In addition, the potential influence of probing tissue curvature on ncDCS flow measurements has been previously investigated by our group.27 The results revealed that curvature resulted in slight underestimation in BFI, but not in rBF. Blood flow quantification in this study was performed by ncDCS in a longitudinal time frame with limited point measurements (i.e., four S–D pairs). We indeed observed the heterogeneity of blood flow responses at different depths and regions due to the tissue heterogeneity (see Figs. 5 and 6). Ideally, 3-D imaging of flap would provide complete information for predicting the flap viability. However, our ncDCS system has limited numbers of sources and detectors and thus cannot generate a 3-D flow image. Recently, ncDCS has been extended in our laboratory to the noncontact diffuse correlation tomography (ncDCT)42 and speckle contrast diffuse correlation tomography (scDCT).43 Both ncDCT and scDCT have the potential to assess the spatial flow distributions in deep flaps with 3-D tomographic information. In conclusion, we were able to use the ncDCS in multiple and complex head and neck reconstructions with different free tissue transfers. ncDCS is a promising tool that may provide objective information regarding flap viability in real-time intraoperatively and in the early postoperative periods, thus allowing surgeons early identification of those compromised and ischemic flaps with the hope of salvaging them. AcknowledgmentsThe authors acknowledge funding support from the National Institutes of Health (NIH) R01-CA149274 (G.Y.), R21-AR062356 (G.Y.), and UL-1RR033173 Pilot Grant (G.Y.) ReferencesR. I. Haddad, Multidisciplinary Management of Head and Neck Cancer, Demos Medical, New York
(2011). Google Scholar
S. G. Pryor, E. J. Moore and J. L. Kasperbauer,
“Implantable Doppler flow system: experience with 24 microvascular free-flap operations,”
Otolaryngol. Head Neck Surg., 135
(5), 714
–718
(2006). http://dx.doi.org/10.1016/j.otohns.2006.05.006 Google Scholar
Q. Luu and D. G. Farwell,
“Advances in free flap monitoring: have we gone too far?,”
Curr. Opin. Otolaryngo., 17
(4), 267
–269
(2009). http://dx.doi.org/10.1097/MOO.0b013e32832cba6a Google Scholar
A. Ichinose et al.,
“Reestablished circulation after free radial forearm flap transfer,”
J. Reconstr. Microsurg., 20
(3), 207
–213
(2004). http://dx.doi.org/10.1055/s-2004-823108 Google Scholar
M. M. Hanasono et al.,
“Changes in blood velocity following microvascular free tissue transfer,”
J. Reconstr. Microsurg., 25
(7), 417
–424
(2009). http://dx.doi.org/10.1055/s-0029-1223850 Google Scholar
F. Lorenzetti et al.,
“Evaluation of blood flow in free microvascular flaps,”
J. Reconstr. Microsurg., 17
(3), 163
–167
(2001). http://dx.doi.org/10.1055/s-2001-14347 Google Scholar
F. Lorenzetti et al.,
“Postoperative changes in blood flow in free muscle flaps: a prospective study,”
Microsurgery, 19
(4), 196
–199
(1999). http://dx.doi.org/10.1002/(SICI)1098-2752(1999)19:4<196::AID-MICR6>3.0.CO;2-5 Google Scholar
F. Holzle et al.,
“Free flap monitoring using simultaneous non-invasive laser Doppler flowmetry and tissue spectrophotometry,”
J. Cranio-Maxillo-Facial Surg., 34
(1), 25
–33
(2006). http://dx.doi.org/10.1016/j.jcms.2005.07.010 Google Scholar
G. J. Smits, R. J. Roman and J. H. Lombard,
“Evaluation of laser-Doppler flowmetry as a measure of tissue blood flow,”
J. Appl. Physiol., 61
(2), 666
–672
(1986). Google Scholar
A. Kienle,
“Non-invasive determination of muscle blood flow in the extremities from laser Doppler spectra,”
Phys. Med. Biol., 46
(4), 1231
–1244
(2001). http://dx.doi.org/10.1088/0031-9155/46/4/322 Google Scholar
S. Fantini et al.,
“Non-invasive optical monitoring of the newborn piglet brain using continuous-wave and frequency-domain spectroscopy,”
Phys. Med. Biol., 44
(6), 1543
–1563
(1999). http://dx.doi.org/10.1088/0031-9155/44/6/308 Google Scholar
M. A. Franceschini et al.,
“Diffuse optical imaging of the whole head,”
J. Biomed. Opt., 11
(5), 054007
(2006). http://dx.doi.org/10.1117/1.2363365 Google Scholar
U. Sunar et al.,
“Noninvasive diffuse optical measurement of blood flow and blood oxygenation for monitoring radiation therapy in patients with head and neck tumors: a pilot study,”
J. Biomed. Opt., 11
(6), 064021
(2006). http://dx.doi.org/10.1117/1.2397548 Google Scholar
A. Duncan et al.,
“Optical pathlength measurements on adult head, calf and forearm and the head of the newborn-infant using phase-resolved optical spectroscopy,”
Phys. Med. Biol., 40
(2), 295
–304
(1995). http://dx.doi.org/10.1088/0031-9155/40/2/007 Google Scholar
F. H. Tian, B. Chance and H. L. Liu,
“Investigation of the prefrontal cortex in response to duration-variable anagram tasks using functional near-infrared spectroscopy,”
J. Biomed. Opt., 14
(5), 054016
(2009). http://dx.doi.org/10.1117/1.3241984 Google Scholar
D. A. Boas, L. E. Campbell and A. G. Yodh,
“Scattering and imaging with diffusing temporal field correlations,”
Phys. Rev. Lett., 75
(9), 1855
–1858
(1995). http://dx.doi.org/10.1103/PhysRevLett.75.1855 Google Scholar
D. A. Boas and A. G. Yodh,
“Spatially varying dynamical properties of turbid media probed with diffusing temporal light correlation,”
J. Opt. Soc. Am. A, 14
(1), 192
–215
(1997). http://dx.doi.org/10.1364/JOSAA.14.000192 Google Scholar
D. J. Pine et al.,
“Diffusing-wave spectroscopy,”
Phys. Rev. Lett., 60
(12), 1134
–1137
(1988). http://dx.doi.org/10.1103/PhysRevLett.60.1134 Google Scholar
G. Yu et al.,
“Intraoperative evaluation of revascularization effect on ischemic muscle hemodynamics using near-infrared diffuse optical spectroscopies,”
J. Biomed. Opt., 16
(2), 027004
(2011). http://dx.doi.org/10.1117/1.3533320 Google Scholar
G. Yu,
“Diffuse correlation spectroscopy (DCS): a diagnostic tool for assessing tissue blood flow in vascular-related diseases and therapies,”
Curr. Med. Imaging Rev., 8
(3), 194
–210
(2012). http://dx.doi.org/10.2174/157340512803759875 Google Scholar
L. Dong et al.,
“Noninvasive diffuse optical monitoring of head and neck tumor blood flow and oxygenation during radiation delivery,”
Biomed. Opt. Express, 3
(2), 259
–272
(2012). http://dx.doi.org/10.1364/BOE.3.000259 Google Scholar
K. Gurley, Y. Shang and G. Yu,
“Noninvasive optical quantification of absolute blood flow, blood oxygenation, and oxygen consumption rate in exercising skeletal muscle,”
J. Biomed. Opt., 17
(7), 075010
(2012). http://dx.doi.org/10.1117/1.JBO.17.7.075010 Google Scholar
S. Gioux et al.,
“First-in-human pilot study of a spatial frequency domain oxygenation imaging system,”
J. Biomed. Opt., 16
(8), 086015
(2011). http://dx.doi.org/10.1117/1.3614566 Google Scholar
A. Gravvanis et al.,
“Blood perfusion of the free anterolateral thigh perforator flap: its beneficial effect in the reconstruction of infected wounds in the lower extremity,”
World J. Surg., 31
(1), 11
–18
(2007). http://dx.doi.org/10.1007/s00268-006-0298-8 Google Scholar
J. T. Nguyen et al.,
“Face transplant perfusion assessment using near-infrared fluorescence imaging,”
J. Surg. Res., 177
(2), e83
–e88
(2012). http://dx.doi.org/10.1016/j.jss.2012.04.015 Google Scholar
Y. Lin et al.,
“Noncontact diffuse correlation spectroscopy for noninvasive deep tissue blood flow measurement,”
J. Biomed. Opt., 17
(1), 010502
(2012). http://dx.doi.org/10.1117/1.JBO.17.1.010502 Google Scholar
T. Li et al.,
“Simultaneous measurement of deep tissue blood flow and oxygenation using noncontact diffuse correlation spectroscopy flow-oximeter,”
Sci. Rep., 3 1358
(2013). http://dx.doi.org/10.1038/srep01358 Google Scholar
M. C. Van Beekvelt et al.,
“Performance of near-infrared spectroscopy in measuring local O2 consumption and blood flow in skeletal muscle,”
J. Appl. Physiol., 90
(2), 511
–519
(2001). Google Scholar
G. Yu et al.,
“Time-dependent blood flow and oxygenation in human skeletal muscles measured with noninvasive near-infrared diffuse optical spectroscopies,”
J. Biomed. Opt., 10
(2), 024027
(2005). http://dx.doi.org/10.1117/1.1884603 Google Scholar
Y. Shang et al.,
“Effects of muscle fiber motion on diffuse correlation spectroscopy blood flow measurements during exercise,”
Biomed. Opt. Express, 1
(2), 500
–511
(2010). http://dx.doi.org/10.1364/BOE.1.000500 Google Scholar
G. Yu et al.,
“Validation of diffuse correlation spectroscopy for muscle blood flow with concurrent arterial spin labeled perfusion MRI,”
Opt. Express, 15
(3), 1064
–1075
(2007). http://dx.doi.org/10.1364/OE.15.001064 Google Scholar
Y. Shang et al.,
“Portable optical tissue flow oximeter based on diffuse correlation spectroscopy,”
Opt. Lett., 34
(22), 3556
–3558
(2009). http://dx.doi.org/10.1364/OL.34.003556 Google Scholar
Y. Shang et al.,
“Noninvasive evaluation of electrical stimulation impacts on muscle hemodynamics via integrating diffuse optical spectroscopies with muscle stimulator,”
J. Biomed. Opt., 18
(10), 105002
(2013). http://dx.doi.org/10.1117/1.JBO.18.10.105002 Google Scholar
R. Cheng et al.,
“Noninvasive quantification of postocclusive reactive hyperemia in mouse thigh muscle by near-infrared diffuse correlation spectroscopy,”
Appl. Opt., 52
(30), 7324
–7330
(2013). http://dx.doi.org/10.1364/AO.52.007324 Google Scholar
R. Cheng et al.,
“Near-infrared diffuse optical monitoring of cerebral blood flow and oxygenation for the prediction of vasovagal syncope,”
J. Biomed. Opt., 19
(1), 017001
(2014). http://dx.doi.org/10.1117/1.JBO.19.1.017001 Google Scholar
Y. Shang et al.,
“Cerebral monitoring during carotid endarterectomy using near-infrared diffuse optical spectroscopies and electroencephalogram,”
Phys. Med. Biol., 56
(10), 3015
–3032
(2011). http://dx.doi.org/10.1088/0031-9155/56/10/008 Google Scholar
D. Irwin et al.,
“Influences of tissue absorption and scattering on diffuse correlation spectroscopy blood flow measurements,”
Biomed. Opt. Express, 2
(7), 1969
–1985
(2011). http://dx.doi.org/10.1364/BOE.2.001969 Google Scholar
M. L. Urken, Atlas of Regional and Free Flaps for Head and Neck Reconstruction: Flap Harvest and Insetting, 2nd ed.LWW, Riverwoods, IL
(2011). Google Scholar
B. Myers,
“Understanding flap necrosis,”
Plast. Reconstr. Surg., 78
(6), 813
–814
(1986). http://dx.doi.org/10.1097/00006534-198678060-00018 PLATDW Google Scholar
A. Jokuszies et al.,
“Influence of transendothelial mechanisms on microcirculation: consequences for reperfusion injury after free flap transfer. Previous, current, and future aspects,”
J. Reconstr. Microsurg., 22
(7), 513
–518
(2006). http://dx.doi.org/10.1055/s-2006-951316 Google Scholar
A. Gurlek et al.,
“Blood flow and microcirculatory changes in an ischemia-reperfusion injury model: experimental study in the rabbit,”
J. Reconstr. Microsurg., 13
(5), 345
–349
(1997). http://dx.doi.org/10.1055/s-2007-1006414 Google Scholar
Y. Lin et al.,
“Three-dimensional flow contrast imaging of deep tissue using noncontact diffuse correlation tomography,”
Appl. Phys. Lett., 104
(12), 121103
(2014). http://dx.doi.org/10.1063/1.4869469 Google Scholar
C. Huang et al.,
“Speckle contrast diffuse correlation tomography of complex turbid medium flow,”
Med. Phys., 42
(7), 4000
–4006
(2015). http://dx.doi.org/10.1118/1.4922206 Google Scholar
BiographyChong Huang received his PhD in optical engineering in 2011. He is a postdoctoral scholar in the Department of Biomedical Engineering at the University of Kentucky. His current research focuses on development of noncontact diffuse correlation spectroscopy/tomography (ncDCS/ncDCT) for noninvasive assessment of microvasculature blood flow in biological tissues. His specialties include optical/mechanical system design, signal processing, finite element analysis, physiological modeling, data collection, and image reconstruction. Jeffrey P. Radabaugh is currently in his residency training within the Department of Otolaryngology–Head and Neck Surgery at the University of Kentucky. He completed his medical school training at the University of South Carolina and is a reserve officer in the United States Navy. He has special interests in facial plastics and reconstruction especially facial trauma and subdermal perfusion dynamics following tissue transfer. Rony K. Aouad is an assistant professor of the Division of Head and Neck Oncology with the Department of Otolaryngology–Head and Neck Surgery at the University of Kentucky. He completed a rhinology fellowship at Union Memorial in Baltimore and a head and neck oncology/skull base surgery fellowship at the University of California-Davis. He has special interests in resection and reconstruction of the anterior skull base. Yu Lin received his PhD in optical engineering in 2010. He was a postdoctoral scholar in the Department of Biomedical Engineering at the University of Kentucky and is currently working in the College of Textile at NC State University. His research interests include digital color imaging in the textile industry, diffuse correlation spectroscopy/tomography in biological tissues, and multidiscipline applications with optical imaging technologies. Thomas J. Gal is a professor of the Division of Head and Neck Oncology with the Department of Otolaryngology–Head and Neck Surgery at the University of Kentucky. He is board certified by the American Board of Otolaryngology and is a Fellow of the American College of Surgeons with special interests in head and neck cancer epidemiology and flap reconstruction. Amit B. Patel is an assistant professor in the Division of Facial Plastic and Reconstructive Surgery with the Department of Otolaryngology–Head and Neck Surgery at the University of Kentucky. He is board certified by the American Board of Otolaryngology and the American Board of Facial Plastic and Reconstructive Surgery. His clinical interests include nasal and facial reconstruction following cancer resection with academic interests in nasal airway architecture and flow dynamics of the nasal cavity. Joseph Valentino is a chief of the Division of Head and Neck Oncology with the Department of Otolaryngology–Head and Neck Surgery at the University of Kentucky. He is board certified by the American Board of Otolaryngology, National Board of Medical Examiners and is a Fellow of the American College of Surgeons. His academic interests include tumor biomarkers, head and neck oncology outcomes research, and smoking cessation. Yu Shang received his PhD in biomedical engineering in 2008. Currently, he is a research scientist working in the Department of Biomedical Engineering at the University of Kentucky. His current research interests focus on the development of near-infrared diffuse optical spectroscopy (NIRS) and diffuse correlation spectroscopy for noninvasive assessment of microvasculature blood flow/oxygenation/oxygen metabolism in biological tissues. Guoqiang Yu is an associate professor in the Department of Biomedical Engineering at the University of Kentucky. He has over 20-years experience in the field of biomedical engineering and is currently leading a research group to develop various near-infrared diffuse spectroscopy and tomography systems for noninvasive imaging of deep tissue hemodynamics in animals and humans. |


