|
|
1.IntroductionMedical imaging plays a crucial role in tumor blood vessel and cancer diagnosis, treatment and research. There are a number of imaging modalities which can be employed to visualize tissue at cellular and molecular levels including nuclear imaging (positron emission tomography), single photon emission computed tomography, x-ray computed tomography, magnetic resonance imaging, optical imaging, ultrasound imaging (USI), and photoacoustic imaging (PAI). It is well-known that growing cancer cells need an additional blood supply and gradually develop dense microvascular networks inside or around tumors. Angiogenesis appears to be a marker for breast cancer growth and may have clinical implications in diagnosis and treatment.1 The interaction of light and ultrasound (US) with blood plays an important role in diagnostics and therapeutics, for instance, for the noninvasive assessment of blood composition. It is equally important to emphasize that the interaction process and its bioeffects are governed by the biophysical properties of whole blood. The optical properties (absorption and scattering) of biological tissues in the visible (400 to 750 nm) and near-IR (750 to 1300 nm) spectral ranges are fundamentally related to the molecular constituents of tissues and their vibrational/electronic structures. Although optical methods are severely limited by their short penetration depth in tissue, their major benefit is their sensitivity to tissue composition. For example, optical absorption generates endogenous contrast by blood constituents such as deoxyhemoglobin (Hb), oxyhemoglobin (), lipids, water, and intrinsic chromophores with distinct fluorescent properties. It is known that when a laser light interacts with a turbid medium such as biological tissue, photons can be both absorbed and scattered. Some of the scattered photons, which are called “ballistic” photons, travel a straight distance through the medium, while others deviate. It is the ballistic photons which define the degree of resolution, therefore, the higher the degree of scattering or deviation, the more the resolution degrades with depth. In other words, the efficiency of high-coherent resolution medical imaging relies on the degree of detected ballistic photons. US can provide better resolution than optical probes at greater depths, but with much compromised contrast. Thus, the combination of high-optical absorption contrast and high-ultrasonic spatial resolution (low scattering), a feature of biomedical PAI, constitutes a very useful imaging technique. Briefly, the pulsed photoacoustic (PA) effect is based on the absorption of pulsed laser energy by a material creating transient, localized heating. The increase in temperature leads to rapid thermal expansion which, in turn, generates thermoelastic stress waves. In recent years, wide interest has been shown in PA imaging of blood vessels and cancer.2–5 Optical6 and PA spectroscopic studies7,8 of blood containing structures in tissues can measure Hb and concentrations mainly due to the fact that Hb and have different wavelength-dependent optical absorption properties which allow signal differentiation between arteries and veins. Normal whole blood consists of about 55 vol% plasma and 45 vol% cells. A normal red blood cell (RBC) is mainly characterized by a flat bioconcave shape with volume, surface area and diameter ranging from 80 to , 119 to , and 7 to , respectively.9 The RBC membrane contains proteins and glycoproteins embedded in, or attached to, a fluid lipid bilayer that gives it a viscoelastic behavior. RBCs are by far the most dominant absorbing element in blood in the wavelength range between 250 and 1100 nm, mainly due to the presence of hemoglobin, beyond which water becomes the main absorber.10 This difference in light scattering between RBCs and other blood constituents arises from the different refractive indices between RBCs and the surrounding blood plasma.11 Because RBCs are acoustically weak scatterers (impedance contrast between RBCs and plasma is only about 13%),12 multiple scattering can be neglected. Light scattering by a single RBC depends on its disk-type shape, volume, refractive index, and orientation. Blood vessels usually exhibit orders of magnitude larger absorption than surrounding tissues depending on the Vis to NIR range which implies a drastic blood/tissue change. However, there is enough contrast for PAI to visualize blood vessels or abnormal angiogenesis for imaging in vivo subcutaneous vasculature for a variety of applications. The use of a variety of nanostructures in medicine and biomedical engineering has also been growing in recent years. For example, plasmonic nanoparticles exhibit unique optical properties. Specifically, the major advantages due to the photophysical properties of gold nanoparticles are: strong localized surface plasmon resonance (SPR), surface-enhanced scattering, nonlinear optical properties, tunable resonance across the Vis-NIR due to adjustable nanoparticle size and shape,13–16 biocompatibility due to their inert surface, nontoxicity, surface conjugation chemistry, i.e., they can be linked to specific ligands for tumor targeting, imaging and therapies, lack of photobleaching or blinking as with quantum dots, and very low oxidation.17,18 As a result, Au nanoparticles have been extensively used in applications like bioimaging19–24 mainly due to their ability to convert absorbed light into heat (i.e., photothermal efficiency), but also due to their drug delivery properties,25–29 cancer cell diagnostics and therapeutics,30–33 laser tissue welding and soldering.34,35 In this work, we use linear frequency modulation waveforms and cross-correlation processing similar to radar technology [the photoacoustic radar (PAR)] with modulated or coded optical excitation to provide both high-axial resolution and signal-to-noise ratio (SNR) by using a matched filter at the signal processing stage.36 The SNR of frequency domain photoacoustics (FD-PA) can be similar or higher only in very specific cases and that depends on the transducer bandwidth and other technical issues such as maximum available laser power. The main advantages of FD-PA over pulsed-laser excitation besides being compact and less expensive are: its ability to control and manipulate instrumentation system parameters, no jitter noise, low fluence of the frequency-chirped laser modulation, depth profiling over a wide range of frequencies, high-spatial resolution, possible parallel multichannel lock-in-signal processing, and wide signal dynamic range using lock-in filtering and much higher duty cycle () than pulsed-laser PAs ( to ).37 On the other hand, the main advantages of pulsed PAI include higher efficiency of PA signal generation due to high energy per pulse, hence, giving a strong SNR. But there is a trade-off between the amount of pulse energy, pulse repetition frequency and a fast acquisition system. Other advantages include less accumulated thermal effect which may occur with continuous wave (CW) and modulated laser source, providing axial resolution along the ultrasonic propagation direction and a difference in the time of flight of PA waves which reduces signal cluttering.38 Also, in a theoretical study, it was shown that the SNR of PAI systems based on CW lasers with a chirped modulation frequency are about 20 to 30 dB worse than systems based on pulsed lasers.39 However, this was based on the assumptions of a top hat 1 to 5 MHz transducer and a matched filtering in the FD-PA. Following our previous work,40–43 we employ frequency domain PAR (FD-PAR) imaging to extend our investigation to studies of the effects of Au NPs concentration on imaging blood vessels using a chirped diode laser and a US transducer. 2.Theory2.1.Au NP PropertiesThe importance of metallic nanostructures originates in their ability to absorb and scatter the incident light in both the visible and infrared regions. The interaction of an electromagnetic field of a laser with gold nanoparticles causes the dielectric polarization, , of surface charges as a result of which charges oscillates like simple dipole moment nanoparticles where is the angular frequency of light traveling in the -direction and is the wave number. The oscillating dipole radiates electromagnetic waves with a large enhancement of the local electric field at the NP surface and polarization proportional to the incident field. This electric field leads to strong absorption and scattering at the SPR frequency by the particle which consequently damps the oscillations, causing the displacement to become out of phase, , with the varying field and requiring an input of energy to sustain the oscillation. The SPR absorption in Au NPs is followed by energy relaxation through nonradiative decay channels. This results in an increase in kinetic energy, leading to overheating of the local environment around the light-absorbing species. The complex refractive index is defined as According to the principle of causality, the real and imaginary parts of the complex refractive index are connected through Kramers–Kronig relations. The real part, , is the refractive index of blood and the imaginary part, , is the extinction coefficient, is the laser wavelength, and is the absorption coefficient. of the metal (gold) nanoparticle is related to the frequency dependent NP complex dielectric permittivity through where is the real part of the refractive index indicating the phase velocity. Substituting () in the plane wave expression, it gives The real part, , determines the degree to which the metal polarizes in response to an applied external electric field and determines the SPR spectral peak position. The imaginary part, , quantifies the relative phase shift, of the induced polarization with respect to the external field, i.e., it determines the bandwidth and includes losses such as ohmic heat loss. The extinction coefficient is maximum when , where represents the Au particle giving rise to the SPR band.44 According to Mie theory, the absorption cross section, , of a particle embedded in a medium, , is given by15 where is the radius of a gold particle. Similarly the scattering cross section is where is the polarizability of a metallic sphere. The extinction cross section, , of a spherical particle is . The extinction efficiency, , of a particle is the normalized extinction cross section of an area and is the particle absorption efficiencyUsing and yields and . Substituting these values in Eq. (3) yields , which is comparable with the values obtained by Jain et al.45 and Pustovalov et al.24 Furthermore, using and , Eq. (6) yields, . 2.2.Optical and PA Interaction with (B-Au NP) MediumA schematic diagram representing the interaction and propagation of a laser beam and US with a blood-gold (B-Au) NP ensemble is illustrated in Fig. 1, where the direction of the laser beam is perpendicular to the surface of the medium and the US incidence is oblique. It is seen that RBCs can be oriented in random directions with a different number density causing a different amount of backscattering, while agglomeration (e.g., in static mode) can change the spatial configuration of the cells which can also affect optical and US backscattering. Fig. 1Schematic diagram of laser interaction with a (B-Au NPs) tube. The inset shows an example of a PA signal generated by a local B-Au NP volume when crossed by the laser beam. : radius of Au-NP, : radius of irradiated blood element, : height of the container, and US: ultrasound.  When light passes through a suspension of an absorbing medium such as blood, photons that do not encounter RBCs are not absorbed. This is called the “absorption flattening effect.”46 As a consequence, the transmitted light intensity is higher than it would be if all hemoglobin were uniformly dispersed in the solution. When a beam of light interacts with a blood volume element, the first event taking place between the RBC and the surrounding medium (plasma) is Fresnel reflection, , defined by where and are the refractive indices of plasma and RBC, respectively. If represents the cross-sectional area of RBCs per unit volume which, in fact, indicates the geometric attenuation coefficient in the beam direction then this parameter can be resolved into two different components given as an integral over all possible orientations of the RBCs in the blood volume47Here indicates the number of RBCs per unit volume with orientation and corresponds to the cross-sectional area of an RBC with an orientation when exposed to light in the direction. The value of mainly depends on the shape of the cells interacting with light, i.e., the shape or structure factor which quantifies the effect of the spatial random organization of the scatterers on the backscattering coefficient where the scattering vector, . Here, is the acoustic wavenumber, is the acoustic frequency and is the speed of sound in blood.48 The ability of a tissue to generate acoustic echoes is often quantified by the frequency-dependent backscattering coefficient, , which for a heterogeneous material such as blood composed of weakly scattering particles is given as49 where is the backscattering cross-section of a single scatterer. In addition, there is a refractive index mismatch between the cell membrane and the surrounding plasma medium which results in light scattering by RBCs. Also, a RBC is an orientation-dependent structure and the scattering intensity distribution will, therefore, depend on the angle of incidence. For large particle sizes (i.e., where is the radius of the particle, the intensity distribution of light increases in the forward direction and the cosine of the scattering phase function for small angles is much higher than for all other angles. However, the optical mean free path within the medium is limited by the scatterer density, and by the effective scattering cross section, i.e., .The PAR technique involves light that is intensity modulated at high frequencies which, when propagating through a scattering medium, exhibits amplitude and phase variations. However, if the distance between NPs is larger than their size, the NPs act as discrete thermal point sources and the temperature should be a sum over all the sources provided there is no clustering. Then the heat source becomes50 where the coefficients describe the heat produced by the ’th Au NP at location . Assuming, the light absorption dominates the scattering, then the sinusoidally varying irradiance at modulation angular frequency, , which illuminates the cross-sectional area of the sample isThe spectral component at any value of is given by where is the thickness of the B-Au NP container and is depth so that .3.Materials and Methods3.1.PreparationA 25 mL 100-nm diameter gold nanoparticle source with a concentration of stabilized as a suspension in a citrate buffer was purchased from Sigma–Aldrich. Sheep whole blood was kept in a refrigerator before each experiment. Prior to each test, the blood was anticoagulated with ethylene diamine tetraacetic acid (EDTA). Initially, 30 mL of blood were mixed with 3 mL of EDTA (i.e., 10:1) giving a total blood source volume of 33 mL. For a sample labeled S2 (10% ratio of of NPs: blood) was used and for a sample labeled S3 (20%) the amount of NPs was doubled. The number of NPs and the corresponding concentration for S2 using 0.05 mL of Au were calculated as and , respectively. Similarly, for S3 using 0.55 mL of B-Au, the values of and were obtained. A total of four samples were prepared using the aforementioned labeling: S1(blood only), S2 [ Au NPs], S3[blood () Au NPs], S4(Au NPs only). All samples were safely mounted next to each other with a 5-mm separation inside a saline solution container 50 mm below the water surface and were irradiated with laser light in the transverse and longitudinal directions. In the former (latter) case, the direction of scanning was perpendicular (parallel) to the sample surface. 3.2.Experimental SetupAs shown in Fig. 2, the intensity modulated output of a CW 800-nm diode laser (Jenoptik AG, Germany) with a chirp duration, , of 1 ms was used as an excitation source for PA generation at a 1.6-W peak power. The laser driver was controlled by a software function generator to sweep the laser power modulation frequency range between 0.3 and 2.6 MHz. A collimator was used to produce a collimated laser beam with a 2 to 3 mm spot size on the sample. A focused ultrasonic transducer (V382, Olympus NDT Inc., Panametrics) with a FWHM bandwidth of 65% at 3.95 MHz, 12.5 mm diameter, a focal length of 25 mm, and an estimated lateral resolution of 0.87 mm was used for transmitting the US signal. The sensitivity of this transducer was measured to be using a calibrated hydrophone. The back scattered pressure waves were detected by a focused transducer (V305, Olympus NDT Inc., Panametrics) with a FWHM bandwidth of 64.4% at 2.25 MHz, 18.8 mm diameter, a focal length of 25 mm, and a beam width of approximately 0.9 mm. The distance between the samples and the transducer immersed in water was kept at about 25 mm. The setup was designed for a backscattering mode operation and the angle between the laser beam and the center axis of each transducer was about 27 deg. A 3-mm diameter silicone rubber tube was used to simulate a blood vessel in a physiological saline container. The tube was linearly scanned with a 0.5-mm step. The scanned distance was shorter than the tube length. In the NIR () region, blood has an absorption coefficient corresponding to an optical penetration depth of about 1.4 mm. Depending on the type of silicone rubber, the acoustic impedance, , ranges between . Blood has an acoustic impedance of about . Therefore, the amplitude reflection at the tube wall-blood interface varies between 0.1 and 3.4%. Data acquisition and signal processing were performed using Lab View software. Linear frequency modulation and matched filtering were used to generate A-scans with the PAR system. The similarity between two waveforms as a function of delay time is defined by the cross-correlation function where time delay is equivalent to a phase shift in the frequency domain. In our experiments, over 80 detected signals of 16 trains of 1-ms long chirps (i.e., one package consisting of four 1-ms chirps which was repeated four times: ) with a 1-s delay between them were averaged by software processing the collected data at each point, thereby giving a total of 1280 chirps. The chirp bandwidth was adjusted to simultaneously maximize the PAR and US SNRs. 3.3.ResultsThe results are based on the backscattered signals using a volume fraction, , in calculations related to S1 and S2 where and represent the corresponding applied parameters for Au NP and blood, respectively, and and are the corresponding volumes of a gold solution and blood, respectively. The acoustic parameters for all different cases are given in Table 1.Table 1Acoustic characteristics of blood, Au and B-Au NPs [for S2 (10%) and S3 (20%)].
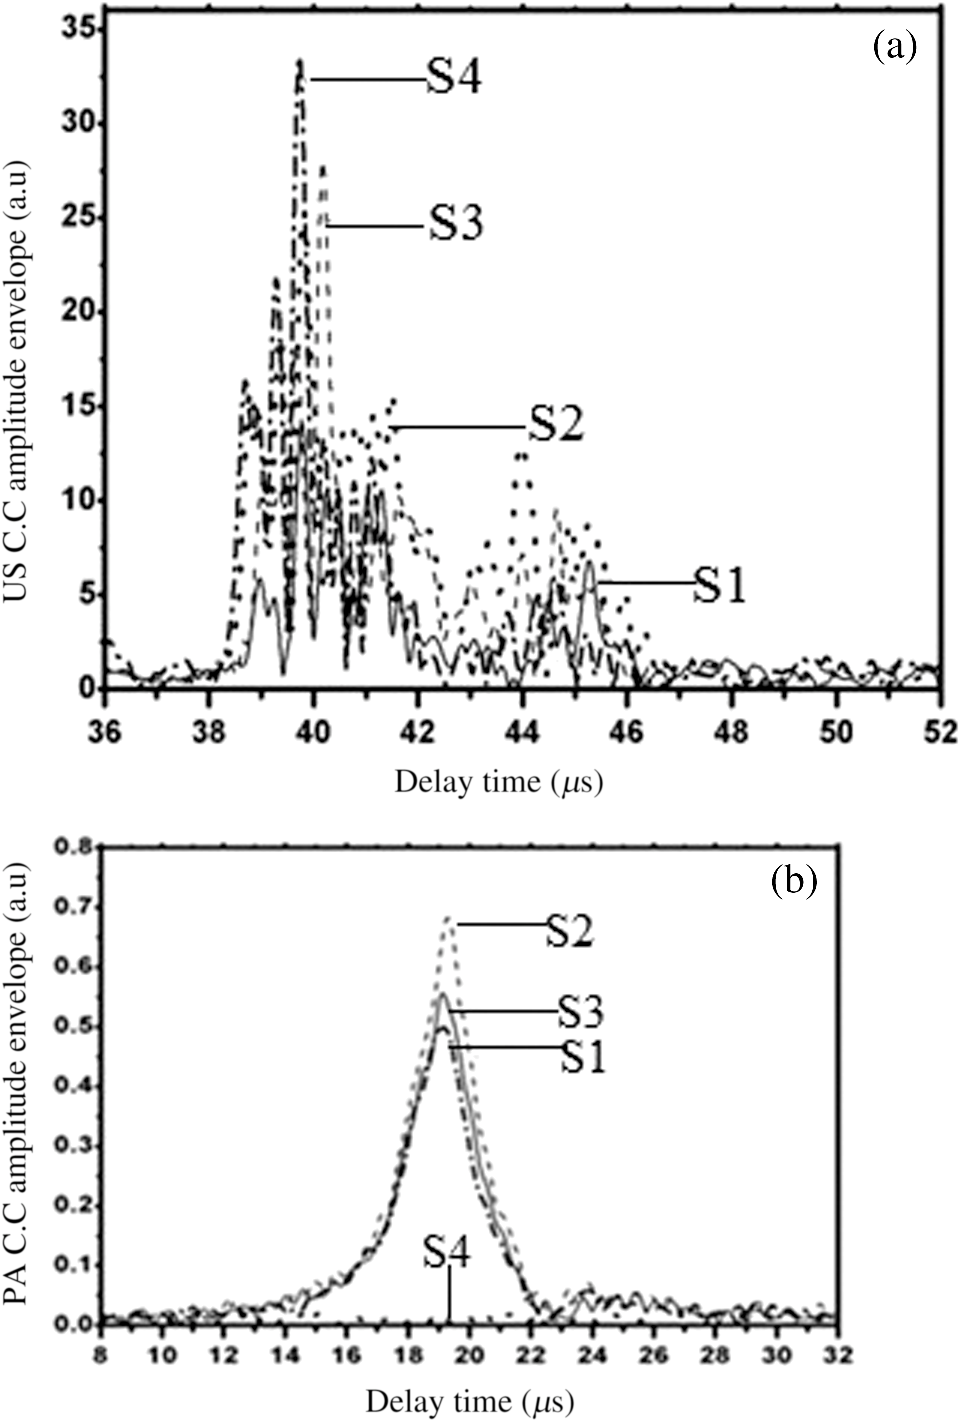
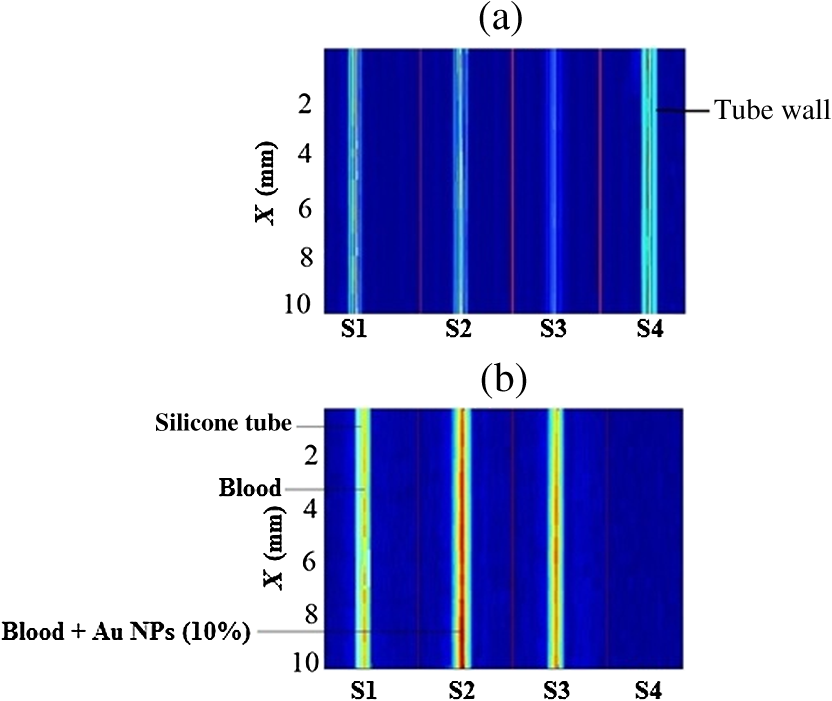
Note: ca, speed of sound and λa, acoustic wavelength, f1 = 300 kHz, f2= 2.66 MHz. An example of a PA pulsed signal (A-line) is shown in the inset of Fig. 1, where the time represents the depth location of NPs. This is an important example because the imaging contrast depends on physical processes such as the scattering mechanism which is also a size-dependent factor, the particle distribution density, orientation, and the shape factor of RBCs as described by Eq. (8). One such situation is the mismatch between the hemoglobin solution inside the cell and the surrounding plasma. Figure 3 indicates the US and PA cross correlations for 10% Au NPs (a) and 20% (b), respectively, generated by a 3.95-MHz transducer. The PA signals are very similar. The oscillations are mainly due to reflections of ultrasonic waves from the walls of the silicone rubber tube and transducer. The cross-correlation peak position on the PA delay time axis is related to the depth of the signal source (e.g., RBC or NPs). Fig. 3Normalized cross-correlation amplitude of US and photoacoustic (PA) for (a) S2 (10%) and (b) S3 (20%).  Figure 4(a) shows the envelope for the US cross correlation where the amplitudes decrease in the order . The area under the curve of each envelope represents the total output energy of the matched filter at constant input energy. The profile amplitude provides a better SNR than the in-phase correlation alone. The noise level is similar in both the in-phase and envelope signals. However, the peak amplitude increases in the envelope signal due to the vectorial summation of the in-phase and quadrature signals. In general, envelope detection is a standard US practice to detect objects or layers and generate an image. Although the US cross correlation produces a better SNR, its absorption is insensitive to material composition, but the degree of reflection depends on the acoustic impedance of the medium. Since S4 contains Au NPs only, it exhibits the highest reflection, in other words, by decreasing the NPs concentration in S3, S2, and S1, blood plays a more effective role in producing the frictional forces which consequently reduce the amplitude of acoustic reflection. On the contrary, the PA correlation amplitudes, Fig. 4(b), decrease in the order . Despite its lower SNR, the PAR response is superior to US due to its specificity, as the results are based on the NP material optical absorption, concentration and also on the blood absorption coefficient. The fact that RBCs are very deformable and their shapes vary in response to thermal and mechanical stresses51 which may damage their membrane may be a reason for . Acoustic attenuation in whole blood can be attributed to a number of different mechanisms: (1) at the cellular level due to the cell membrane separating different intracellular and extracellular fluids; and at the molecular level within the (2) intracellular and (3) extracellular fluids. Molecular level absorption mechanisms include viscosity, thermal relaxation time and structural processes. The longer the relaxation time of a medium, the higher the absorption of US is. Another factor to be considered in US interaction with RBC cells is the attenuation linearity where the scattering component is mainly due to a mismatched acoustic impedance between the encapsulated proteins by RBC membrane and the surrounding fluid. However, according to Zinin52, for suspended erythrocytes the contribution of scattering to attenuation in the frequency range of 0.2 to 10 MHz may be neglected. By far the most dominant contribution of US absorption by biological tissues is due to relaxation processes among potential, chemical and structural forms of energy. There are frequency ranges over which some energy can transform to another state during ultrasonic compression, but with insufficient time for the process to completely reverse itself during rarefaction. Therefore, there will be a net energy transfer and hence absorption. As a result, quantitative US techniques are based on the frequency analysis of backscattered signals by biological tissues. Power spectral density (PSD) is the frequency response of a random or periodic signal indicating the average power distribution as a function of frequency Figure 5(a) shows the corresponding US-PSD for S1 with a peak maximum at about 500 kHz followed by decreasing amplitudes due to higher attenuation in the B-Au NP medium. However, when 10% Au NPs were added (S2), Fig. 5(b), the amplitude increased significantly between 300 and 800 kHz. In addition, an increased distribution between 1.4 and 3.0 MHz was observed, indicating that a possible effect of Au NP agglomeration is the result of modification in the spatial configuration of the cells, producing increased US backscattering. At 20%, Fig. 5(c), the power spectrum amplitude decreased by almost 37% compared with Fig. 5(b) in the same frequency range, leading to a lower SNR and indicating a nonlinear behavior possibly due to additional structural and thermal relaxation processes at the cellular level. Again, there is an increased frequency distribution between 1.5 and 2.5 MHz. This will be discussed in detail in Sec. 4. The US response exhibits more peaks with relatively higher side lobes which may be due to its stronger interaction with the medium followed by more pronounced reflections from the tube walls and the blood. Secondary features like oscillations at higher frequencies are likely due to reflections of signals from particles closer to the surface of the tube. This is because the diffusion length depends on the modulation frequency as , and a higher frequency corresponds to probing the sample closer to the surface. Figures 5(b) and 5(c) clearly show the peaks in the 1.5 to 2.5 MHz range which are not observed in Fig. 5(a) corresponding to blood without Au NPs. Also, high-frequency oscillations can be partly attributed to agglomeration of Au NPs causing these high frequency US oscillations. Fig. 5Variation of power spectral density of US with frequency for (a) S1 (blood only), (b) S2 (10%), and (c) S3 (20%).  Figure 6 shows the corresponding PAR-PSD results for S1(a), S2(b), and S3(c), respectively. Inspection of the spectra of two signals [Figs. 6(b) and 6(c)], shows that the PA signal is dominated by low-frequency components with the amplitudes in the order . In the low-frequency range, the PA response is affected only by the mixture of blood and NPs, so it does not reflect the signature of each individual component. The possible reasons to explain are primarily due to the lower optical absorption saturation of S3 than S1, and second, because of thermal-induced damage which will be discussed in Sec. 4. The higher resolution of the US cross-correlation signals is mainly due to the thermoelastic energy conversion effect of the PA phenomenon which affects the spectrum like a low-pass filter, thereby limiting spatial resolution. Fig. 6Variation of power spectral density of PA with frequency for (a) S1 (blood only), (b) S2 (10%), and (c) S3 (20%).  Furthermore, the PAR-PSD exhibits a nonlinear behavior consistent with the US results which can be related to the thermal effects of Au NPs on the RBC biomechanical properties and structure.53 The main feature in the case of PAR, unlike US, is that there is little frequency content above the main peak frequency and the information is completely concentrated within the 300 to 800 kHz range, particularly for S2, which exhibits the strongest power spectrum. Physically, this implies that light does not penetrate as much as US, as expected, and thus does not interact with the Au NPs which are situated deeper than the optical penetration depth in the blood sample. A two-dimensional image (scan direction versus depth) was produced by plotting all one-dimensional (1-D) depth images (time traces) next to each other. Figure 7 illustrates the images obtained by scanning along the length of each tube using US (a) and PAR (b). Clearly, the best images correspond to S2 for PAR and S4 for US, which is consistent with Figs. 4(a) and 4(b) and is further discussed in Sec. 4. This confirms the well-known fact that the US reflection amplitude, , increases with the concentration of Au NP whereas in the PAR case, it is the absorption coefficient of the medium which is the determining parameter. Transversely scanned (cross-sectional) PAR images of S2 and S3 artificial blood vessel tubes are illustrated in Fig. 8. They, too, are indicative of the higher intensity distribution produced by 10% than that with 20% Au NPs. 4.Discussion4.1.Heat Generation and Transfer by Au NPsInitially, the absorption of pulsed or modulated laser energy by NPs produces a heating effect which is quickly equilibrated within the NP ensemble. Subsequently, the heat is transferred from the NPs to the surrounding medium or matrix (blood) via nonradiative relaxation within a few ps. In the absence of phase transformations, heat transfer in a system with NP thermal sources is described by the heat conduction equation where is the temperature, Q is the heating source, are the density and specific heat of an Au NP, respectively, and is the thermal conductivity of the surrounding medium.The total amount of heat produced is , where and represent the components produced by blood and gold NPs, respectively. In our case, the approximation holds, so it is assumed that each NP is quasitransparent to the incident light and is constant across each nanoparticle. For a single Au NP exposed to a laser beam, the generated power is where is defined by Eq. (4) and where is the volume of the NP. The heat source is derived from the heat power density , where the integral is over the NP volume . To calculate , we assume the size of an Au NP is smaller than the laser wavelength so that electrons inside the NPs respond collectively to the applied electric field of the laser radiation, , where is the blood permittivity. It is found that15 where is the current density inside the metallic NP. The heat generated is thus directly proportional to the square modulus of the NP electric field.54 The temperature field induced by chirped-laser heating can be modeled via conductive heat transfer, assuming that the laser energy absorption in the B-Au medium is quantified by the volumetric heat generation which decays exponentially from the point of absorption defined by Eq. (12). Since the laser beam spot size, , is larger than both the optical penetration depth, and the thermal diffusion length, , the temperature field of a single nanoparticle can be obtained using the 1-D heat conduction equation. If all the absorbed optical energy is converted to nanoparticle heating, the temperature increase can be evaluated using Eq. (17) where is the laser fluence and is the mass of a gold particle55The maximum temperature change of blood volume element, , is where is the number of Au NPs per unit element and is the radius of the irradiated element. The maximum temperature occurs at the surface of the NP, . Thus, the larger the NP sphere, the longer it takes for heat to diffuse or transfer to the surrounding medium (i.e., it cools down more slowly). On the microscale it can be assumed that NPs are totally embedded within the blood matrix and are small enough to have a uniform steady-state temperature equal to the surrounding blood temperature, , owing to fast heat transfer and thermalization time. However, on a larger scale, for example after some agglomeration, the blood temperature of a spatially localized element may be different due to the possible thermal overlapping of a larger fraction of NPs and clustering at that element. It is interesting to note that because NPs are dispersed inside a static colloidal medium, their distribution within the tube can be considered as Brownian motion.Normally, in soft matter physics, the Brownian motion of colloidal dispersions (as in this case) results in a Lorentzian distribution. Therefore, assuming, where is the probability of finding an NP at a distance in a volume , and is the density distribution of NPs, a function which decays according to the spatially damped radial function56 where is the blood vessel radius.4.2.PA Generation and its Transfer by B-Au NPWhile PA signal generation is mainly based on the illuminated material optical absorption properties, the subsequent US propagation within the medium is directly conditioned by the properties of the surrounding medium such as the acoustic matching impedance, the absorption coefficient which is affected by the viscosity and the relaxation time of the medium, the scattering coefficient which depends on the particle number density, and the size and level of the spatial distribution of the scatterers. The transducer properties and the signal processing instrumentation can also affect the sensitively of the PA signal. The interaction of a laser pulse with a relatively weakly absorbing heterogeneous medium, such as blood containing a suspension of strongly absorbing nanoparticles, generates a PA signal enhancement effect. While the absorbers are the NPs, the signal propagates in the surrounding fluid and heat transfer defines the signal generation process. Therefore, the produced acoustic signal is proportional to the amount of energy deposited into the NPs and the thermoelastic properties of the surrounding environment. Absorption of optical chirp energy by the medium results in the generation of similar-frequency-modulated acoustic waves propagating within the medium. Quantitative PAI in the presence of nanoparticles is a function of the PA response signal (maximum signal voltage, ). The amplitude is given as a function of independent responses from single particles, the wavelength-dependent optical , the number of nanoparticles (), and the deposited energy (). The PA signal is given as57 where is the effective Grüneisen constant for a given NP type, is the volume thermal expansion, is the specific heat of the surrounding medium, and is the PA signal from any endogenous absorbers such as whole blood defined by the product of the blood absorption coefficient, , and the optical fluence, 58Here, , Hb, and are the relative hemoglobin and oxyhemoglobin concentrations. and are the corresponding molar extinction coefficients.59 If, however, is negligible, then is due to NPs only. Equation (20) holds as long as the NP absorption cross-section and environment are constant, and particle-to-particle thermal and electromagnetic coupling can be neglected. The propagating spherical pressure field detected by a transducer at a distance, has a spatial profile41 where is the distance from the laser to the object or heat source within the tissue, is the pressure amplitude and is a phase constant due to thermoelastic conversion. At low frequencies, (a few MHz), and for weakly scattering NPs, the relation between the backscattering cross section and the RBC acoustic properties is simple and is described by Rayleigh scattering. In the case of RBCs with radius this is valid up to ,60 that is, within the range . Although the PA signal is produced by the absorbed fraction of the incident optical energy that is converted to heat, the photon density distribution in a turbid medium changes when it scatters. This causes a change in the heated region and in the shape of the PA sound source. Since the optical penetration depth in blood, (1.4 mm at 800 nm) where is the beam radius, and , where is the thermal diffusion length in blood, , where is the chirp duration and is the thermal diffusivity of blood, it follows that the PA source in blood can be assumed to be spherical and a 1-D model can be used. Using61 , one finds and for and 4 ms, respectively. The latter is the minimum irradiation time followed by a 1s delay time before the next 4-ms chirp. Also, the values for the blood thermal relaxation time are and for the acoustic transient time , respectively. Based on the results shown in Table 2, since and , and , and where and are the initial and final angular modulation frequencies, it can be deduced that S1 is effectively weakly absorbing (i.e., a thermally thick and optically transparent medium, ) which satisfies thermal but not acoustic confinement. However, when Au NPs are added to blood, the situation begins to reverse and the medium becomes strongly absorbing (i.e., and , , a thermally thin and optically opaque medium). The relation , gives a value of for gold at 800 nm which is comparable with that obtained by Etchegoin et al.62 Also, one obtains for gold. By substituting the values of (blood) and (Au) for and in Eq. (13), the corresponding value of the volume fraction absorption coefficient can be determined. Despite the fact that the B-Au NP medium is a stronger absorber than pure blood, nevertheless, and and neither the thermal nor the acoustic confinement condition is met.Table 2Calculated thermo-acoustic properties of B-Au N Ps for S2 (10%) and S3 (20%). The subscript c indicates the value of a parameter based on the combined volume fraction.
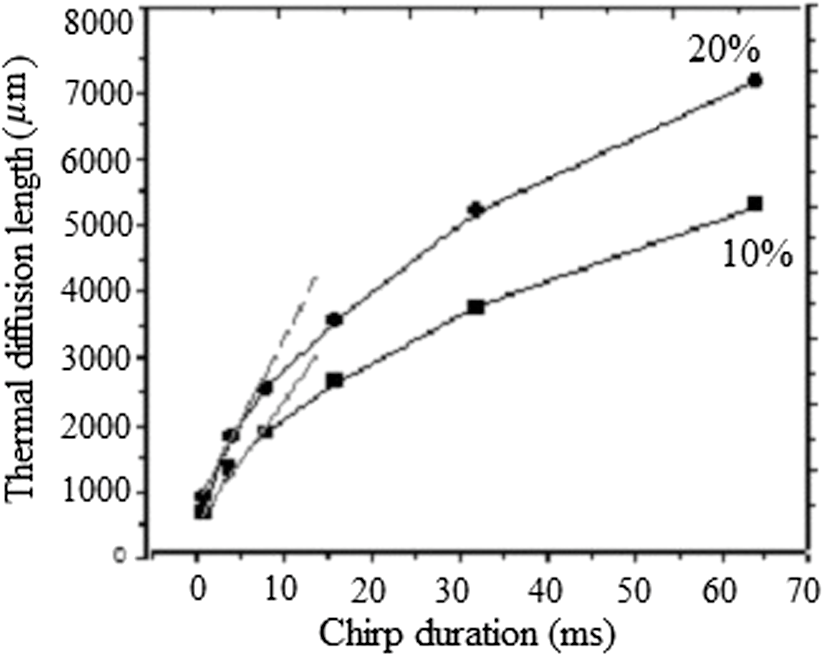
Note: ρ, density; C, heat capacity; D, thermal diffusivity; K, thermal conductivity; τr, thermal relaxation time; τa, acoustic transient time; μα, absorption coefficient; and XT, thermal diffusion depth. Figure (9) shows the values for a 0.3 to 2.6-MHz chirp using , where is the combined, or volume fraction, value of thermal diffusivity of the B-Au NP medium. One key result is that almost 75% of the total thermal-wave penetrates the medium within 0.3 to 1 MHz and correspondingly 19% between 1 and 2 MHz and 6% between 2 and 3 M Hz. Figure 10 indicates that not only does increase with chirp duration, but after 8 ms, the curves show a sublinear increase. Two biophysical reasons can be invoked for interpreting this finding. First, the depth of diffusive laser-induced heating occurs within a given time and possible implications regarding the breakdown of blood tissue integrity within that depth must be considered. Next, the laser-tissue interaction process may be nonlinear. Therefore, identifying that process might be crucial in further understanding its bioclinical consequences. Figure 11 shows further analysis of thermal diffusion length distribution for different frequency ranges during a given chirp duration, i.e., a thermal diffusion length breakdown in terms of frequency. It is interesting to note that not only does the thermal diffusion length increase with chirp duration as expected from photothermal-wave behavior, but the energy content of thermal diffusion for a given chirp duration also takes place at lower frequencies as expected from the low-pass filtering nature of PA signals.42 Fig. 11Distribution of thermal length as a function of chirp duration for Au NPs’ concentration: (a) S2 (10%) and (b) S3 (20%).  It can be seen from Eq. (16) that the amount of heat generated is directly proportional to modulation angular frequency and Eq. (18) states that the larger the number of NPs and the higher the laser fluence, the higher the temperature in each volume element of a blood-vessel simulating tube during irradiation. Consequently, for contrast-enhanced PAI of a given blood containing tissue volume, not only the laser parameters, but also the NP concentration should be carefully optimized. Furthermore, according to Eq. (19), it is expected that temperature changes for each volume element with the density distribution function of NPs. This is then followed by a corresponding PA signal voltage generation according to Eq. (20). This PA pressure increase is described by Eq. (22). Therefore, it appears that both the temperature increase due to a higher number of NPs and their density variation within each volume element and on the entire volume can increase the PA signal and the imaging SNR. It is well known that any modification of cellular plasma membrane or even the cytoplasm contents including proteins will affect the absorption and scattering behavior of RBC. Therefore, it is expected that a better image contrast should be obtained with S2 compared with S3, as observed in Figs. 8 and 4(b). In fact, it has been suggested 53 that the change of the optothermal properties of blood due to the decrease of osmolarity changes the shape of the erythrocytes due to higher optical absorption. Based on this fact and on the fact that the cross-sectional area of an RBC, , depends on the shape of the cells interacting with light and the shape factor (), see Eq. (9), the lower PA amplitude of S3 than S2, Fig. 4(b), can be better understood: i.e., higher rates of optical absorption and heat transfer to the surrounding medium may have a direct impact on the structural integrity and the optical properties of RBCs. The basis of this fact goes back to 1865 when Scultz63 reported for the first time the morphological changes induced by heating cells when microspherocytosis and fragmentation were observed. Since then much research has confirmed this thermo-biological effect. One related issue of interest is the deformation of RBCs irradiated with laser power and the consequences of laser irradiation in biomedical applications.64,65 Thus, the number of Au NPs which can be used to enhance the PA signal is a decisive factor and must be optimized. In our case, this is clearly shown by the higher Au NP concentration (S3) which generated a lower PA signal due to probably irreversible cellular thermal damage. The heating efficiency of Au NPs is defined as24 where and . In fact, determines the increase in particle temperature under the action of laser irradiation and depends on the NP density, the thermal properties of the surrounding medium (in this case, blood) and chirp duration. Using the laser power, in our experiment, Eq. (23) yields, where for a 2-mm laser spot size. Figure 12 shows the variation of heating efficiency with chirp duration, which is found to decrease rapidly for chirp durations longer than 1 ms. For durations , the heat loss from NPs via heat conduction during the time is rate limiting to the attainment of the maximum temperature in the blood-NP mixture.The maximum efficiency of heat transformation into acoustic pressure is given by24 where is the density of the surrounding medium, is the effective thermal expansion coefficient of the Au NP material, is the distance of the observation point from the source, and is a function defining the time dependence of the laser radiation intensity. Equation (21) shows that the pulsed PA signal at the onset will increase by increasing the Au NP concentration, but it is also possible that agglomeration and cluster formation affects the interaction which effectively increases the attenuation at later times . Indeed, it has been shown that the PA signal increase with NP concentration may be explained in terms of clustering due to thermal overlapping which is greater than when the NPs are monodispersed or are less clustered.66,67 However, Roper et al.68 have shown that modulating the incident laser irradiation increases the NP efficiency of acoustic transduction in an aqueous solution more than two orders of magnitude compared with an unmodulated cw argon laser and that modulation can decrease NP-NP aggregation: decreasing the chopping frequency lowers the efficiency . Therefore, the rate of modulation should be much higher than the NP-NP interaction frequency in order to increase the efficiency, . Bear in mind that the diffusion time constant for coagulative interactions between neighboring Au NPs using the Stokes-Einstein diffusivity is (i.e., . Between consecutive chopped pulses, NP temperatures relax rapidly within to 79 ps. Therefore, when laser light is chopped, NP-NP interactions are less likely to cause aggregation. As a result, decreasing the chopping frequency decreases the transduction efficiency.685.ConclusionsThe effect of Au NP concentration on the PAR signal based on SPR and hence the quality of PAR blood imaging was studied. It was shown that the combination of PARI with an optimized 100-nm diameter Au NP concentration is a promising technique to visualize absorbing media such as blood vessels while USI can provide better structural information. Sample S1 was shown to be an optically thin medium which met the thermal but not the acoustic confinement condition, whereas samples S2 and S3 both proved to be optically thick and absorbing without satisfying either the thermal or the acoustic confinement condition. The PA cross-correlation peak amplitude was measured in the order of . Adding 10% Au increased the PSD amplitude in both US and PAR with the highest distribution between 1.4 and 3.0 MHz in the former case. Maximum thermal diffusion length occurred between 0.3 and 1 MHz for every chirp duration, beyond which frequency it decreased rapidly. Also, the diffusion length for S3 at constant modulation frequency and chirp duration was found to be longer than S2. The best PAR imaging contrast was achieved with S2 which exhibited the highest PA signal in this study at 10% concentration. In order to avoid cellular thermal damage and low quality imaging, not only the laser parameters but also the contrast agents such as Au NPs, which can be used to enhance the PA signal, must be carefully optimized in terms of size, shape and concentration. These factors directly affect the amount of heat produced and the PA backscattering flux due to the thermally induced changes of RBCs’ shape and orientation. AcknowledgmentsThe authors gratefully acknowledge the support of Samsung Corp. for a GRO grant, to the Canada Research Chairs program and the Natural Sciences and Engineering Research Council of Canada (NSERC) for a Discovery Grant to A.M. ReferencesD. Pan et al.,
“Molecular photoacoustic imaging of angiogenesis with integrin-targeted gold nanobeacons,”
FASEB J., 25 875
–882
(2011). http://dx.doi.org/10.1096/fj.10-171728 FAJOEC 0892-6638 Google Scholar
E. Genina et al.,
“Optoacoustic visualization of blood vessels in vitro,”
Proc. SPIE, 3916 84
–86
(2000). http://dx.doi.org/10.1117/12.386308 PSISDG 0277-786X Google Scholar
A. Oraevsky et al.,
“Optoacoustic imaging of blood for visualization and diagnostics of breast cancer,”
Proc. SPIE, 4618 81
–94
(2002). http://dx.doi.org/10.1117/12.469851 PSISDG 0277-786X Google Scholar
R. G. Kolman, W. Steenbergen and T. Van Leeuwen,
“In vivo photoacoustic imaging of blood vessels with a pulsed laser diode,”
Lasers Med. Sci., 21 134
–139
(2006). http://dx.doi.org/10.1007/s10103-006-0384-z Google Scholar
K. Wilson, T. Wang and J. Willmann,
“Acoustic and photoacoustic molecular imaging of cancer,”
J. Nuclear Med., 54 1851
–1854
(2013). Google Scholar
E. Gussakovsky et al.,
“NIR spectroscopic imaging to map hemoglobin + myoglobin oxygenation, their concentration and optical path length across a beating pig heart during surgery,”
J. Biophotonics, 5 128
–139
(2012). http://dx.doi.org/10.1002/jbio.201100031 Google Scholar
J. Laufer et al.,
“In vitro measurements of absolute blood oxygen saturation using pulsed near-infrared photoacoustic spectroscopy: accuracy and resolution,”
Phys. Med. Biol., 50 4409
–4428
(2005). http://dx.doi.org/10.1088/0031-9155/50/18/011 PHMBA7 0031-9155 Google Scholar
C. Fredrich et al.,
“Photoacoustic blood oxygenation imaging based on semiconductor lasers,”
Photonics Optoelect., 1 48
–54
(2012). PHOPET 1067-5345 Google Scholar
A. Yaroslavasky et al.,
“Optics of blood,”
Handbook of Optical Biomedical Diagnostics, 169
–216 SPIE Press, Bellingham, Washington
(2002). Google Scholar
M. Friebel et al.,
“Influences of oxygen saturation on the optical scattering properties of human red blood cells in the spectral range 250 to 2000 nm,”
J. Biomed. Opt., 14
(3), 034001
(2009). http://dx.doi.org/10.1117/1.3127200 JBOPFO 1083-3668 Google Scholar
M. Meinke et al.,
“Properties of platelets and blood plasma and their influence on the optical behavior of whole blood in the visible to NIR wavelength range,”
J. Biomed. Opt., 12
(1), 014024
(2007). http://dx.doi.org/10.1117/1.2435177 JBOPFO 1083-3668 Google Scholar
E. Franceschini, R. Saha and G. Cloutier,
“Comparison of three scattering models for ultrasound blood characterization,”
IEEE Trans. Ultrasound , 60 2321
–2327
(2013). http://dx.doi.org/10.1109/TUFFC.2013.6644736 Google Scholar
V. K. Pustovalov and V. Babenkov,
“Optical properties of gold nanoparticles at laser radiation wavelengths for laser applications in nanotechnology and medicine,”
Laser Phys. Lett., 10 516
–520
(2004). http://dx.doi.org/10.1002/lapl.200410111 1612-2011 Google Scholar
M. Hossain et al.,
“Surface-enhanced Raman scattering: realization of localized surface Plasmon resonance using unique substrates and methods,”
Ana. Bioanal. Chem., 394 1747
–1760
(2009). http://dx.doi.org/10.1007/s00216-009-2762-4 ABCNBP 1618-2642 Google Scholar
G. Baffou and R. Quidant,
“Thermo-plasmonics: using metallic nanostructures as nano-sources of heat,”
Laser Photonics Rev., 7 171
–187
(2013). http://dx.doi.org/10.1002/lpor.201200003 Google Scholar
Z. Hasannejad and M. E. Khosroshahi,
“Synthesis and evaluation of time dependent properties of plasmonic-magnetic nanoparticles,”
Opt. Mat., 35 644
–651
(2013). http://dx.doi.org/10.1016/j.optmat.2012.10.019 Google Scholar
B. Khlebtsov et al.,
“Optical amplification of photothermal therapy with gold nanoparticles and nanoshells,”
Nanotechology, 17 5167
–5179
(2006). http://dx.doi.org/10.1088/0957-4484/17/20/022 Google Scholar
X. Hung et al.,
“Gold nanoparticles: interesting optical properties and recent applications in cancer diagnostics and therapy,”
Nanomedicines, 2 681
–693
(2007). http://dx.doi.org/10.2217/17435889.2.5.681 1743-5889 Google Scholar
X. Yang et al.,
“Photoacoustic tomography with novel contrast agent based on gold nanocages or nanoparticles containing NIR dyes,”
Proc. SPIE, 6856 685601
(2008). http://dx.doi.org/10.1117/12.762401 Google Scholar
B. Wang et al.,
“Intravascular photoacoustic imaging of macrophages using molecularly targeted gold nanoparticles,”
Proc. SPIE, 7564 75640A
(2010). http://dx.doi.org/10.1117/12.841070 Google Scholar
G. Luke, D. Eager and S. Emelianov,
“Biomedical applications of photoacoustic imaging with exogenous contrast agents,”
Annals Biomed. Eng., 40 422
–437
(2011). http://dx.doi.org/10.1007/s10439-011-0449-4 Google Scholar
R. Alwi et al.,
“Silica-coated SPIONs as biocompatible contrast agents in biomedical photoacoustics,”
Biomed. Opt. Express, 3 2500
(2012). http://dx.doi.org/10.1364/BOE.3.002500 BOEICL 2156-7085 Google Scholar
S. Zangandeh et al.,
“Photoacoustic imaging enhanced by indocynine green-conjugated single-wall carbon Nanotubes,”
J. Biomed. Opt., 18
(9), 096006
(2013). http://dx.doi.org/10.1117/1.JBO.18.9.096006 JBOPFO 1083-3668 Google Scholar
V. K. Pustovalov et al.,
“Thermo-optical analysis and selection of the properties of absorbing nanoparticles for laser applications in cancer nanotechnology,”
Cancer Nanotechnol., 1 35
–46
(2010). http://dx.doi.org/10.1007/s12645-010-0005-1 Google Scholar
A. Kuznetsov et al.,
“Application of magnetic liposomes for magnetically guided transport of muscle relaxants and anti-cancer photodynamic drugs,”
J. Mag. Mag. Mat., 25 95
–100
(2001). http://dx.doi.org/10.1016/S0304-8853(00)01235-X JMMMDC 0304-8853 Google Scholar
M. Mahmoodi, M. E. Khosroshahi and F. Atyabi,
“Dynamic study of PLGA/CS nanoparticles delivery containing drug model into phantom tissue using laser for clinical applications,”
J. Biophotonics, 6 403
–414
(2011). http://dx.doi.org/10.1002/jbio.201000121 Google Scholar
A. Gormley et al.,
“Guided delivery of polymer therapeutics using plasmonics photothermal therapy,”
Nano Today, 7
(3), 158
–167
(2012). http://dx.doi.org/10.1016/j.nantod.2012.04.002 NTAOCG 1748-0132 Google Scholar
J. Lademann et al.,
“Nanocapsules for drug delivery through the skin barrier by tissue-tolerable plasma,”
Laser Phys. Lett., 10 083001
(2013). http://dx.doi.org/10.1088/1612-2011/10/8/083001 1612-2011 Google Scholar
Z. Hassannejad, M. E. Khosroshahi and M. Firouzi,
“Fabrication and characterization of magnetoplasmonic liposome carriers,”
Nanosci. Tech., 1 1
–9
(2014). Google Scholar
J. Welinsky and M. Grinstaff,
“Therapeautic and diagnositic applications of dendrimers for cancer treatment,”
Adv. Drug Delivery, 60 1037
–1055
(2008). http://dx.doi.org/10.1016/j.addr.2008.02.012 ADDREP 0169-409X Google Scholar
Ch. Patra et al.,
“Fabrication of gold nanoparticles for targeted therapy in pancreatic cancer,”
Adv. Drug. Delivery Rev., 62 346
–361
(2010). http://dx.doi.org/10.1016/j.addr.2009.11.007 ADDREP 0169-409X Google Scholar
V. Pattani and J. Tunnell,
“Nanoparticle-mediated photothermal therapy: A comparative study of heating for different particle types,”
Lasers Surg. Med., 44 675
–684
(2012). http://dx.doi.org/10.1002/lsm.22072 LSMEDI 0196-8092 Google Scholar
M. Sadat et al.,
“Effect of spatial confinement on magnetic hyperthermia via dipolar interaction in nanoparticles for biomedical applications,”
Mat. Sci. Eng.C, 42 52
–63
(2014). http://dx.doi.org/10.1016/j.msec.2014.04.064 Google Scholar
A. Gobin et al.,
“Near infrared laser-tissue welding using nanoshells as an exogenous absorber,”
Lasers Surg. Med., 9999 1
–7
(2005). LSMEDI 0196-8092 Google Scholar
M. E. Khosroshahi and M. Nourbakhsh,
“Enhanced laser tissue soldering using indocynine green and gold nanoshells combination,”
J. Biomed. Opt., 16
(8), 088002
(2011). http://dx.doi.org/10.1117/1.3611001 JBOPFO 1083-3668 Google Scholar
Y. Fan et al.,
“Development of a laser photothermoacoustic frequency- swept system for subsurface imaging: theory and experiment,”
J. Acoust. Soc. Am., 116 3523
–3533
(2004). http://dx.doi.org/10.1121/1.1819393 JASMAN 0001-4966 Google Scholar
S. Telenkov and A. Mandelis,
“Fourier-domain biophotoacoustic subsurface depth selective amplitude and phase image of turbid phantoms and biological tissue,”
J. Biomed. Opt., 11
(4), 044006
(2006). http://dx.doi.org/10.1117/1.2337290 JBOPFO 1083-3668 Google Scholar
K. Maslov and L. Wang,
“Photoacoustic imaging of biological tissue with intensity-modulated continuous-wave laser,”
J. Biomed. Opt., 13
(2), 024006
(2008). http://dx.doi.org/10.1117/1.2904965 JBOPFO 1083-3668 Google Scholar
A. Petscke and J. Riviere,
“Comparison of intensity-modulated continuous-wave lasers with chirped modulation frequency to pulsed lasers for photoacoustic imaging applications,”
Biomed. Opt. Exp., 1
(4), 1188
–1195
(2010). http://dx.doi.org/10.1364/BOE.1.001188 BOEICL 2156-7085 Google Scholar
S. Telenkov et al.,
“Frequency-domain photothermoacoustics: alternative imaging modality of biological tissues,”
J. Appl. Phys., 105 102029
(2009). http://dx.doi.org/10.1063/1.3116136 JAPIAU 0021-8979 Google Scholar
S. Telenkov et al.,
“Frequency-domain photoacoustic phased array probe for biomedical imaging applications,”
Opt. Lett., 36 4560
–4562
(2011). http://dx.doi.org/10.1364/OL.36.004560 OPLEDP 0146-9592 Google Scholar
B. Lashkari and A. Mandelis,
“Comparison between pulsed laser and frequency-domain photoacoustic modalities: signal-to-noise ratio, contrast, resolution, and maximum depth detectivity,”
Rev. Sci. Instrum., 82 094903
(2011). http://dx.doi.org/10.1063/1.3632117 Google Scholar
R. Alwi et al.,
“Study of tissue phantoms, tissue, and contrast agent with the biophotoacoustic radar and comparison to ultrasound imaging for deep subsurface imaging,”
Int. J. Thermophys., 33 1808
–1813
(2012). http://dx.doi.org/10.1007/s10765-012-1286-x IJTHDY 0195-928X Google Scholar
B. Khlebtsov and N. Khlebtsov,
“Biosensing potential od silica/gold nanoshells: sensitivity of Plasmon resonance to the local dielectric environment,”
J. Quant. Spect., 106 154
–169
(2007). http://dx.doi.org/10.1016/j.jqsrt.2007.01.015 Google Scholar
P. Jain et al.,
“Calculated absorption and scattering properties of gold nanoparticles of different shape, and composition: applications in biomedical imaging and biomedicine,”
J. Phys. Chem. B, 110 7238
–7248
(2006). http://dx.doi.org/10.1021/jp057170o JPCBFK 1520-6106 Google Scholar
M. Fribel, A. Roggen and G. Muller,
“Determination of optical properties of human blood in the spectral range 250-1100 nm using Monte Carlo simulations with hematocrite-dependent effective scattering phase functions,”
J. Biomed. Opt., 11
(3), 034021
(2006). http://dx.doi.org/10.1117/1.2203659 JBOPFO 1083-3668 Google Scholar
D. Yim et al.,
“A cell-based light interaction model for human blood,”
Eurographics, 31 845
–854
(2012). Google Scholar
D. R. Lide, CRC Handbook of Chemistry and Physics, 7th ed.1990–1991). Google Scholar
C. Coussios,
“The significance of shape and orientation in single-particle weak-scattering Models,”
J. Acoust. Soc. Am., 112 906
–915
(2002). http://dx.doi.org/10.1121/1.1498852 JASMAN 0001-4966 Google Scholar
A. Govorov et al.,
“Gold nanoparticles as heaters and actuators: melting and collective plasmon resonances,”
Nanoscale Res. Lett., 1 84
–90
(2006). http://dx.doi.org/10.1007/s11671-006-9015-7 NRLAAD 1556-276X Google Scholar
A. Rogan et al.,
“Optical properties of circulating human blood in the wavelength range 400–2500 nm,”
J. Biomed. Opt., 4
(1), 36
–46
(1999). http://dx.doi.org/10.1117/1.429919 JBOPFO 1083-3668 Google Scholar
P. V. Zinin,
“Theoretical analysis of sound attenuation mechanisms in blood and in erythrocyte suspensions,”
Ultrasonics, 30 26
–34
(1992). http://dx.doi.org/10.1016/0041-624X(92)90028-K ULTRA3 0041-624X Google Scholar
N. Gershfeld and M. Murayama,
“Thermal instability of red blood cell membrane bilayers: Temperature dependence of hemolysis,”
J. Membr. Biol., 101 67
–72
(1988). http://dx.doi.org/10.1007/BF01872821 JMBBBO 0022-2631 Google Scholar
A. Govorov and H. Richardson,
“Generating heat with metal nanoparticles,”
Nanotoday, 2
(1), 30
–38
(2007). http://dx.doi.org/10.1016/S1748-0132(07)70017-8 Google Scholar
V. Pustovalov and V. Babenko,
“Computer modeling of optical properties of gold ellipsoidal nanoparticles at laser radiation wavelengths,”
Laser Phys. Lett., 2 84
–89
(2005). http://dx.doi.org/10.1002/lapl.200410126 1612-2011 Google Scholar
L. Baba-ahmad, M. Benmouna and M. Grimson,
“Elastic scattering from charged colloidal dispersions,”
J. Phys. Chem., 16 235
–238
(1987). JPCHAX 0022-3654 Google Scholar
J. Cook, W. Frey and S. Emeilanov,
“Quantitative photoacoustic imaging of nanoparticles in cells and tissues,”
ACSNano, 7 1272
–1280
(2013). Google Scholar
B. Cox, J. Laufer and P. Beard,
“Photons Plus Ultrasound: Imaging and Sensing,”
Proc. SPIE, 7177 717713
(2009). http://dx.doi.org/10.1117/12.806788 PSISDG 0277-786X Google Scholar
S. Hu and L. Wang,
“Photoacoustic imaging and characterization of the microvasculature,”
J. Biomed. Opt., 15
(1), 011101
(2010). http://dx.doi.org/10.1117/1.3281673 JBOPFO 1083-3668 Google Scholar
D. Savery and G. Clouteir,
“High-frequency ultrasound backscattering by blood: Analytical and semianalytical models of the erythrocyte cross section,”
J. Acoust. Soc. Am., 121 3963
–3971
(2007). http://dx.doi.org/10.1121/1.2715452 JASMAN 0001-4966 Google Scholar
F. Duck, Physical Properties of Tissue: A Comprehensive Reference Book, Academic Press Inc., San Diego
(1990). Google Scholar
P. Etchegoin, E. Le Ru and M. Meyer,
“An analytic model for the optical properties of gold,”
J. Chem. Phys., 125 164705
(2006). http://dx.doi.org/10.1063/1.2360270 JCPSA6 0021-9606 Google Scholar
M. Scultz,
“Ein heizbarer objektisch und sein ver-wendung bei untersuchung des blutes,”
Archiv f. mikrosk. Anatomie, 1 1
–42
(1865). http://dx.doi.org/10.1007/BF02961404 Google Scholar
H. Karle,
“Effect on red blood cells of a small rise in temperature:in vitro studies,”
Br. J. Haematol., 16 409
–419
(1969). http://dx.doi.org/10.1111/j.1365-2141.1969.tb00418.x BJHEAL 0007-1048 Google Scholar
I. Sarj et al.,
“Cell deformation cytometry using diode-bar optical stretchers,”
J. Biomed. Opt., 15
(4), 047010
(2010). http://dx.doi.org/10.1117/1.3470124 JBOPFO 1083-3668 Google Scholar
C. Bayer et al.,
“Photoacoustic signal amplification through plasmonic nanoparticle aggregation,”
J. Biomed. Opt., 18
(1), 016001
(2013). http://dx.doi.org/10.1117/1.JBO.18.1.016001 JBOPFO 1083-3668 Google Scholar
M. E. Khosroshahi, A. Mandelis and B. Lashkari,
“Combined photoacoustic ultrasound and beam deflection signal monitoring of gold nanoparticle agglomerate concentrations in tissue phantoms using a pulsed Nd:YAG laser,”
J. Int. Therm. Phys., 06 1773
–3
(2014). Google Scholar
D. Roper, W. Ahn and M. Hoepfner,
“Microscale heat transfer transduced plasmon resonant gold nanoparticles,”
J. Phys. Chem. C, 111 3636
–3641
(2007). http://dx.doi.org/10.1021/jp064341w Google Scholar
BiographyMohammad E. Khosroshahi is a full professor of applied laser physics and biomedical engineering. His research interests are nanobiophotonics, targeted theranostic, photoacoustic drug delivery, bioimaging, nonlinear biological optics, laser tissue soldering, laser surface modification, and surface physics. His research at CADIFT is on plasmonic-enhanced photoacoustic bioimaging and characterization. He is author of 1 book, 2 book chapters, 80 peer-reviewed papers and more than 100 conference papers. He is a fellow member of the Institute of Nanotechnology. Andreas Mandelis is a full professor of mechanical and industrial engineering; electrical and computer engineering; and the institute of biomaterials and biomedical engineering, University of Toronto. He is the director of the Center for Advanced Diffusion-Wave Technologies (CADIFT) at the University of Toronto. His research interests span the areas of instrumentation and measurement science, nondestructive and non-invasive imaging and sensors, photoacoustic and photothermal physics and technologies, signal processing, biothermophotonic laser diagnostics, and semiconductor optoelectronics. Bahman Lashkari is a postdoctoral research associate at the CADIFT, where he works on several photoacoustic and ultrasound projects. He received his PhD in the same lab working on frequency-domain photoacoustic imaging (2011). His research interests are in medical imaging and tissue characterization. |