
|
|
1.IntroductionRegenerative medicine aims to restore the normal function of injured tissues by means of cells and scaffolds.1 Mesenchymal stem cells found in various niches within the human body represent an interesting cell source for cell-based regenerative therapies as they have the ability to self-renew and differentiate into multiple tissues.2 Among these, dental pulp stem cells (DPSCs) have been shown to have the potential to differentiate in multiple lineages with a high proliferation rate.3 Dental pulp can be easily collected from teeth after dental extraction. The most frequent case is the collection of normal human wisdom teeth extracted for orthodontic reasons.4 A key factor for therapeutic applications using mesenchymal stem cells is to control and follow cell differentiation in order to graft cells that are able to produce a specific tissue. Collagen is a basic component of organic matrix in bone and dentin. Of the total bone protein, 85 to 90% consist of type I collagen, and collagen cross-linking is one of its most distinct features. The collagen network has a significant effect on the mechanical integrity of bone: when collagen is less cross-linked, the bone loses its stiffness.5 Monitoring cells’ differentiation via the determination of calcium phosphate accumulation and collagen cross-link is possible via confocal Raman microscopy that has been widely used for cell imaging and biological conformation imaging.6,7 Each individual conformation (sheets, helices, and so forth) has its specific chemical formulation and, consequently, generates a specific Raman signal. The Raman spectra of individual cells are very complex, and cells spectra8,9 and the Raman fingerprints of diverse molecular structures and chemical compounds have been reported previously.10 High spatial resolution (spatial resolution of 300 nm with a 532 nm laser) and a unique compositional sensitivity are the main advantages of Raman confocal spectroscopy over other spectroscopic methods.11 In this study, confocal Raman microscopy is used to monitor the differentiation of DPSCs into osteoblast-like cells and the process of extracellular matrix maturing. The DPSCs are multipotent and their differentiation into osteoblasts is eminent for their use in bone regeneration.10 The significant sign of stem cells differentiation into osteoblasts (to be used to engineer bone tissue) is producing calcium phosphate. Therefore, the detection of phosphate seems necessary as an indication of successful differentiation of DPSC into osteoblasts. We use the ratio of two selected amide I bands revealing the collagen cross-linking and the presence of the phosphate peak after three weeks of culturing in osteogenic medium to monitor DPSCs osteogenic differentiation. 2.Material and Method2.1.Human Dental Pulp Stem CellsHuman impacted third molars extracted for orthodontic reasons were recovered from healthy patients (15 to 18 years old). Written informed consent was obtained from the parents of the patients. This protocol was approved by the local ethical committee (Comité de Protection des Personnes, Montpellier Hospital, France). Tooth surfaces are cleaned using 2% chlorhexidine and cut around the cementum–enamel junction using sterilized discs. Teeth are then broken into two pieces to reveal the pulp chamber. The pulp tissue is gently separated from the crown and root and then digested in a solution of collagenase type I and dispase for 1 h at 37°C. The solution is then filtered through Falcon strainers and added to supplemented with 10% fetal bovine serum, penicillin, streptomycin and placed in 75 ml flasks. Cells are incubated for one week at 37°C with 5% . Nonadherent cells are removed by a change of medium 24 h after cell seeding. Cells are cultivated 24 h onto polished calcium fluoride () substrates (Crystran Ltd., Dorset, United Kingdom). Before imaging, the cells cultured on substrates were washed three times with phosphate buffered saline (PBS) to remove the culture medium. 2.2.Dental Pulp Stem Cell CharacterizationAfter one week, subconfluent cells were collected and analyzed for minimal criteria to define human mesenchymal stem cells, such as adherence to plastic, expression of cell surface antigens, and ability to differentiate into osteoblasts, adipocytes, and chondroblasts in vitro.12 The antigen profiles of cultured DPSCs were analyzed by detecting the expression of the cell surface markers CD90, CD146, CD117, and CD45 using flow cytometry. CD90 is a widely accepted marker for mesenchymal stem cells, CD146 is a marker expressed in perivascular mesenchymal stem cells, CD117 is the receptor of stem cell factor, and CD45 is a marker of hematopoietic cells, mainly myeloid progenitors.13,14 The latter has been used to demonstrate the absence of contamination by hematopoietic progenitors. Cells were controlled for pluripotency with in vitro osteogenic, adipogenic, and chondrogenic differentiation following a previously described protocol.15 2.3.Raman Data AcquisitionRaman spectra were collected using a Witec Confocal Raman Microscope System alpha 300R (Witec Inc., Ulm, Germany). Excitation in confocal Raman microscopy is generated by a frequency doubled Nd:YAG laser (Newport, Evry, France) at a wavelength of 532 nm. The incident laser beam is focused onto the sample through a NIKON water immersion objective having a numerical aperture of 1.0 and a working distance of 2.8 mm (Nikon, Tokyo, Japan). The laser power passing objective is 15 mW, but the absorbed power by cells in PBS is less. The spatial resolution and depth resolution are 300 nm and , respectively. The microscope is equipped with a piezo-driven scan-stage with a positioning accuracy of to 3 nm horizontally and 10 nm vertically, respectively. Then Raman backscattered radiation mixed with the Rayleigh scattered radiation were passed through an edge filter to block the Rayleigh signal. The acquisition time of a single spectrum was set to 0.5 s. points per image were recorded, leading to a total of 22,500 spectra for one image, each spectrum corresponding to a spatial unit defined as a voxel. Data acquisition is performed using Image Plus 2.08 software from Witec. 2.4.Data AnalysisData analysis is based on two methods. The first method provides integrated Raman intensities in specific regions, in particular CH and phosphate stretching modes. Data processing is performed using Image Plus software from Witec. Each image composed of integrated intensities provides a colored map of the sample: bright yellow hues indicate the highest intensities while orange hues the lowest integrated intensities of the chosen region. The second method consists of a graph calculator and an image cross-section realized using the Witec Project Plus (Ulm, Germany) software. An image obtained with the Witec Project Plus software represents a ratio of two different reconstructed images. Hence, at each pixel, a number with a corresponding color indicates the ratio of those two peaks at a given point of the sample. In each image, a cross-section is plotted indicating the pixel intensities. This graph could provide selected the pixels’ ratio to simplify the data interpretation. More details are presented in Sec. 3. 3.ResultsIn order to use stem cells in tissue regeneration, monitoring the cells’ differentiation and the process of extracellular maturing seems necessary. With this aim, we applied confocal Raman microscopy to evaluate differentiation of DPSCs and extracellular matrix. DPSCs cultured with osteogenic medium were followed weekly, from the first day until day 21. Control experiments without osteogenic medium were also performed (the results are not presented). After 21-day cultivation of DPSCs in osteogenic medium, the phosphate peak appears. Figure 1(a) is a reconstructed Raman image revealing the respective intensities of the stretching mode of CH band (2800 to ) in red and a phosphate stretching mode ( at ) in green color, respectively. The CH bands allow mapping of intracellular organelles as previously reported.16 Here, cells are confluent after a 21 day culture; hence, no such details can be observed and the CH band is used to localized cells and organic extracellular matrix. Figure 1(b) depicts the reconstructed Raman image obtained after a depth scan, where formation of phosphate in green and organization of cells in red can also be remarked. Phosphates are formed under the cells, and as they are confluent after 14 days of culture and formed a well-packed layer, we can suppose that the phosphate layer between and under the cells is released from cells and does not come from precipitation from the osteogenic medium. Fig. 1Dental pulp stem cells (in buffer containing the osteogenic medium) after 21 day culture, objective. Reconstructed image obtained using the intensity of specific Raman spectral modes: (a) top and (b) lateral (in-depth) view of the cells: the CH stretching mode (2800 to ) in red reveals the cells, whereas the green indicates the phosphate stretching mode ( at ). Each pixel is collected at a dwell time of and a point spacing of . 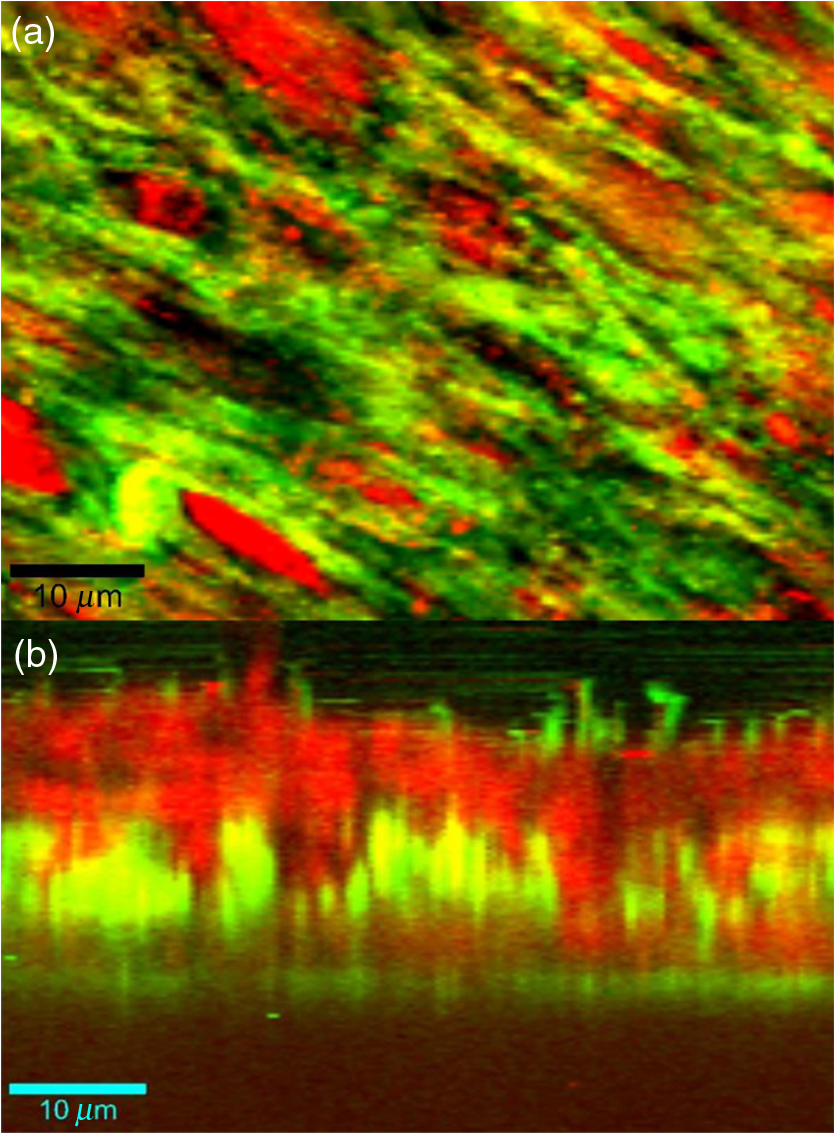 Two typical single spectra selected from cells and the phosphate-rich regions are plotted in Fig. 2: the green spectrum depicts the phosphate-rich region, whereas the red one corresponds to the cell (CH-rich region). Comparing these spectra, we can note three phosphate peaks: (first stretching mode) at , at , and at in the green spectrum that are absent in the red spectrum of the cells. Due to the long time cell culturing, a huge number of cells are present on the substrate; therefore, CH peaks of cell layers on the bottom of the phosphate layer also appear in the phosphate-rich region. Another peak, present only in the green spectrum at and coming from the bending mode of collagen,17 is absent in the cell spectrum. Fig. 2The Raman spectra of individual cells in solid line and of the phosphate-rich region in dotted line.  As mentioned before, after 21 days of proliferation, a confluent layer of cells was formed, which rendered single cell imaging impossible. To overcome this problem, cells after 21 day culture in osteogenic medium were trypsinized and centrifuged. Treated cells were plated in a Petri dish and allowed to adhere for 24 h on the substrate and then imaged by Raman microscopy. Figure 3 shows a reconstructed Raman image based on the CH stretching mode intensities (2800 to ). The green cluster presents the position of phosphate in the confocal plane of a single cell. The average spectrum presented in Fig. 3 clearly shows a peak corresponding to the stretching mode of phosphate at . Fig. 3(a) Reconstructed Raman image of cells obtained from CH stretching mode intensities (2800 to ). The green cluster presents the position of phosphate in the confocal plane of a single cell. (b) The average spectrum of the phosphate cluster is presented. 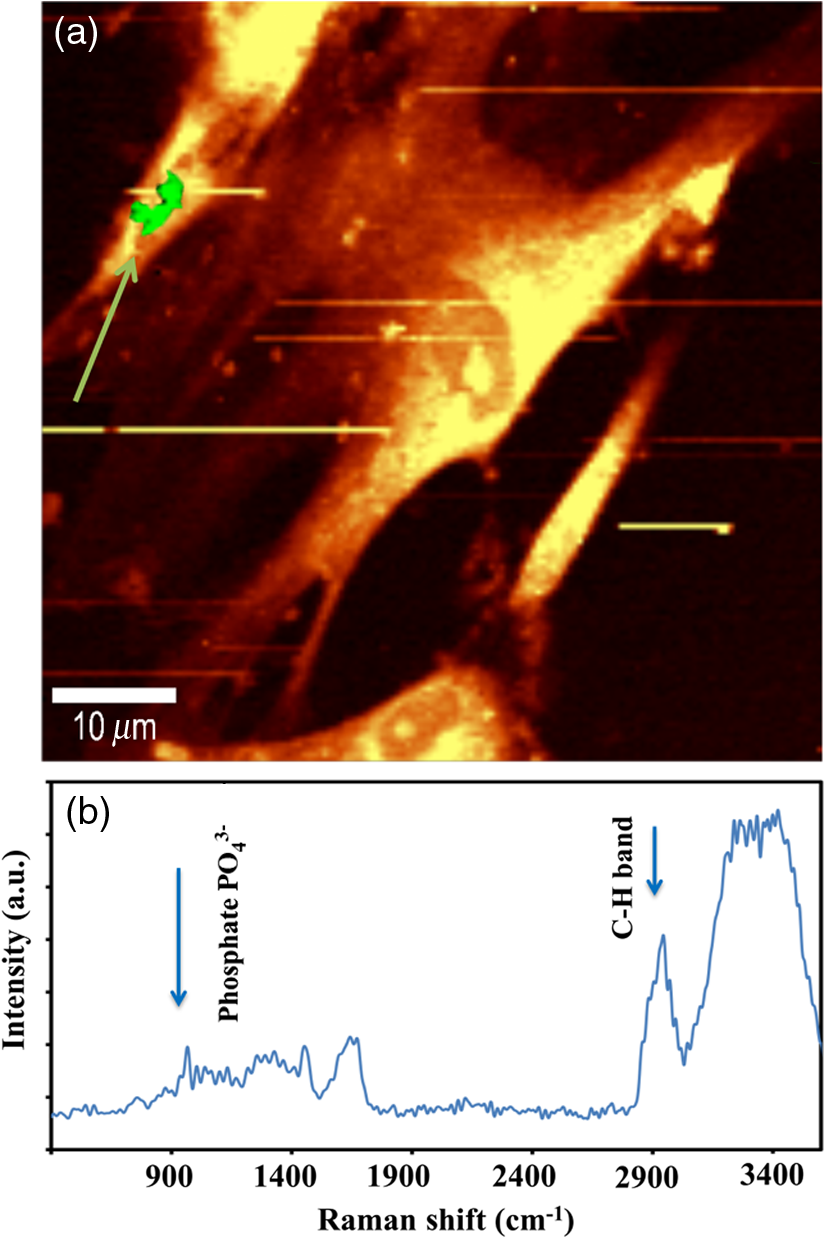 The spectrum in Fig. 3 also depicts other molecular Raman vibration modes of various cellular components, including phenylalanine at , amide I at , and carbohydrate amide I at . The phosphate signal was present in one cell only. Either the other cells are not yet differentiated or the amount of phosphate is too low to be detected. To obtain more detailed information about the extracellular matrix, a CH to phosphate ratio map is presented in Fig. 4: each pixel bearing a pseudo-color shows this ratio at a given position of the sample. We generated a line map crossing a cell to monitor the ratio: the red color at maximum corresponds to 30 times higher intensities of CH relative to that of phosphate. This ratio goes to the minimum when both ends of the line are out of the cell. The violet color belongs to the minimum ratio of CH relative to the phosphate intensities. Applying this method for a CH-to-phosphate ratio, false color chemical and line maps are provided. The advantage of calculating an organic matrix / mineral ratio map over the pure Raman spectra map is to provide fine details of the mineralized matrix around the differentiated cells. It also demonstrates that the Raman spectroscopy is a powerful instrument to measure the level of differentiation by detecting the intensity changes of mineral to organic components in DPSCs. Fig. 4(a) CH to phosphate ratio map; the red color presents the maximum ratio and the violet the minimum. (b) A dark solid line crossing a cell is traced and the graph representing the variation of the CH/phosphate ratio over the line is plotted. (c) Reconstructed Raman image of cells obtained from CH stretching mode intensities (2800 to ). (d) Reconstructed Raman image of phosphate obtained from phosphate peak ( first stretching mode) at .  The most reported collagen band is amide I, as its components reveal changes in the collagen secondary structure. The ratio of two amide sub-bands is proportional to the relative amounts of trivalent cross-link pyridinoline and divalent cross-link dihydroxylysinonorleucine. Calculating the two amide I subpeaks’ ratio provides precise information on the collagen cross-link and the matrix maturity. In order to monitor the collagen maturity that plays an important role in bone stiffness, we have measured collagen cross-linking by calculating the ratio of two amide I peak intensities (1660 and , see spectra in Fig. 2). The two parts of the amide I mode are overlapped in one larger peak. A closer look at the spectrum reveals a shoulder on the amide band. To obtain a Raman image of a selected area on the sample, the number of pixels is first chosen considering the spatial resolution. For example, on an area of , 150 lines are chosen and on each line 150 points are marked; therefore, 22,500 spectra (or pixels) are collected. Using the Witec Software, spectral images can be reconstructed choosing a specific peak (e.g., CH image or phosphate image). To achieve a collagen maturity image, we first plot the reconstructed Raman images for the two selected peaks in the amide I band (1660 and ); then we divide the two reconstructed images using Witec Plus software. Each pixel in the image is represented by a false color in Fig. 5, which shows the intensity of the selected peak (e.g., red spots show the maximum intensity for the collagen cross-link). The vertical bar next to the images defines the look-up table. Red spots show the highest Raman signal coming from the cross-linked collagen. Fig. 5(a) to (c) Collagen cross-link of the cells cultured in the osteogenic medium (days 7, 14, and 21). (d) to (f) Collagen cross-link of the cells cultured without the osteogenic medium (days 7, 14, and 21). The scale bar is [except in (d), ].  Figure 5 presents two sets of images obtained for cells cultured in osteogenic medium (days 7, 14, and 21) [Figs. 5(a)–5(c)] and without osteogenic medium (days 7, 14, and 21) [Figs. 5(d)–5(f)]. As observed in Fig. 5(a), no significant collagen cross-linking is observed after seven days of cell culture. Collagen cross-linking appears after 14 days culture in the osteogenic medium [Fig. 5(b)]; this becomes even more accentuated after 21 days [Fig. 5(c)]. The bottom line in Figs. 5(d)–5(f) shows that at 7, 14, and 21 days, cell cultivation without osteogenic medium collagen cross-linking is retarded: collagen cross-linking is observed after 21 days only [Fig. 5(f)]. Comparing the images in Fig. 5, it is obvious that cultures at day 21 (both with and without osteogenic medium) show the highest collagen cross-linking. The image presenting collagen cross-linking seems to indicate a possible relationship between collagen cross-linking and the presence of the osteogenic medium. For a more accurate statistical evaluation, a pixel intensity histograph was plotted (Fig. 6). This histograph shows the number of pixels with a specific intensity indicating the collagen cross-link index corresponding to cells presented in Fig. 5. The orange histograph belongs to the 21-day cell culture in the osteogenic medium and has the highest intensity ratios (e.g., 400 pixels with collagen cross-linking ratio of 1.4). Briefly, by plotting the histograph in Fig. 6, the numbers of pixels (frequency) with a specific intensity in the function of the pixel intensities are provided, data that are not readable with this accuracy in the ratio map in Fig. 5. The arrows show the positions of the three largest histographs bearing the highest numbers of pixels. For cells cultured 21 days in the presence of the osteogenic medium, the maximum collagen cross-link index is (a.u.), while after 14 days in the osteogenic medium, this index decreases to (a.u.). The third best result ( a.u.) was obtained for cells cultured for 21 days without the osteogenic medium. Considering the area defined by the number and intensity of pixels represented in Fig. 6, we found that the histographs corresponding to day cultures contain more spectra of cross-linked collagen. The second and third highest collagen cross-linking appears at day 14 culture with the osteogenic medium and at day 21 without the osteogenic medium, respectively. Fig. 6Pixels’ intensity histograph. Each graph presents the pixel intensities’ distribution for the corresponding image in Fig. 5 for cells cultured for 7, 14, and 21 days. The signs + and − indicate the data for cells cultured in the osteogenic medium and without the osteogenic medium, respectively. The horizontal axis “Pixels’ intensity” indicates the collagen cross-link index corresponding to cells presented in Fig. 5.  4.DiscussionIn this study, we applied confocal Raman microscopy to evaluate the differentiation of DPSCs into osteoblasts and the maturity of the produced collagen fibers. The cultured cells with and without the osteogenic medium were imaged each seventh day until day 21. The cells cultured in osteogenic medium produce phosphate after 21 days. The vibrational mode at is chosen to construct a Raman map of the phosphate that is then compared with the cells’ map obtained using CH bands (2800 to for lipids, proteins, and carbohydrates). The results enable localization of phosphate around the cells, indicating the differentiation of DPSCs into osteoblast-like cells. Cells cultured without osteogenic medium showed no phosphate sign at any day from 0 to 21. In long-term culture and in the presence of the osteogenic medium, cells are confluent, form multilayers, and hence the phosphate signal recorded around these cells is accompanied with the CH peaks of other cell layers. Collagen cross-linking during differentiation of DPSCs was monitored by calculating the ratio of two amide I peaks at 1660 and . Maximum cross-linking of collagen is observed after 21 days’ cell culture in both the absence and presence of the osteogenic medium, though the osteogenic medium is needed to produce collagen at early cell culture periods. 5.ConclusionConfocal Raman microscopy is applied to monitor DPSCs differentiation into osteoblast-like cells and maturation of extracellular matrix. We first isolate, in the measured Raman spectra, the phosphate peaks and the CH bands to provide a detailed map of phosphate produced by the cells, indicating their differentiation into osteoblasts after three weeks of culturing in the presence of the osteogenic medium. By plotting the CH/phosphate signal ratio, a detailed analysis is provided. Calculating the ratio of two amide peaks, we monitor the collagen cross-linking in cell cultures after 21 days. Our work demonstrates that confocal Raman microscopy is a powerful label-free and noninvasive imaging technique to monitor the process of cell differentiation, providing valuable insight in the organic/inorganic composition of cell cultures over long time scales (up to three weeks). However, to obtain more information, appropriate data analysis methods should be applied to the measured raw Raman spectra. Here, we trace for the first time, stem cells’ differentiation and the formation of a mature organic matrix, pointing toward promising applications of DPSCs for tissue engineering. ReferencesA. Arthur, A. Zannettino and S. Gronthos,
“The therapeutic applications of multipotential mesenchymal/stromal stem cells in skeletal tissue repair,”
J. Cell. Physiol., 218 237
–245
(2009). http://dx.doi.org/10.1002/jcp.21592 Google Scholar
T. Ma,
“Mesenchymal stem cells: from bench to bedside,”
World J. Stem Cells, 2
(2), 13
–17
(2010). http://dx.doi.org/10.4252/wjsc.v2.i2.13 Google Scholar
R. d’Aquino et al.,
“Human postnatal dental pulp cells co-differentiate into osteoblasts and endotheliocytes: a pivotal synergy leading to adult bone tissue formation,”
Cell Death Differ., 14
(6), 1162
–1171
(2007). http://dx.doi.org/10.1038/sj.cdd.4402121 Google Scholar
S. Gronthos et al.,
“Postnatal human dental pulp stem cells (DPSCs) in vitro and in vivo,”
Proc. Natl. Acad. Sci., 97
(25), 13625
–13630
(2000). http://dx.doi.org/10.1073/pnas.240309797 Google Scholar
N. M. B. K. Willems et al.,
“Determination of the relationship between collagen cross-links and the bone-tissue stiffness in the porcine mandibular condyle,”
J. Biomech., 44 1132
–1136
(2011). http://dx.doi.org/10.1016/j.jbiomech.2011.01.023 JBMCB5 0021-9290 Google Scholar
M. M. Mariani, P. J. Day and V. Deckert,
“Applications of modern micro-Raman spectroscopy for cell analyses,”
Integr. Biol., 2 94
–101
(2010). http://dx.doi.org/10.1039/b920572a 1757-9708 Google Scholar
K. E. Shafer-Peltier et al.,
“Model-based biological Raman spectral imaging,”
J. Cell. Biochem., 87 125
–137
(2002). http://dx.doi.org/10.1002/jcb.10418 Google Scholar
C. Krafft, B. Dietzek and J. Popp,
“Raman and CARS microspectroscopy of cells and tissues,”
Analyst, 134 1046
–1057
(2009). http://dx.doi.org/10.1039/b822354h ANALAO 0003-2654 Google Scholar
K. Hartmann et al.,
“A study of Docetaxel-induced effects in MCF-7 cells by means of Raman microspectroscopy,”
Anal. Bioanal.Chem., 403 745
–753
(2012). http://dx.doi.org/10.1007/s00216-012-5887-9 ABCNBP 1618-2642 Google Scholar
H. K. Chiang et al.,
“In situ Raman spectroscopic monitoring of hydroxyapatite as human mesenchymal stem cells differentiate into osteoblasts,”
J. Raman Spectrosc., 40 546
–549
(2008). http://dx.doi.org/10.1002/jrs.2161 Google Scholar
C. Matthäus et al.,
“Label-free detection of mitochondrial distribution in cells by nonresonant Raman microspectroscopy,”
Biophys. J., 93 668
–673
(2007). http://dx.doi.org/10.1529/biophysj.106.102061 BIOJAU 0006-3495 Google Scholar
M. Dominici et al.,
“Minimal criteria for defining multipotent mesenchymal stromal cells. The International Society for Cellular Therapy position statement,”
Cytotherapy, 8
(4), 315
–317
(2006). http://dx.doi.org/10.1080/14653240600855905 Google Scholar
C. Coppe, Y. Zhang and P. K. Den Besten,
“Characterization of primary dental pulp cells in vitro,”
Pediatr. Dent., 31
(7), 467
–471
(2009). Google Scholar
S. Shi and S. Gronthos,
“Perivascular niche of postnatal mesenchymal stem cells in human bone marrow and dental pulp,”
J. Bone Miner. Res., 18
(4), 696
–704
(2003). http://dx.doi.org/10.1359/jbmr.2003.18.4.696 Google Scholar
P. Kémoun et al.,
“Human dental follicle cells acquire cementoblast features under stimulation by BMP-2/-7 and enamel matrix derivatives (EMD) in vitro,”
Cell Tissue Res., 329
(2), 283
–294
(2007). http://dx.doi.org/10.1007/s00441-007-0397-3 Google Scholar
H. Salehi et al.,
“Confocal Raman data analysis enables identifying apoptosis of MCF-7 cells caused by anticancer drug paclitaxel,”
J. Biomed. Opt., 18
(5), 056010
(2013). http://dx.doi.org/10.1117/1.JBO.18.5.056010 JBOPFO 1083-3668 Google Scholar
Z. Huang et al.,
“Near infrared Raman microscopy for optical diagnosis of lung cancer,”
Int. J. Cancer, 107 1047
–1052
(2003). http://dx.doi.org/10.1002/ijc.11500 Google Scholar
BiographyHamideh Salehi received her PhD in biophysics from the University of Montpellier, and she was a postdoctoral researcher in biomedical engineering at the University of California, Irvine. She has obtained her master’s degrees in physics, photonic crystals, and mechanical engineering. Her research interests are cancer therapy with stem cells and the study of living cells treated with drugs and nanoparticles by confocal Raman microscopy and stimulated Raman spectroscopy. She also collaborated with biofilm and dental research groups. Pierre-Yves Collart-Dutilleul received his PhD degree in 2013 at Montpellier University in the BioNano Laboratory under the supervision of professor Frédéric Cuisinier. After completion of his degree of doctor in dental surgery in 2006, he got a master’s degree in cell biology and then a PhD in tissue engineering. His research focuses on dental pulp stem cells adhesion, proliferation, and osteodifferentiation on porous scaffolds, for orthopedic tissue engineering and drug delivery applications. Csilla Gergely received her PhD in biophysics, Szeged University. She is professor in Charles Coulomb Laboratory of the Montpellier University and head of the bionanophotonics team. Her research interests lie in elaborating adhesion peptides for selective biofunctionalization of photonic crystals for elaboration of semiconductors based biosensing, and developing various microscopic techniques (near-probe and multiphoton microscopy) for functional imaging and follow-up therapy of cancerous cells. She has authored 85 peer-reviewed articles and book chapters. Frédéric J. G. Cuisinier received his PhD in 1989 at Strasbourg University under the direction of professor Robert Franck and is a professor in dentistry. He authored more than 120 papers on high-resolution electron microscopy of mineralized tissues, biomineralization, biosensors, and multilayer film build-up. His current research concerns confocal Raman microscopy of living cells, multiphotonic microscopy of dental tissue, and biomaterial interactions with dental pulp stem cells. |


