|
|
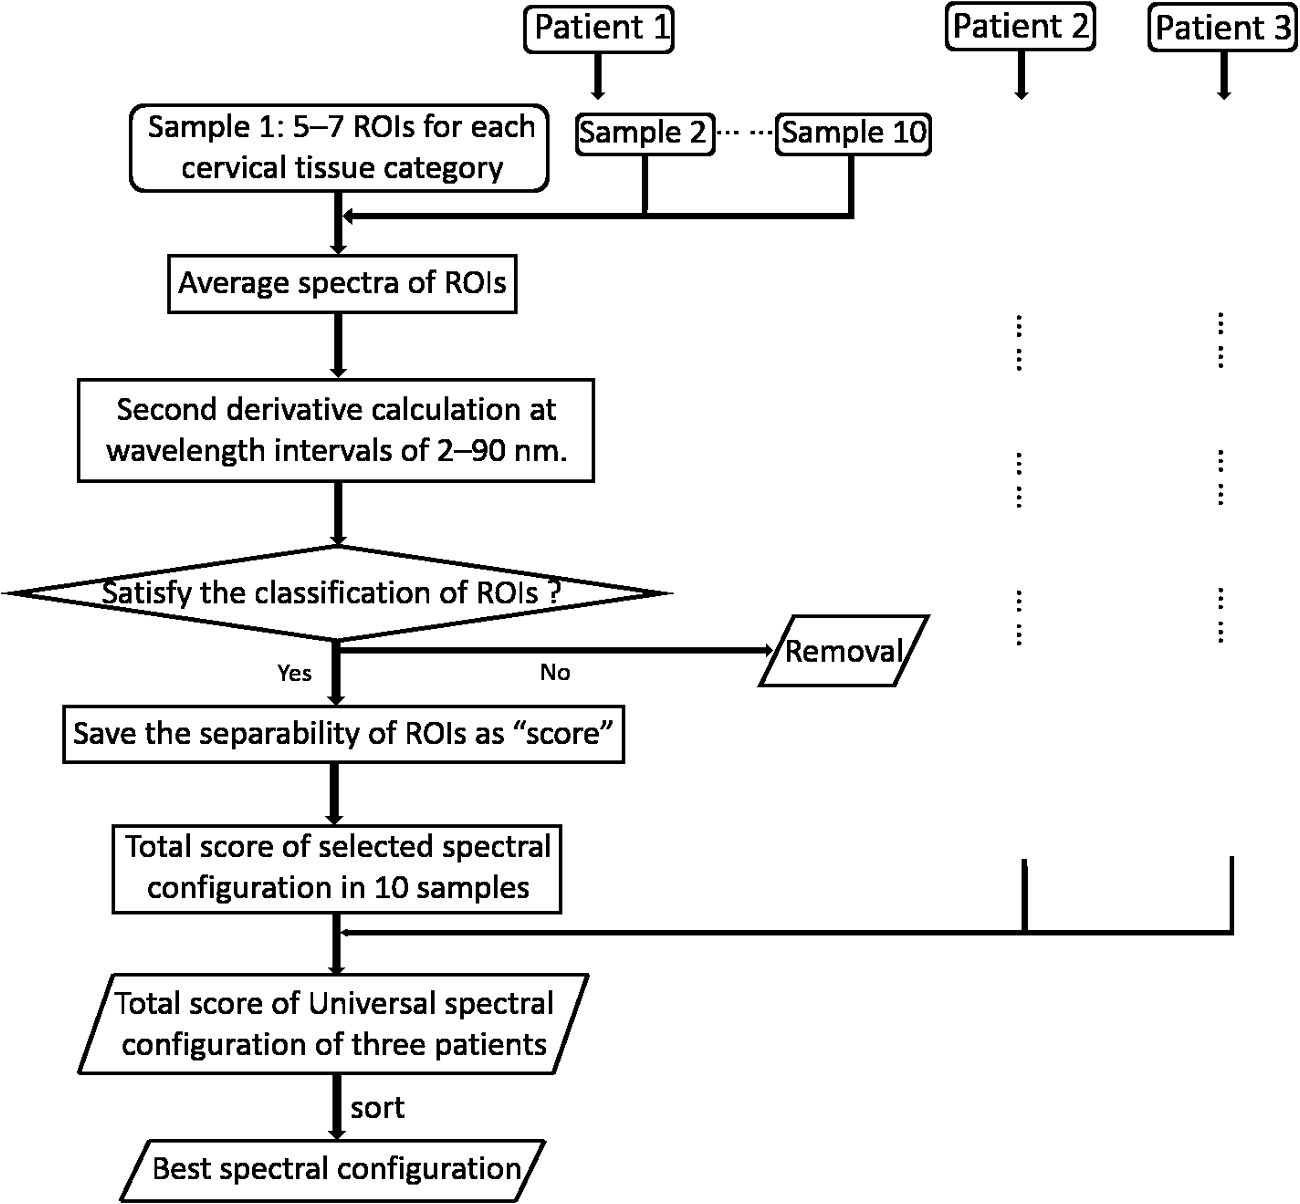
1.IntroductionCervical cancer has been the third most commonly diagnosed cancer and the fourth most common cause of cancer death in women worldwide. It has the highest incidence rate in developing countries, which is attributable to the lack of infrastructure and resources.1 Cervical cancer begins with dysplastic precancerous changes, termed cervical intraepithelial neoplasia (CIN). The transition from cervical lesions to CIN usually takes several years, but cancer outbreak can occur in less than a year. However, if detected early and treated adequately, cervical cancer is also one of the most treatable and absolutely avoidable cancers. One of the commonly used methods for early detection is colposcopy, followed by a Papanicolaou (Pap) smear.2 To facilitate further clinical decision for suspected tissue anomalies, follow-up examinations may be prescribed within several weeks. Moreover, the conventional examination method is heavily dependent on the physician’s personal experience and subjective evaluations, which can lead to unnecessary biopsies, additional costs, increased risks of infection, discomfort, and even delayed treatment.3 Therefore, it is important to develop a rapid and objective cervical examination tool that can effectively minimize variables of the examiners and improve reliability. Optical imaging techniques in combination with automated image analysis have been proposed for noncontact and noninvasive in vivo tissue detection, providing high sensitivity and specificity.4,5 Hyperspectral imaging techniques characterize tissue functional and molecular properties by acquiring high-resolution imaging data in a continuous wavelength range. For decades, hyperspectral spectroscopy has been used to reveal characteristic optical contrasts between normal and dysplastic cervical tissue. Masilamani et al. analyzed and compared the fluorescence emission spectra between normal and dysplastic cervical tissue, and they provided a general discussion concerning the application of hyperspectral spectroscopy in cervical neoplasia detection.6,7 But fluorescence spectroscopy in the diagnosis of cervical cancer was usually based on point monitoring using a probe. Point monitoring may be susceptible to noise, and it also ignores the spatial structure of tissue. Obtaining diffuse reflectance after the application of acetic acid is another general observation method. Liang et al.8 observed temporal changes in the red and green channels of colposcopy images before and after a diluted solution (3% to 5%) of acetic acid was applied. Lange9 developed an automatic detection method, dividing cervical acetowhitening images into multilevel regions. However, the reaction is temporal and unstable, it ignores the original spectral changes caused by component changes in dysplastic cervical tissue. Diffuse reflectance imaging techniques have been used for noninvasive and in vivo detection of endogenous biomarkers in cervical tissue without any additional contrast agents. However, owing to its unique anatomic structure, accurate differentiation between normal and dysplastic cervical tissue in a large cervical surface area is hindered by nonuniform illumination conditions. To avoid this problem, Thekkek and Richards-Kortum10 used a fiber optical probe to collect cervical diffuse reflectance without imaging capability. Gustafsson et al.11 acquired the entire cervical hyperspectral reflectance data cube and demonstrated the spectral difference for different lesion types but did not explain the method they used to eliminate the effect of nonuniform illumination or further analysis for tissue classification. In this paper, we propose an image processing procedure to classify cervical tissue into normal, inflammation and high-grade (HG) lesion (CIN 2 or 3) types by wide gap second derivative spectral analysis and image segmentation. One advantage of wide gap second derivative spectral analysis method is its relatively lower sensitivity to nonuniform illumination condition and nonspecific background absorption.12 The technique has been used to extract useful signals from nonspecific background data, as it detects the signatures in continuous absorption and scattering spectra.12–15 Therefore, second derivative spectral analysis is an ideal method for in vivo detection of spectral characteristics in cervix anomalies. Considering that sequential imaging and processing of too many wavelengths in hyperspectral imaging is very time consuming, we introduced the wide gap spectral analysis method to reduce the involved wavelength number and shorten the image processing time. Since the wide gap second derivative spectral analysis method eliminates need for the bulky and costly hyperspectral imaging system, it is especially suitable for detecting cervical anomalies in developing countries with limited resources. For rapid diagnosis and cost reduction, we adopted a specific spectral configuration with superior capability of tissue classification, minimal number of the required wavelengths, and sufficient sensitivity and specificity. In order to define this specific spectral configuration, a training data set was used to calculate the second derivative spectral values at different wavelengths and various wavelength intervals. A filter was designed to identify the optimal wavelength set for the maximal spate of different tissue classes. In our preliminary experiment, wide gap multispectral images were acquired at the wavelengths of 620, 696, and 772 nm with an interval of 76 nm. A minimum distance (MD) method was used for segmentation and classification of the cervical image into three anticipated categories. The experimental results verified the potential usability of the wide gap second derivative spectra in HG cervical disease screening and it may be generalized to provide an accurate, real-time, low-cost diagnosis for various tissue diseases. 2.Materials and Methods2.1.Hyperspectral Imaging SystemWe used an acousto-optic tunable filter (AOTF) hyperspectral imager (Brimrose, Sparks, Maryland) to acquire the hyperspectral image data. This AOTF hyperspectral imager has been used for optical characterization of various biological tissue types. For example, Martin et al.16 used the system to acquire fluorescence and reflectance hyperspectral images for the early detection of esophageal cancer. Arnold et al.17 evaluated the system clinically and verified its ability to detect dysplastic tissue. In our study, the working wavelength range of the AOTF system was adjusted from 500 to 900 nm. A 500-W Xenon light source was used for the low pass rates of AOTF.18 The experimental setup for the clinical trial is illustrated in Fig. 1 and the test device is described in our previous report.19 The reflectance image of cervical tissue was captured by a monochrome charge-coupled device camera (JAI Apparatus, Japan), which is a 16-bit, high-resolution imaging sensor ( with a pixel size) with supporting frame rates of . The spectral analysis and image processing results were obtained through MATLAB software (Mathworks Inc., Natick, Massachusetts). Fig. 1Schematic view of the integrated hyperspectral imaging system for high-grade (HG) lesion detection. 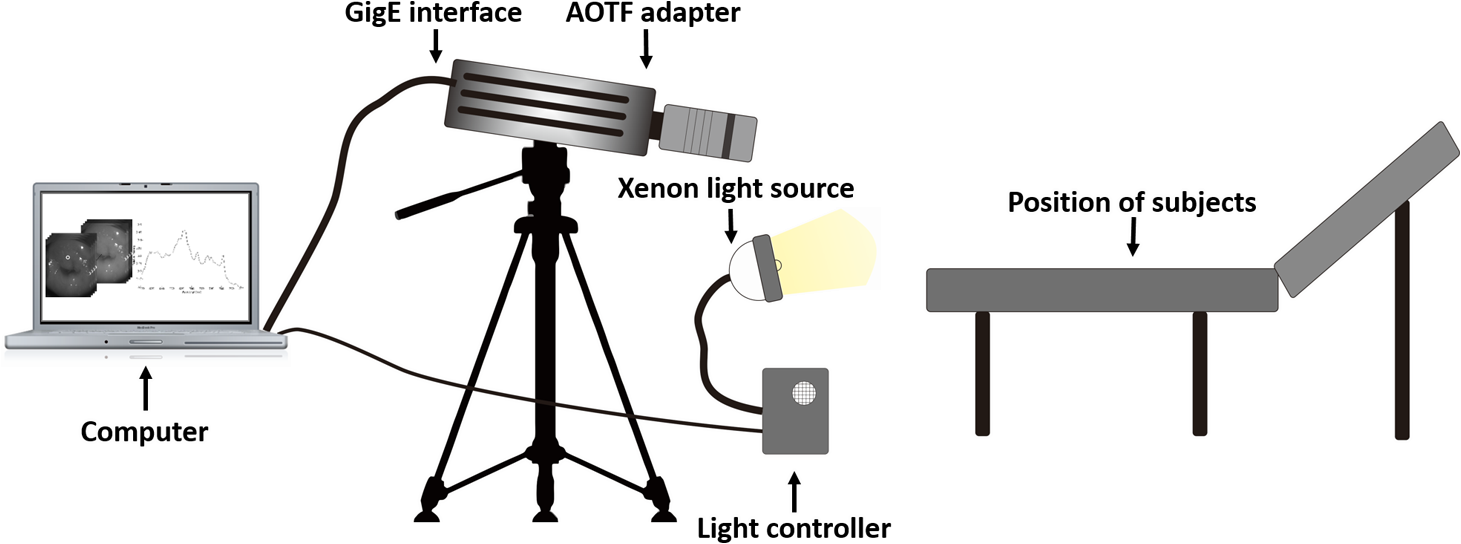 Hyperspectral image data are characterized by a hyperspectral cube containing spatial information in two dimensions and spectral information in the third dimension. As shown in Fig. 2, the vertical axis indicates the relative intensity of different wavelengths illuminated by the same light source. The wavelengths we used in each reflection imaging spanned from 600 to 800 nm at an interval of 2 nm. 2.2.Clinical Data CollectionThe clinical data were collected in a clinical trial approved by the Institutional Review Board (IRB) of the Second Affiliated Hospital of Chongqing Medical University (IRB No: 2013KLS002). Generally, the cervical tissue with HGCIN always includes different tissue types, such as normal, inflammation, and CIN. We regard pathological results as the gold standard to confirm the distribution of these tissue types. Based on their abnormal results in a Papanicolaou (Pap) smear or cervical ThinPrep cytologic test, patients who had scheduled biopsies were recruited for this study before the biopsies were carried out. Hyperspectral reflectance images were acquired before the routine colposcopy examinations. A vaginal speculum was inserted by a nurse and the surface of the cervix was gently cleaned with a cotton swab to remove mucus in order to reduce the interference in spectral imaging. The hyperspectral imaging system was coordinated at a proper position to record hyperspectral images from 600 to 800 nm. Each imaging process took 10 s. In our clinical trial, a white polytetrafluoroethylene (PTFE) board in a round container was placed on the surface of cervix. The board had a near-unity reflectance and was used to eliminate inconsistent exposure time. If the board was large enough to cover the entire cervix surface, then we could solve the problem of nonuniform illumination simply by correcting the data with the spatial reflectance on the board, but this was difficult to achieve in vivo. Two sets of spectral images were taken using the same exposure time and at the same position, one of them with the PTFE board on the surface. After acquiring a series of cervical reflectance images of multiple wavelengths, the subject received a routine colposcopy. A diluted solution (3% to 5%) of acetic acid and Lugol’s iodine solution was successively applied to the cervix. In acetowhitening, the metaplastic epithelia turns white following the application of acetic acid, whereas normal cervical epithelia remains pink.20 Liang et al.8 analyzed the acetowhitening phenomenon at different time intervals and monitored the reflectance changes of normal and dysplastic cervical tissue. However, although applying acetic acid rapidly enhances the differences in appearance between normal and dysplastic tissue, it is difficult and unstable to study. Lugol’s stain is another widely used visual inspection method for cervical cancer screening.20 Iodine is absorbed by normal cervical cells, coloring the tissue surface from healthy pink to dark brown or black. However, Iodine cannot be absorbed by abnormal cells, leading to yellow or “unstained” areas. The acetowhitening image and iodine staining image are all recorded by clinical digital colposcopy (SLC-1000B, Goldway Apparatus, China), respectively. Upon completion of the hyperspectral scan and colposcopic examination, the diagnosis is followed by a biopsy. Clinicians will refer to the cervical digital colposcopy images of acetowhitening and iodine staining and then take biopsies at suspicious sites and label them. Biopsy tissue samples were sent to pathology department and made into sections followed by microscopic diagnosis by pathologist. The lesion level is usually graded by the basal proportion of epithelium occupied by abnormal cells.21 HG CIN is confined to the basal two-thirds or above of the epithelial thickness. Finally, the pathologist makes a confirmed diagnosis and determines the lesion level. The clinical colposcopy and biopsy results provided a standard comparison and evaluation for our proposed algorithms. Based on the clinical protocol in the study, only potential patient can be enrolled for the hyperspectral imaging. Therefore, we have not included a control group in the clinic trial. Finally, six patients were enrolled in the hyperspectral imaging clinical trial. Among them, two patients yielded overexposed hyperspectral images and one patient had a large amount of secretion on the cervical surface that blocked the field of view. Therefore, only the spectral data from three subjects were finally used for spectral analysis and tissue classification tasks. 3.Spectral Analysis and Image Processing3.1.Data CorrectionAs mentioned above, we took two sets of cervical hyperspectral images for each subject, and the raw data were corrected using a PTFE board and a dark current to remove the interferences of inconsistent exposure time among bands. The PTFE board was calibrated in advance by a standard reference material 2044 NIST traceable white diffuser (NIST, Gaithersburg, Maryland). The dark current was acquired by keeping the lens covered during exposure. The corrected reflectance is expressed as in the following equation: where is the mean value of a region of interest (ROI) selected manually on the surface of the PTFE board, shown as the black rectangle in Fig. 3(a). denotes the raw cervical image data without the PTFE board at 696 nm, as shown in Fig. 3(b), and the relative reflectance data were corrected with the absolute reflectance of the PTFE board and dark current by Eq. (1). Figure 3(c) shows the corrected image at the same wavelength. Figure 3(d) shows the corrected reflectance spectrum compared with the raw spectrum, corresponding to the mean value of the ROIs in Figs. 3(b) and 3(c), respectively.Fig. 3Spectral data showing all of the reflectance images at 696 nm: (a) the raw cervical image with a polytetrafluoroethylene (PTFE) board on the surface, (b) the raw cervical image without the PTFE board, and (c) the corrected image according to Eq. (1). (d) The reflectance spectra before and after correction by the PTFE board. Each data point in the spectra corresponds to the reflectance value averaged within the marked ROI in (b) and (c). 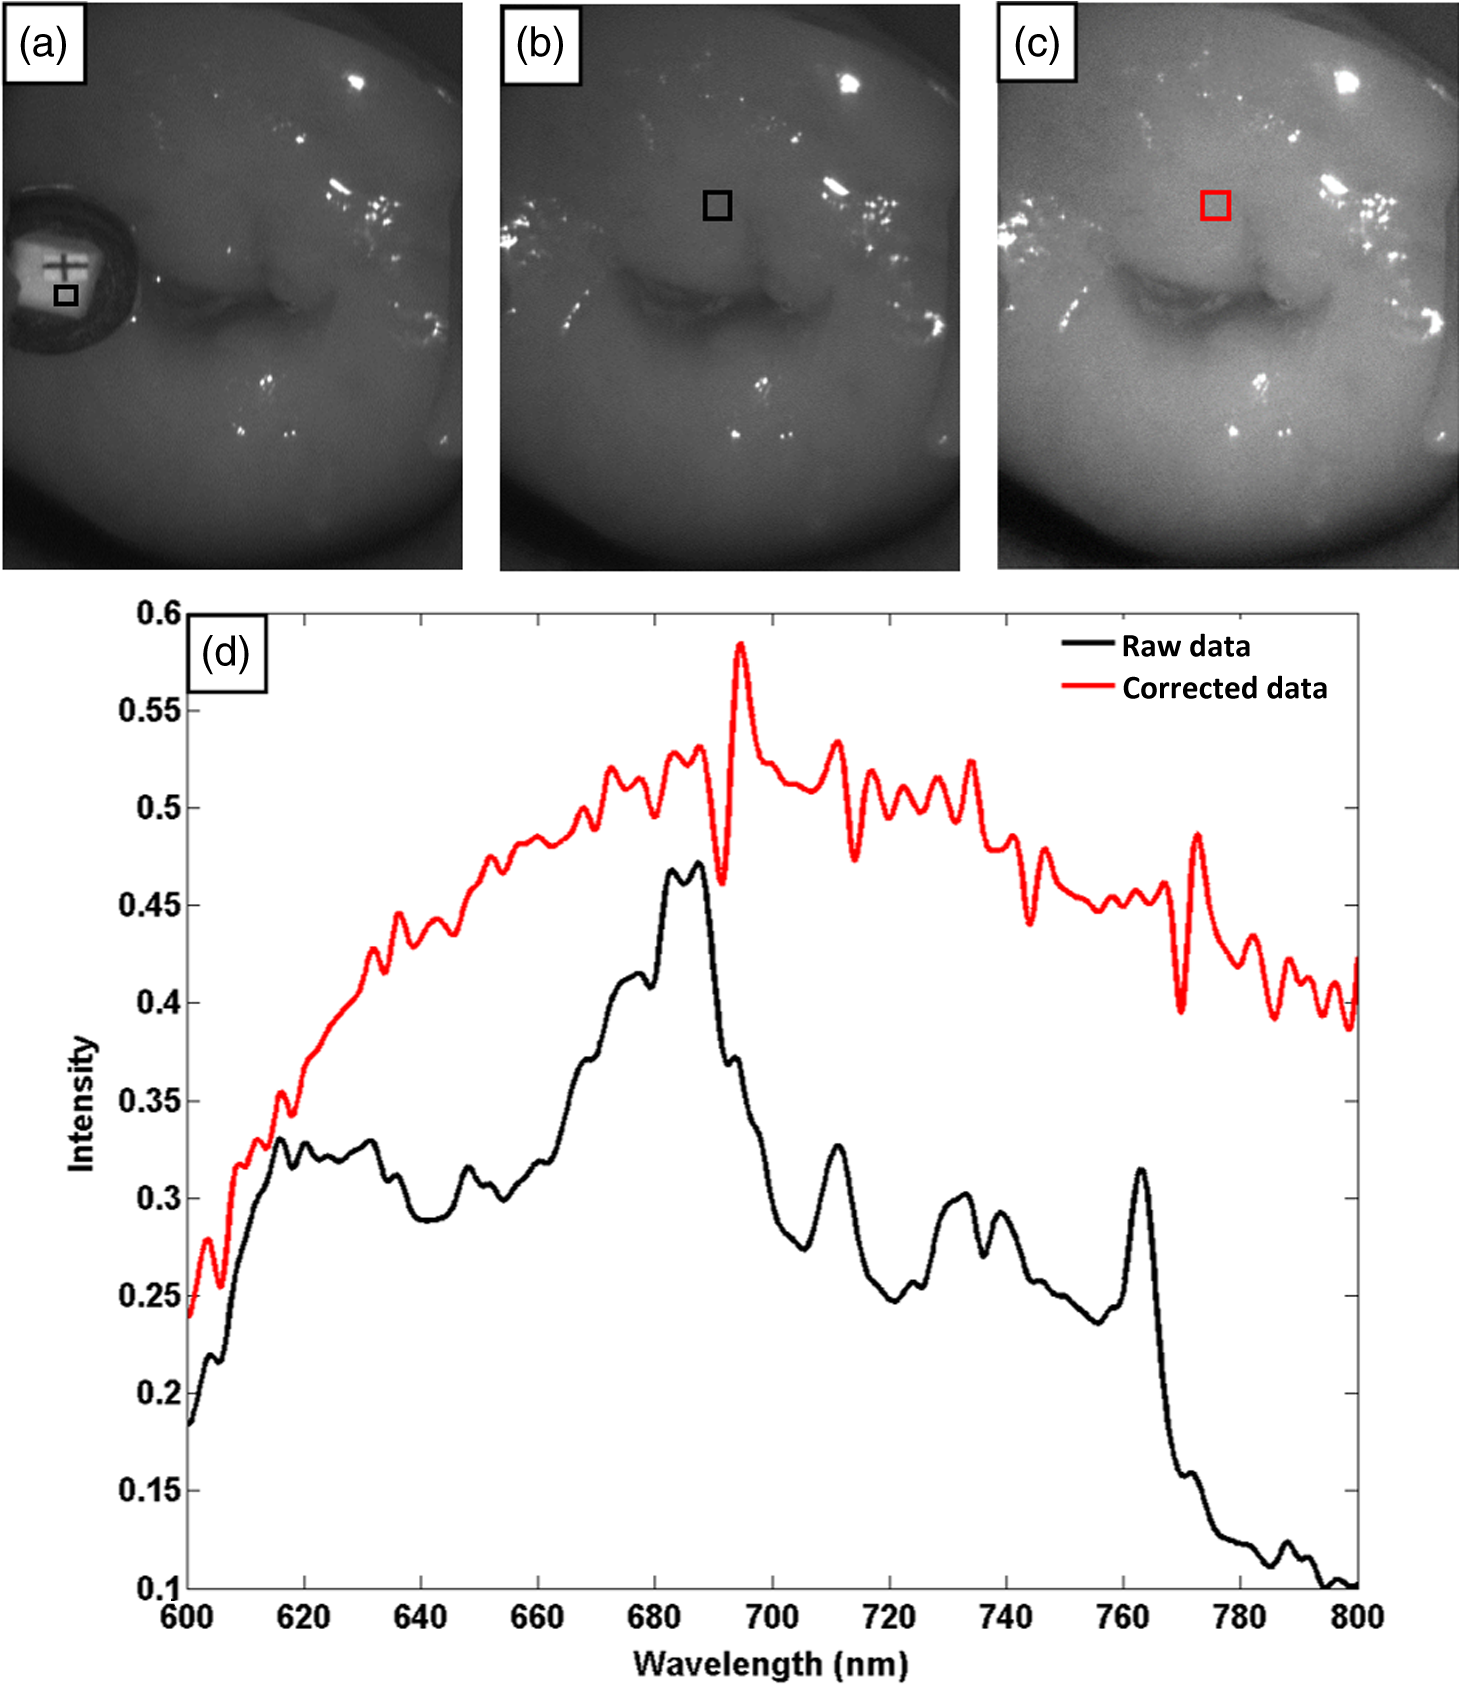 3.2.Issue of IlluminationThe data correction process with the PTFE board had the ability to eliminate the inconsistent exposure time and Fig. 4 shows the corrected reflectance of different cervical tissue types. One group of two spectra with the same color indicates the same category of the cervical tissue, which was selected depending on the biopsy results in combination with the clinician’s experience. The mean values of ROIs identified by different marker types in Fig. 4(a) were calculated and are shown in Fig. 4(b), which displayed interlaced reflectance characteristics. It was difficult to observe and determine the differences between these reflectance spectra based on original characteristics. Conventional segmentation algorithms, such as Mahalanobis distance, maximum likelihood, k-means, etc., always require significant features among clusters, which are difficult to directly use. Considering that the spectral spikes in Fig. 5(b) were caused by measurement noise instead of actual spectral characteristics, data smoothing was used before further imaging analysis. Fig. 4(a) Reflectance image at a single wavelength. The markers belonging to different tissue types in the image were selected depending on biopsy results in combination with the clinician’s judgment. Different marker types with blue, green, and red indicate normal, inflammation, and HG lesion area on the cervical tissue, respectively. (b) Averaged reflectance spectra after correction for the corresponding markers labeled with the same color in (a).  Fig. 5(a) Reflectance image of PTFE board at 696 nm and the markers on the surface were selected manually. (b) Averaged intensity of ROIs was identified by different markers in (a). The intensity variation of different ROIs was difficult to be detected by eyes in (a). 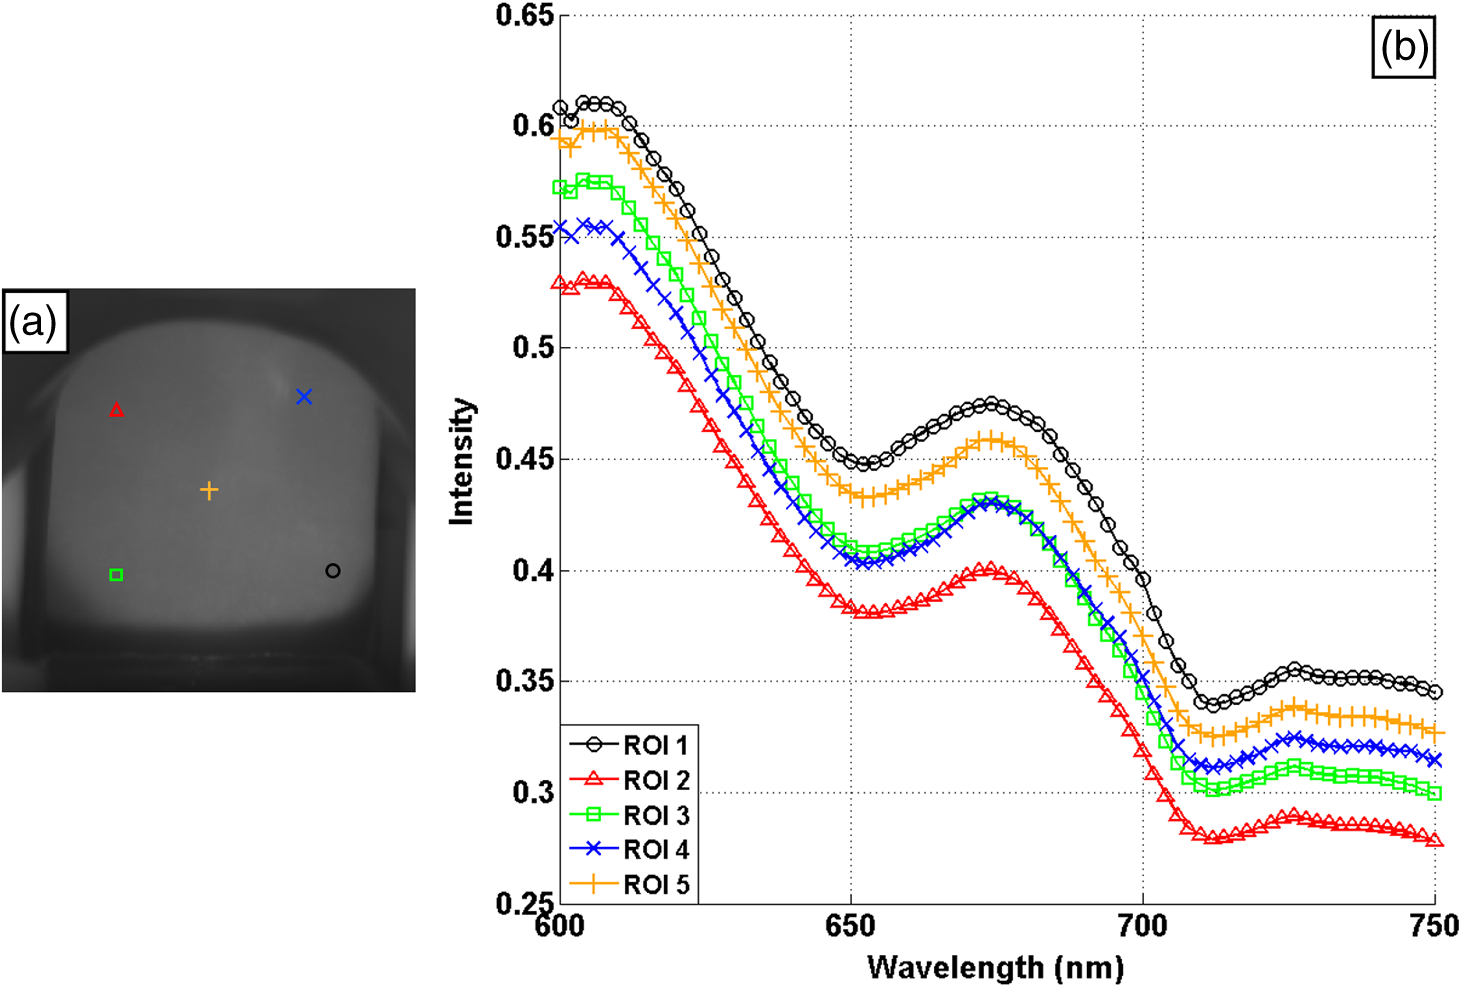 The reflectance spectral differences for different tissue types may be also induced by the nonuniform illumination condition. In order to evaluate the contribution of the nonuniform illumination condition, a PTFE board was cut to the cervical tissue size and placed in a human cervical model to simulate the illumination condition in the clinical trial, as shown in Fig. 5(a). Multiple ROIs were selected at different locations of the PTFE board surface, as identified by different marker types and colors. The mean intensity of these ROIs in Fig. 5(a) was calculated and is shown in Fig. 5(b). According to Fig. 5(b), the ROIs in different positions showed a superposition of intensity caused by nonuniform illumination. This measurement bias caused by a nonuniform illumination condition can be effectively reduced by our second-derivative spectral analysis method, as is discussed later. 3.3.Spectral AnalysisDerivative spectral analysis methods may effectively reveal the subtle details and minimize the effect of nonuniform illumination.14 Among different derivative spectra, the first and the second derivatives are most commonly used. In this paper, the second derivative spectrum was used because of its lower sensitivity to illumination variations.12 The derivative spectra were calculated by dividing the difference of intensity values between spectral bands by the wavelength interval separating them. On the other hand, Mark and Workman15 did not use the denominator term of the derivative calculation to observe derivative values changes with different wavelength intervals. For the approximate calculation of the second derivative spectrum in this study, the intensity values of three wavelengths were used: where is the wavelength interval and is defined as a constant. Derivative spectroscopy is quite susceptible to measurement noise, and exaggerating in Eq. (2) can reduce noise effects.13,15 Therefore, the method called wide gap second derivative was used to reduce imaging artifacts caused by nonuniform illumination and background absorption in this study. We selected an appropriate larger interval of 60 nm to calculate the second derivative values of Fig. 6(b), and Fig. 6 shows that the wide gap second derivative analysis effectively reduces the measurement bias caused by nonuniform illumination conditions. In comparison with greater than 30% variations in the reflectance spectra, the location-dependent variations in the second derivative spectra were controlled within 10%. On the other hand, the common image compensation techniques, for example, histogram equalization, homomorphic filter and Retinex, etc., are always applied for a single image;22,23 they may introduce new noise and change the spectra features if they are applied for hyperspectral images.Fig. 6Wide gap second derivative spectra of the corresponding spectra in Fig. 5(b) with a wide gap of 60 nm. The value variations are controlled in 0.01, which shows an effective decrease in nonuniform illumination reduction. 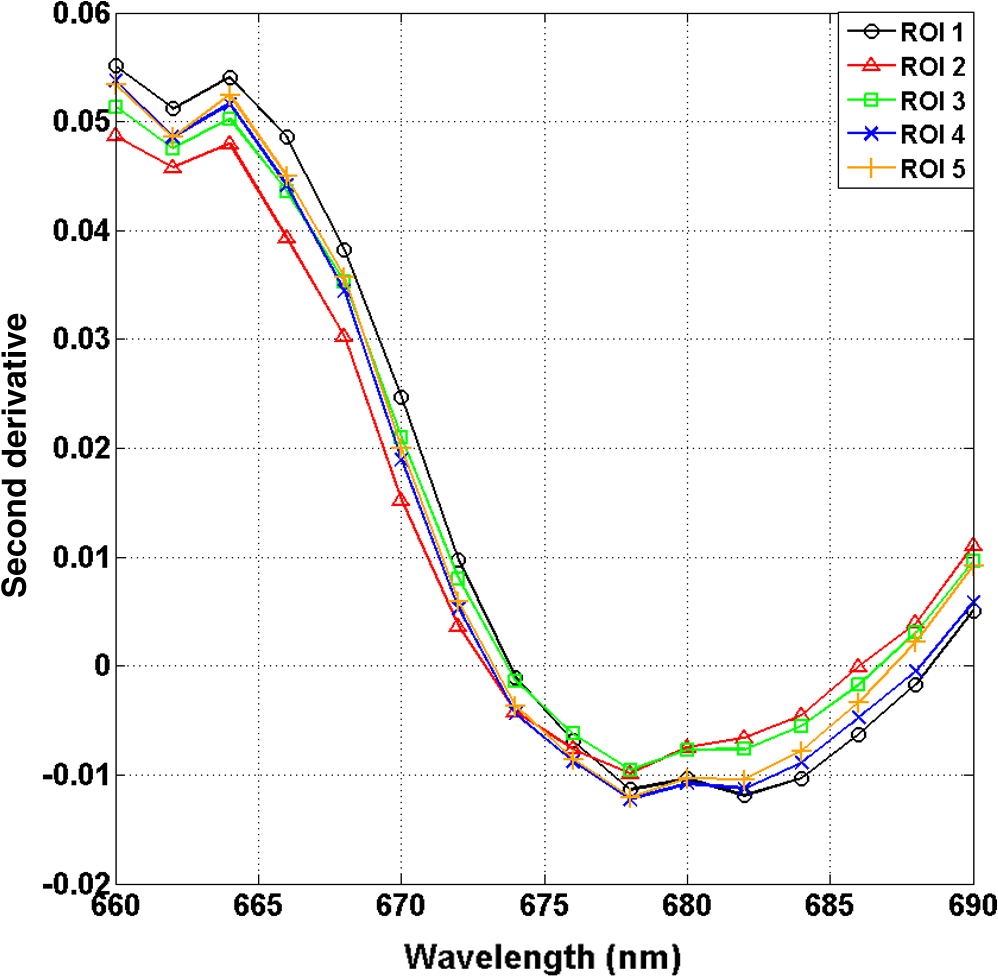 The wavelength interval needs to be optimized in second derivative differential spectral analysis in order to improve the reliability for tissue classification.13,15 An optimization algorithm was developed to screen for tissue differentiation with high sensitivity, high specificity and minimal number of the required wavelengths. The flowchart of the algorithm is shown in Fig. 7. All the calculation were based on the correct pathological results, which provided the selection gist for the ROIs. According to the pathological results, we selected five to seven ROIs on cervical images for each cervical tissue category as training samples. In order to acquire reliable outputs, we selected 10 sets of ROIs for each patient and their averages were calculated for further processing. After necessary smooth processing, the program based on MATLAB took various intervals from 2 to 90 nm with the corresponding three wavelengths to create a large synthetic data set for the screening filter. After this process, the separability of ROIs was conducted based on the difference between interclass distance and intraclass variance as the “score” of spectral configuration.22,23 In combination with the calculation of three patients, the total score of universal spectral configuration for three patients was shown in Fig. 8, where the center wavelength is denoted as “CW” and the wavelength interval is denoted as . Based on this analysis, the optimal configuration of and was derived out of 61 spectral configurations. Fig. 8The sorted total score of spectral configuration. “CW” is short for the center wavelength in the calculation of the second derivative. The highest score of and means that the wavelengths 620, 696, and 772 nm with a specific wide gap of 76 nm emerged as the optimal selection. 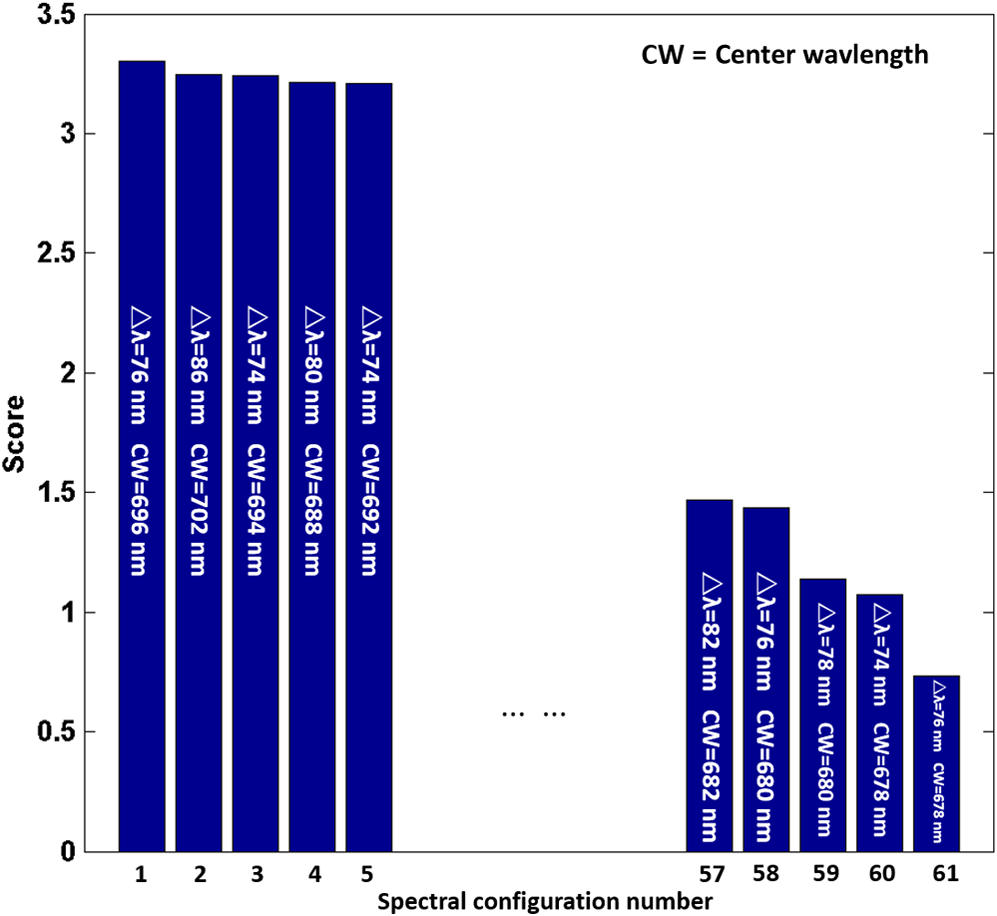 The above optimal wavelength parameters were then applied to the analysis of hyperspectral images. Figures 9 and 10 show the effectiveness of wide gap second derivative analysis with the optimal wavelength set and interval. After the second derivative calculation with a wavelength interval of 76 nm, the disordered spectra in Fig. 4(b) were regularly rearranged in many wavelengths, especially around 696 nm as in Fig. 9. Fig. 9Wide gap second derivative spectra of the corresponding averaged reflectance spectra in Fig. 4(b). The wavelength interval used for calculation was 76 nm. The arranged regularly spectral values at 696 nm could be used for further tissue classification.  Fig. 10.(a) The average reflectance values within the ROIs from three patients were acquired at 696 nm. (b) The normalized second derivative values derived from the same ROIs using the selected wavelength set of 620, 696, and 772 nm, with a wavelength interval of 76 nm. 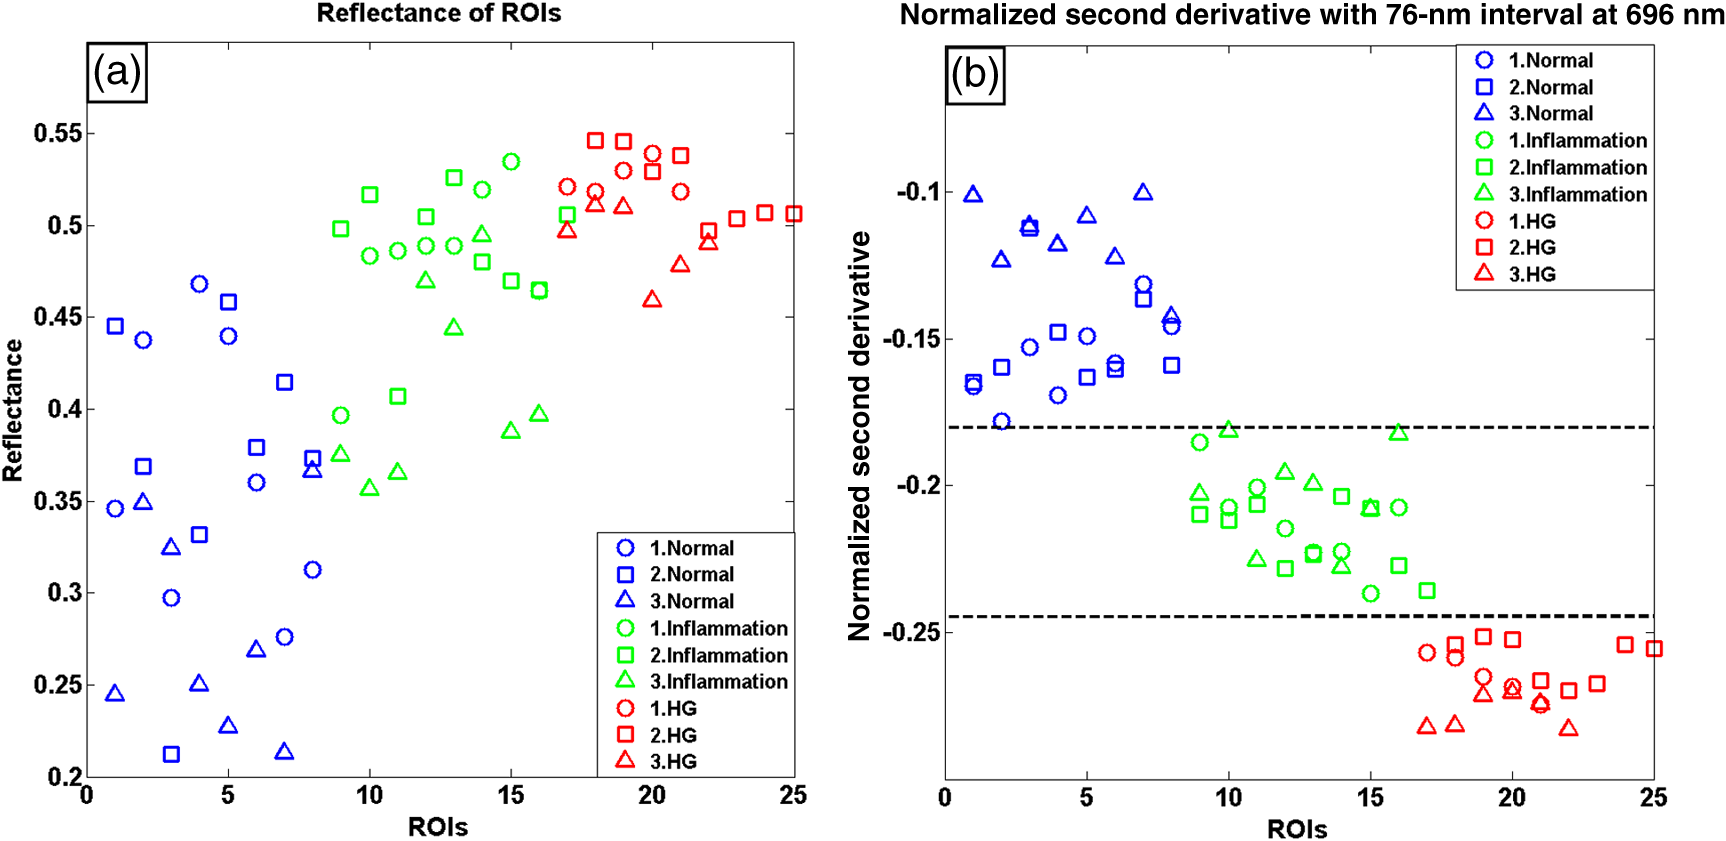 Figures 10(a) and 10(b) illustrate the second derivative values at the selected cervical locations from three patients. Data from different patients are labeled with different data markers and those of different tissue types are labeled in different colors. Figure 10(a) shows the reflectance values averaged in the selected ROIs from three patients at 696 nm. According to the figure, different tissue types cannot be effectively differentiated based on the reflectance values. Figure 10(b) shows the same data set after wide gap second derivative analysis and normalization using the selected wavelengths: 620, 696, and 772 nm with a specific wide gap of 76 nm. As the dashed lines indicate in the figure, different tissue types can be effectively classified based on the specific second derivative spectral value. 3.4.Image SegmentationAfter the reflectance spectrum were processed and the wavelength combinations were screened by the algorithm proposed above, the used wavelengths from 600 to 800 nm were narrowed to several specific wavelengths for classification, which also greatly reduces the associated cost and operation time. Three data sets of hyperspectral images acquired from the corresponding patients were studied in this paper. Based on the wide gap second derivative algorithm, only three spectrum images were used in the following image classification processing, and they were processed to generate a computed image by Eq. (2). It can be clearly observed in Fig. 10(b) that the distance between clusters was obvious. Therefore, we adopted an MD segmentation algorithm based on the Euclidean distance.24 This segmentation process can be expressed as Here, is the wide gap second derivative value of each pixel of the computed image and is the training data of three tissue types, where indicates the index of the three different tissue categories. is the distance calculated by and three different values of . indicate that the is classified to the corresponding category by evaluating the minimum value .4.Results and DiscussionAn imaging processing procedure that combines a wide gap second derivative spectral method and a segmentation algorithm was developed to classify cervical tissue into three categories of normal, inflammation and HG lesion. Figure 11 shows the experimental results for three patients. Fig. 11Image classification results for patients (a), (b), and (c) with HG lesions. (a1), (b1) and (c1): Digital colposcopy images after the application of 3% to 5% acetic acid. The black circles, drawn by an experienced surgeon, denote the HG lesion areas. The area divided by the red line indicates the portion of nabothian cysts. (a2), (b2), and (c2): Digital colposcopy images after the application of Lugol’s iodine. (a3), (b3), and (c3): Reflectance image of a single wavelength at 696 nm. (a4), (b4) and (c4): Classification results.  Figures 11(a1), 11(b1), and 11(c1) are digital colposcopy images of these patients after the application of 3% to 5% acetic acid. The suspicious regions as marked by black circles in these figures were identified by an experienced surgeon for further biopsy. Figure 11(a1) shows the bleeding dysplastic tissue caused by the removal of mucus and residue as well as the stimulation of acetic acid. Therefore, a cotton swab was gently applied to the bleeding tissue in order to ensure appropriate data collection and clinical judgment. Figures 11(a2), 11(b2), and 11(c2) are digital colposcopy images of the patients after the application of Lugol’s stain; the presence or lack of stain is obvious in these figures. Figures 11(a3), 11(b3) and 11(c3) show the multispectral reflectance images acquired from the three patients. Following the second derivative spectral method and the classification algorithm as described before, the cervical tissues are classified into three categories of normal, inflammation, and HG lesion, as shown in Figs. 11(a4), 11(b4), and 11(c4). The classified HG lesion areas are highlighted in red, corresponding to the suspicious areas previously identified by the surgeon and marked in black circles [Figs. 11(a1), 11(b1), and 11(c1)]. The biopsy results further confirmed the HG lesion status for the cervical tissue in these black circled areas. These results demonstrate the clinical effectiveness of our proposed algorithm in identifying suspicious malignant regions. It is worth mentioning that many nabothian cysts can be observed on the cervical surface, as labeled by red lines in Fig. 11(b1). Nabothian cysts are a common symptom of cervical inflammation that cannot be stained by iodine, as shown in Fig. 11(b2). The presence of these cysts does not affect the classification results by our algorithm. We believe that the primary biomarker that affects the spectral sensitivity of cervical tissue at 600 to 800 nm is oxyhemoglobin. Previous studies have demonstrated that oxyhemoglobin is a primary absorber in cervical tissue.10,25–27 Hornung et al.28 showed that the averaged hemoglobin oxygen saturation () in dysplastic sites was lower than that in normal sites ( versus ), but the difference was not statistically significant. Figure 12(a) has also shown that oxyhemoglobin has a low extinction coefficient at around 696 nm.29 Figure 12(b) shows our experimental data after smoothing. The extinction coefficients of oxygenated hemoglobin reach a minimum at 696 nm, corresponding to the maximal diffuse reflectance level at that wavelength. These results indicate the role that oxyhemoglobin plays in the reflectance spectra of cervical tissue. Fig. 12Influence of oxygenation. (a) The molar extinction coefficients of oxygenated hemoglobin change with wavelengths. The extinction coefficients of oxygenated hemoglobin reach their minimum at around 696 nm and (b) the smooth data of different types of cervical tissue reflectance which have maximal diffuse reflectance level at a wavelength of 696 nm. These figures illustrate the effect of oxyhemoglobin in cervical tissue.  In addition to the absorption properties of cervical tissue, scattering is primarily affected by collagen fibers, organelles and cell nuclei.26 Different cervical lesion types have different concentrations of scatters, leading to variations in diffuse reflectance spectra. The dysplasia in the cervix is usually accompanied with increased epithelial thickness and nuclear-cytoplasmic ratio. Therefore, tissue with HG precancer commonly comes with an increased scattering in the epithelium.30,31 In the study of Collier et al.,32 the scattering coefficients of cervical HG epithelium () were higher than normal epithelium (). Pavlova et al.33 had also reported that the density of collagen fibers decreased approximately half in cervical HG stroma, which might affect light scattering. Based on these studies, Weber et al.31 summarized that the scattering in cervical HG epithelium was increased by a factor of 3 relative to normal tissue. However, the scattering in the stroma was decreased by a factor of 0.75 relative to normal tissue. Furthermore, in Hornung’s research, the ratio of the scattering coefficient of HG lesions (CIN 2 or 3) and normal tissues was decreased at 674, 811, 849, and 956 nm. Thus, we inferred that the ratio from 696 to 800 nm was gradually reduced, corresponding to the difference in the declining rate of reflectance after 696 nm for HG lesions and normal tissue. As we know, the method of the second derivative can be used to detect the rate of change in the progress curve.34 We may further infer that the reflectance changes identified at 620, 696, and 772 nm are associated with the changes in oxyhemoglobin concentration and scattering in cervical tissue. 5.Conclusions and Future WorksWe propose a mathematical method that uses hyperspectral wide gap second derivative analysis and image classification for in vivo detection of cervical neoplasia. This method may effectively reduce the imaging artifacts caused by nonuniform illumination and background absorption. Furthermore, with second derivative analysis, only three specific wavelengths (620, 696, and 772 nm) are needed for tissue classification with optimal separability. The clinical feasibility of the proposed image analysis and classification method was preliminarily tested in a clinical trial, where cervical hyperspectral images from three patients were used for classification analysis. Our study results show that in vivo and noninvasive detection of cervical neoplasia without acetic acid is technically possible. Further clinical research is needed in order to establish a large-scale database and to verify the sensitivity and specificity of the tissue classification technique for in vivo detection of cervical neoplasia and various other tissue anomalies. AcknowledgmentsThis project was partially supported by the National Natural Science Foundation of China (Nos. 81271527 and 81327803) and the Fundamental Research Funds for the Central Universities (No. WK2090090013). ReferencesA. Jemal et al.,
“Global cancer statistics,”
CA Cancer J. Clin., 61
(2), 69
–90
(2011). Google Scholar
D. Saslow et al.,
“American Cancer Society, American Society for Colposcopy and Cervical Pathology, and American Society for Clinical Pathology screening guidelines for the prevention and early detection of cervical cancer,”
CA Cancer J. Clin., 62
(3), 147
–172
(2012). Google Scholar
J. T. Cox, M. Schiffman and D. Solomon,
“Prospective follow-up suggests similar risk of subsequent cervical intraepithelial neoplasia grade 2 or 3 among women with cervical intraepithelial neoplasia grade 1 or negative colposcopy and directed biopsy,”
Am. J. Obstet. Gynecol., 188
(6), 1406
–1412
(2003). http://dx.doi.org/10.1067/mob.2003.461 AJOGAH 0002-9378 Google Scholar
H. Akbari et al.,
“Cancer detection using infrared hyperspectral imaging,”
Cancer Sci., 102
(4), 852
–857
(2011). http://dx.doi.org/10.1111/j.1349-7006.2011.01849.x Google Scholar
D. Roblyer et al.,
“In vivo fluorescence hyperspectral imaging of oral neoplasia,”
Proc. SPIE, 7169 71690J
(2009). http://dx.doi.org/10.1117/12.807226 Google Scholar
V. Masilamani et al.,
“Fluorescence spectra of blood and urine for cervical cancer detection,”
J. Biomed. Opt., 17
(9), 098001
(2012). http://dx.doi.org/10.1117/1.JBO.17.9.098001 JBOPFO 1083-3668 Google Scholar
S. H. Tabrizi et al.,
“Single fiber reflectance spectroscopy on cervical premalignancies: the potential for reduction of the number of unnecessary biopsies,”
J. Biomed. Opt., 18
(1), 017002
(2013). http://dx.doi.org/10.1117/1.JBO.18.1.017002 JBOPFO 1083-3668 Google Scholar
M. Liang et al.,
“Identification of abnormal cervical regions from colposcopy image sequences,”
in 21st Int. Conf. on Computer Graphics,
(2013). Google Scholar
H. Lange,
“Automatic detection of multi-level acetowhite regions in RGB color images of the uterine cervix,”
Proc. SPIE, 2005 1004
–1017
(2005). http://dx.doi.org/10.1117/12.596064 Google Scholar
N. Thekkek and R. Richards-Kortum,
“Optical imaging for cervical cancer detection: solutions for a continuing global problem,”
Nat. Rev. Cancer, 8
(9), 725
–731
(2008). http://dx.doi.org/10.1038/nrc2462 NRCAC4 1474-175X Google Scholar
U. P. Gustafsson et al.,
“In vivo fluorescence and reflectance imaging of human cervical tissue,”
Proc. SPIE, 2003 521
–530
(2003). http://dx.doi.org/10.1117/12.480413 Google Scholar
J. Karpińska,
“Derivative spectrophotometry-recent applications and directions of developments,”
Talanta, 64
(4), 801
–822
(2004). http://dx.doi.org/10.1016/j.talanta.2004.03.060 TLNTA2 0039-9140 Google Scholar
F. Tsai and W. Philpot,
“Derivative analysis of hyperspectral data,”
Remote Sens. Environ., 66
(1), 41
–51
(1998). http://dx.doi.org/10.1016/S0034-4257(98)00032-7 RSEEA7 0034-4257 Google Scholar
A. J. Owen,
“Uses of Derivative Spectroscopy,”
UV-Visible Spectroscopy, 1
–8
(1995). Google Scholar
H. Mark and J. WorkmanJr.,
“Chemometrics: derivatives in spectroscopy, Part I: the behavior of the derivative,”
Spectroscopy, 18
(4), 32
–37
(2003). Google Scholar
M. E. Martin et al.,
“Dual modality fluorescence and reflectance hyperspectral imaging: principle and applications,”
Proc. SPIE, 5692 133
–139
(2005). http://dx.doi.org/10.1117/12.604445 Google Scholar
T. Arnold, M. De Biasio and R. Leitner,
“Hyperspectral video endoscope for intrasurgery tissue classification using auto-fluorescence and reflectance spectroscopy,”
Proc. SPIE, 8087 808711
(2011). http://dx.doi.org/10.1117/12.889940 Google Scholar
R. J. Nordstrom et al.,
“Identification of cervical intraepithelial neoplasia (CIN) using UV - excited fluorescence and diffuse - reflectance tissue spectroscopy,”
Lasers Surg. Med., 29
(2), 118
–127
(2001). http://dx.doi.org/10.1002/lsm.1097 LSMEDI 0196-8092 Google Scholar
C. Wang et al.,
“In vivo and in vitro hyperspectral imaging of cervical neoplasia,”
Proc. SPIE, 8951 89510M
(2014). http://dx.doi.org/10.1117/12.2041046 Google Scholar
L. Gaffikin et al.,
“Alternatives for cervical cancer screening and treatment in low-resource settings,”
in Workshop Proceedings,
21
–22
(1997). Google Scholar
C. H. Buckley, E. B. Butler and H. Fox,
“Cervical intraepithelial neoplasia,”
J. Clin. Pathol., 35
(1), 1
–13
(1982). http://dx.doi.org/10.1136/jcp.35.1.1 Google Scholar
M. F. Zakaria, H. lbrahim and S. A. Suandi,
“A review: image compensation techinques,”
in 2nd Int. Conf. on Computer Engineering and Technology,
404
–408
(2010). Google Scholar
J. R. Jensen and K. Lulla,
“Introductory digital image processing: a remote sensing perspective,”
Geocarto International, 2
(1), 65
(1987). http://dx.doi.org/10.1080/10106048709354084. Google Scholar
A. G. Wacker and D. A. Landgrebe,
“Minimum distance classification in remote sensing,”
25
(1972). Google Scholar
N. M. Marín et al.,
“Diffuse reflectance patterns in cervical spectroscopy,”
Gynecol. Oncol., 99
(3), S116
–S120
(2005). http://dx.doi.org/10.1016/j.ygyno.2005.07.054 GYNOA3 Google Scholar
V. T. C. Chang et al.,
“Quantitative physiology of the precancerous cervix in vivo through optical spectroscopy,”
Neoplasia, 11
(4), 325
–332
(2009). http://dx.doi.org/10.1593/neo.81386 Google Scholar
C. Lau et al.,
“Early detection of high-grade squamous intraepithelial lesions in the cervix with quantitative spectroscopic imaging,”
J. Biomed. Opt., 18
(7), 076013
(2013). http://dx.doi.org/10.1117/1.JBO.18.7.076013 JBOPFO 1083-3668 Google Scholar
R. Hornung et al.,
“Quantitative near-infrared spectroscopy of cervical dysplasia in vivo,”
Hum. Reprod., 14
(11), 2908
–2916
(1999). http://dx.doi.org/10.1093/humrep/14.11.2908 HUREEE 0268-1161 Google Scholar
S. Prahl, Optical absorption of hemoglobin,
(2015) http://omlc.ogi.edu/spectra/hemoglobin/index.html May ). 2015). Google Scholar
I. Georgakoudi et al.,
“NAD(H) and collagen as in vivo quantitative fluorescent biomarkers of epithelial precancerous changes,”
Cancer Res., 62
(3), 682
–687
(2002). Google Scholar
C. R. Weber et al.,
“Model-based analysis of reflectance and fluorescence spectra for in vivo detection of cervical dysplasia and cancer,”
J. Biomed. Opt., 13
(6), 064016
(2008). http://dx.doi.org/10.1117/1.3013307 JBOPFO 1083-3668 Google Scholar
T. Collier et al.,
“Determination of epithelial tissue scattering coefficient using confocal microscopy,”
IEEE J. Sel. Top. Quantum Electron., 9
(2), 307
–313
(2003). http://dx.doi.org/10.1109/JSTQE.2003.814413 Google Scholar
I. Pavlova et al.,
“Microanatomical and biochemical origins of normal and precancerous cervical autofluorescence using laser scanning fluorescence confocal microscopy,”
Photochem. Photobiol., 77
(5), 550
–555
(2003). http://dx.doi.org/10.1562/0031-8655(2003)077<0550:MABOON>2.0.CO;2 PHCBAP 0031-8655 Google Scholar
G. Sapiro, Geometric Partial Differential Equations and Image Analysis, Cambridge University Press, New York
(2006). Google Scholar
BiographyWenli Zheng is a master of science candidate at the Department of Precision Machinery and Precision Instrumentation of University of Science and Technology of China. His current research efforts focus on hardware development, software implementation, imaging algorithm, and data analysis for hyperspectral imaging of cervical neoplasia. Chaojian Wang is a master of science candidate at the Department of Precision Machinery and Precision Instrumentation of University of Science and Technology of China. His current research efforts focus on hardware development, software implementation, imaging algorithm, and data analysis for hyperspectral imaging of cervical neoplasia. Shufang Chang is a professor of obstetrics and gynecology at the Department of Obstetrics and Gynecology of the Second Affiliated Hospital of Chongqing Medical University. Her research areas include detection and treatment of gynecologic cancers, drug-loaded microbubbles, and ultrasound-assisted targeted chemotherapy and gene therapy, with over 50 publications in the field. She has more than 17 years of experience in cancer research and gynecologic oncologic surgery. Shiwu Zhang is currently an associate professor in the Department of Precision Machinery and Precision Instrumentation, USTC. He has also been a postdoctoral research fellow in the Department of Computer Science, Hong Kong Baptist University, Hong Kong. He has led a number of research programs sponsored by the National Science Foundation of China, Chinese Academy of Sciences, Chinese State High-Tech Development Plan, etc. His current research interests include biomedical optics and intelligent robots. Ronald X. Xu is an associate professor of biomedical engineering at The Ohio State University and professor of precision machinery and instrumentation at the University of Science and Technology of China. He has published over 80 technical papers in biomedical imaging, drug delivery, and 3-D printing. In 2010, he was honored as one of the 10 brightest Central Ohioans by Columbus CEO Magazine. In 2011, he was awarded the TechColumbus “Inventor of the Year” award. |