
|
|
1.IntroductionSimultaneous observation of different types of biological molecules is essential for investigating complex biological phenomena because most biological events are based on ensembles of different molecules or proteins.1 Fluorescence microscopy techniques allow the simultaneous visualization of different biological molecules by spectral separation of fluorescence emission. In typical confocal microscopy, multicolor excitation is used to excite fluorescent proteins (FPs) with different emission wavelengths.2 However, simultaneous irradiation of multiple excitation lasers may restrict the usable wavelength band for fluorescence detection and introduce chromatic aberration that can interfere with detecting colocalization or the relative distributions of different FPs. Switching the excitation wavelength is another approach; however, it causes a problem in monitoring molecules acting in temporal and spatial harmony. Since it is clear that simultaneous visualization of multiple targets provides much more information about complex biological phenomena,3,4 increasing the number of FP in simultaneous excitation and detection is in great demand in the wide range of biological investigations.5 For simultaneous multicolor imaging, use of multiphoton excitation has been intensively investigated.6,7 Since many kinds of fluorophores exhibit two-photon excitation spectra blueshifted or broadened from the single-photon counterpart, a single laser line can excite more fluorophores compared to single-photon excitation.6–10 As another approach, multiple excitation lines in the near-infrared (NIR) region have been utilized for exciting multiple proteins,4,11,12 which allows the use of the whole visible wavelength range for detecting FPs, whereas multiwavelength excitation with single-photon excitation does not. In this paper, we present a new concept of multiphoton excitation microscopy for multicolor imaging, where two-photon excitation with a single visible wavelength laser light is used for concurrent excitation of multiple FPs. Two-photon excitation is already well characterized in the NIR/IR region and has been applied to the observation of the inside of a thick sample.13–16 Although fluorescent properties of FPs under two-photon excitation with visible light have been studied,17,18 the feasibility of using visible-wavelength two-photon excitation of FPs in laser-scanning confocal microscopy have been restricted to theoretical investigation and the resultant imaging property remains virtually unknown. In addition to the capability of multicolor imaging, our concept offers an improved spatial resolution in three dimensions due to the nonlinear excitation using the shorter-wavelength laser. As described in the following section, many FPs can be excited at a wavelength range of 250 to 300 nm. To access this deep UV (DUV) range for simultaneous multicolor imaging, we propose the use of a visible, in particular green, wavelength laser light and induce two-photon excited fluorescence from the FPs. As shown in Fig. 1(a), the simultaneous absorption of two photons in the visible range can excite a fluorophore in a manner equivalent to that of a DUV wavelength. The use of fluorescence excitation in the UV region has been applied in autofluorescence imaging of intrinsic fluorophores, such as amino acids, biotin, nicotinamide adenine dinucleotide (NADH), and serotonin by single-photon excitation,19 multiphoton excitation with a visible light20,21 and an NIR light.6,22–24 Two-photon fluorescence imaging of exogenous fluorescence dye 4',6-diamidino-2-phenylindole, dihydrochloride using visible light has also been reported recently.25 For imaging FPs, a similar concept, which utilizes the state for multicolor imaging, has been demonstrated; however, in this case, FPs were excited by two-photon absorption at the NIR region.10 In particular, two-photon excitation where the effective absorption wavelength is in the DUV range () energy level has been demonstrated with the observations of amino acids,26,27 serotonin,21 and a glass substrate,28 but no demonstration of imaging biological cells using such visible-wavelength two-photon excitation of FPs or exogenous fluorescent probes has been reported. Fig. 1(a) Energy diagram showing single-photon excitation with visible light (VIS), deep ultraviolet (DUV) light, and two-photon excitation with visible light (VIS2P), (b) single-photon absorption, and (c) excitation spectra of Sirius, EBFP2, mseCFP, mTFP1, enhanced green fluorescent protein (EGFP), Venus, DsRed, and mCherry. The excitation spectra were measured by detecting fluorescence emission at the peak wavelength. 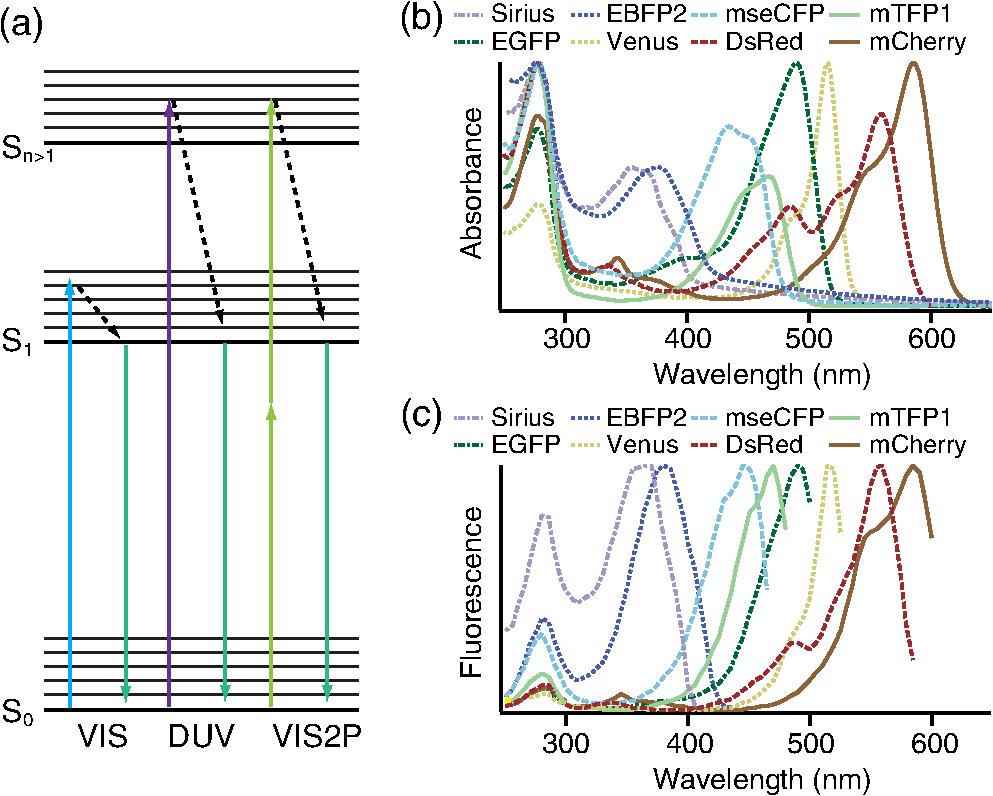 2.Simultaneous Multicolor Imaging by Visible-Wavelength Two-Photon ExcitationPreviously, the fluorescence property of FPs under excitation by using a DUV wavelength was presented only for enhanced cyan fluorescent protein (ECFP), enhanced green fluorescent protein (EGFP), and enhanced yellow fluorescent protein (EYFP).29 We compared the absorption and excitation spectra of FPs at the DUV to the visible range as shown in Figs. 1(b) and 1(c). From these spectra, we can confirm that various types of FPs can emit fluorescence by absorbing light at . Especially, FPs with shorter emission wavelengths, such as Sirius,30 EBFP2,31 and mseCFP,32 show high excitation efficiency at the DUV region. Although two-photon excitation and absorption spectra are not, in general, identical to those by single-photon processes (e.g., usually blueshifted or broadened), this result indicates that the FPs can all be excited at a single wavelength in the DUV region, and this sets up the next step of attempting to excite all of them by two-photon excitation. For a demonstration of multicolor FP excitation, a 525 nm pulsed laser light was used for simultaneous two-photon excitation of HeLa cells labeled with Sirius, mseCFP, mTFP1,33 and EGFP,34 in mitochondrial matrix, nucleosome, Golgi apparatus, and nucleoli, respectively. We selected these FPs for imaging because they do not have strong single-photon absorption at 525 nm. The fluorescence emission from each protein was partially separated by using dichroic mirrors and was detected by four photomultiplier tubes [Fig. 2(a)]. In this optical system, we introduced a confocal pinhole to remove the fluorescence from the optics and the adhesion agent excited by two-photon absorption of the visible light. Figures 2(b)–2(e) show the fluorescence images obtained simultaneously by the two-photon excitation at 525 nm. Figure 2(f) is an image reconstructed by a linear spectral unmixing of each protein distribution.35 The stained organelles are clearly recognizable with the high contrast presumably due to the nonlinear excitation. Imaging of HeLa cells with other combinations of FPs and excitation wavelengths was also demonstrated as shown in Figs. 2(g)–2(i). Fig. 2(a) Optical setup for visible-wavelength two-photon excitation microscopy. DM, BP, L, OL, and GM represent a dichroic mirror, a bandpass filter, a lens, an objective lens, and a pair of galvanometer mirrors, respectively. The reflection/transmission bands for DM1 are 350 to 500/518 to 950 nm (Semrock, FF509-FDi01). DM2, DM3, DM4, and DM5 reflect light with wavelength 350 to 450 (Semrock, FF458-Di02), 457 to 473 (Semrock, LM01-480), 442 to 488 (Semrock, FF495-Di03), and 468 to 514 nm (Semrock, FF520-Di02), respectively. The transmission bands of BP1, BP2, BP3, BP4, BP5, and BP6 are 420 to 500 (Semrock, FF02-460/80), 415 to 455 (Semrock, FF02-435/40), 440 to 480 (Semrock, FF01-465/30), 475 to 495 (Semrock, FF02-485/20), 459 to 499 (Semrock, FF01-479/40), and 454 to 496 nm (Semrock, FF01-475/42), respectively. (b) to (f) Fluorescence images of a fixed HeLa cell expressing Sirius, mseCFP, mTFP1, and EGFP at mitochondria, nucleosome, Golgi apparatus, and nucleoli, respectively. For images (b) through (e), a mode-locked Ti:sapphire laser (Spectra Physics, Tsunami) was used for the light source and the frequency-doubled light generated through a beta-barium borate (BBO) crystal was used for two-photon excitation at 525 nm. Fluorescence was observed by four photomultiplier tubes detecting wavelength ranges of (b) 410 to 440 nm, (c) 455 to 475 nm, (d) 475 to 490 nm, and (e) 490 to 500 nm. Low-pass filtering was applied to all images. The excitation power was 0.6 mW at the object plane. (f) An image reconstructed by overlaying the unmixed fluorescence distributions. (g) to (i) Images of HeLa cells with other combinations of fluorescent proteins (FPs) and excitation wavelengths, in which linear unmixing was not applied. For obtaining the images (g) through (i), an optical parametric oscillator (OPO) system (Coherent, Mira OPO) seeded by a mode-locked Ti:sapphire laser (Spectra Physics, Tsunami) and a BBO crystal were used to produce the visible pulsed laser. Pixel dwell time: 1 ms. Pixel numbers of the images: for (b) through (e); for (g) through (i). 1.4 and 1.49 NA objective lenses were used for the observations of (b) through (f) and (g) through (i), respectively. Scale bars: .  In our imaging scheme, autofluorescence from DNA, amino acid residues, and endogenous molecules36 may interfere with the fluorescence imaging. Therefore, as shown in Fig. 3, we compared fluorescence intensity from FPs with autofluorescence from the HeLa cell itself and then confirmed that the intensity of fluorescence emitted by FPs was to 450 times higher than that of autofluorescence in the region of 410 to 500 nm. Autofluorescence intensity measured from fixed cells was stronger than that in living samples. This is due to fluorescence products generated by aldehyde fixatives reacting with amines and proteins. Other intrinsic emitters, such as NADH and flavins, are reported to be excited by multiphoton NIR excitation,37 but do not appear with the multiphoton visible excitation used in our experiments. Fig. 3Comparison between the intensity of fluorescence of FPs and autofluorescence of endogenous molecules in (a) living samples and (b) samples fixed with paraformaldehyde. For comparison, living HeLa cells expressing Sirius, mseCFP, mTFP1, EGFP, or no FPs were imaged. We observed 10 cells in each sample and measured fluorescence intensity from 4000 pixels in images of each sample. The pixel size and the pixel dwell time were 390 nm and for all the images, respectively. For imaging the live cells, a silicone-oil immersion objective lens with an NA of 1.3 was used, and the excitation power was measured at the focal plane. For imaging of the fixed samples, an oil-immersion objective lens with an NA of 1.4 was used. The excitation power was 3.5 mW for Sirius, mseCFP, mTFP1, and their controls. For EGFP and the control, 1 mW excitation power was used. 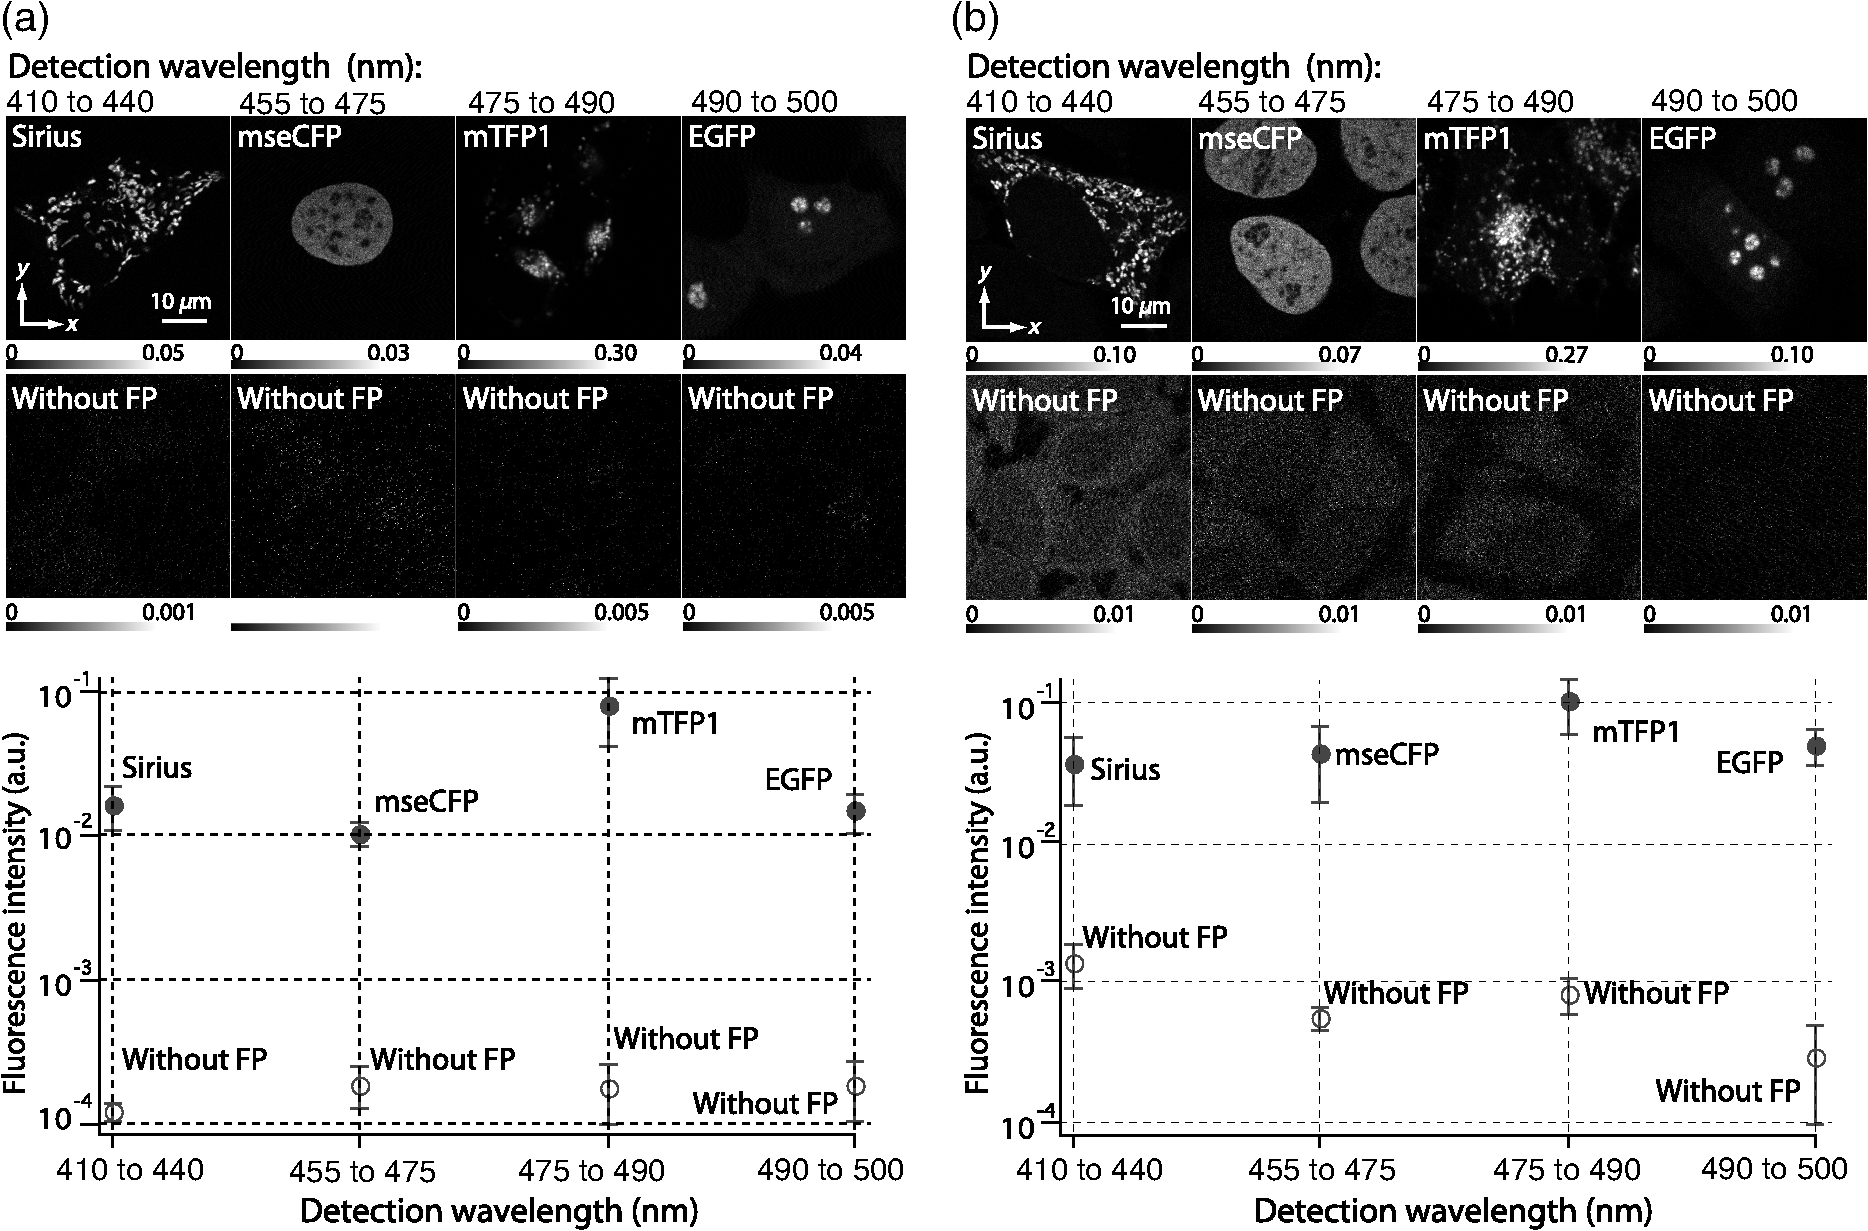 3.Excitation and Emission Properties of FPs Under Visible-Wavelength Two-Photon ExcitationIf the fluorescence emission from the FPs in the visible region is generated by two-photon excitation, the relationship between the excitation intensity and emission intensity should be quadratic. As seen in Figs. 4(a)–4(d), the fluorescence signal from all the FPs presents a clear quadratic response to the excitation intensity of 525 nm light, proving that the fluorescence signal is indeed generated by an interaction of two photons. We also measured the fluorescence spectra under two-photon excitation at 525 nm and compared them with those under the single-photon excitation at the maximum absorption in the visible wavelength range. We performed the fluorescence measurement by using the same spectrophotometer (Acton Research Co., Spectra-Pro 320i) equipped with an electron multiplying (EM)-CCD camera (Andor Technology, iXon DU888E) for the single- and two-photon excitations. Interestingly, in the results shown in Fig. 4(e), the fluorescence spectra of Sirius appear similar for both single-photon and two-photon excitation; however, the spectra of other FPs differ. In particular, in the fluorescence spectrum of mseCFP, the subpeak usually appearing as a shoulder of the main peak has risen substantially under the two-photon excitation. Since the single-photon excitation for both visible and DUV wavelengths shows the same spectral shape, which has been confirmed by our experiment (data not shown), these results imply that the fluorescence emission pathways are different between the single-photon and the visible-wavelength two-photon excitation schemes. Fig. 4Fluorescence response of (a) Sirius, (b) mseCFP, (c) mTFP1, and (d) EGFP excited with 525 nm pulsed laser light. The dotted lines show a slope of 2. The emission spectra obtained by single-photon excitation with a mercury lamp (1PE) and two-photon excitation with 525 nm pulsed laser (2PE) are shown in (e). The excitation spectra of FPs are shown in (f). The wavelength ranges used for detecting Sirius, mseCFP, mTFP1, and EGFP were 410 to 440, 455 to 475, 475 to 490, and 490 to 500 nm, respectively. represents average excitation power. Fluorescence intensity in (f) is normalized by the maximum intensity detected from each FP in the measurement.  In order to understand the excitation property of the FPs, we have measured the excitation spectra of the FPs as shown in Fig. 4(f). To ensure that the spectra were measured under two-photon excitation, we confirmed the quadratic response of fluorescence at the excitation wavelengths for each FP used in this plot. In this measurement, we found that the excitation efficiency increased with decreasing excitation wavelength. As a similar result was also reported in Ref. 18, our findings indicate that the FPs can be excited by resonant two-photon excitation when the excitation wavelength is close to the single-photon absorption band. In our measurement, mseCFP, mTFP1, and EGFP show a linear fluorescence response to the excitation intensity at wavelengths , presumably due to single-photon excitation. On the other hand, Sirius shows the quadratic response to the excitation within the entire wavelength range used for the measurement, indicating that the use of a shorter excitation wavelength may further improve the fluorescence signal from Sirius. 4.Spatial Resolution and Image ContrastNonlinear excitation offers the potential to improve the spatial resolution due to the use of the nonlinear fluorescence response. A key point that governs the actual resolution improvement by nonlinear excitation is whether the target can absorb light at shorter than usual wavelengths. As shown above, Sirius can be excited via two-photon absorption at 525 nm and emits fluorescence at . From Fig. 4(f), we can expect that shorter excitation wavelengths will also allow sufficient nonlinear absorption and provide further improvement of the spatial resolution. Therefore, we calculated the effective point spread functions (PSFs) under several different excitation conditions to compare the spatial resolution. To obtain the effective PSFs, the square of the light distribution at the laser focus was multiplied by the detection PSF at the emission wavelength38–40 with a 0.5 Airy pinhole size that gives a spatial resolution close to the theoretical limit of confocal microscopy.39 In the calculation results, we confirm that the effective PSF for the lateral direction shows strong dependence on the polarization of the excitation light. This is because the quadratic nature of two-photon excitation emphasizes the small difference of the light distribution between the two polarizations. The highest resolution and axial resolution were given by the linear excitation polarization as shown in Fig. 5(a). However, in practical conditions, it would be reasonable to use circular polarization in order to obtain a spatial resolution isotropic to the and directions, where the resolution is limited to 122 nm. One can also try to use a detection range ; however, the autofluorescence from the endogenous molecules may interfere with the image. Fig. 5The effective point spread functions (PSFs) calculated for [(a), (b), and (c)] visible-wavelength two-photon excitation (VIS2P) and (d) visible-wavelength single-photon excitation (VIS) confocal microscopy. The profiles of the effective PSF on , , and axes are shown. The direction of the incident polarization is axis. In all the calculations, we assumed the NA of the objective lens is 1.3 and the size of the confocal pinhole is 0.5 Airy unit. Scale bar: 200 nm.  We also calculated the effective PSFs for visible-wavelength two-photon excitation at 525 nm light [Figs. 5(b) and 5(c)] and conventional confocal microscopy [Fig. 5(d)] for comparison. The result shows that a spatial resolution higher than that in a typical confocal microscopy observation can be expected in observations using visible-wavelength two-photon excitation. This calculation also confirms that the visible-wavelength two-photon excitation provides higher spatial resolution in the axial direction than conventional confocal microscopy using a similar excitation and emission wavelength. To experimentally investigate the spatial resolution in the visible-wavelength two-photon excitation imaging, we observed fluorescence beads with a diameter of 100 nm as shown in Fig. 6. The fluorescence beads can be excited at the DUV range and emit fluorescence at . We excited the fluorescent beads by using a pulsed laser light at 500 nm and detected the fluorescence in the wavelength range of 417 to 477 nm. As shown in Figs. 6(a), 6(c), and 6(d), the spatial resolutions and polarization dependence similar to the calculation results are observed in the experiments. The axial resolution presented in Figs. 6(b) and 6(e) also shows a value close to the theoretical result. We also confirmed that the fluorescence imaging in Figs. 6(a) and 6(b) were performed by two-photon excitation by measuring the fluorescence and emission relation with the excitation at 500 nm and the capability of fluorescence excitation in the DUV range as shown in Figs. 6(f) and 6(g). Fig. 6(a) and (b) Fluorescence images of fluorescent beads (Life Technologies, F-8797) with a diameter of 100 nm. The excitation and the detection wavelengths are 500 and 417 to 477 nm, respectively. A silicone-immersion objective lens with an NA of 1.3 was used for the observations. The laser power at the focus was 0.16 mW. The pixel dwell time was . The diameter of detection pinhole was , which corresponds to Airy with the center wavelength of the emission (440 nm). The laser polarization was set to axis. The pixel sizes of the images in (a) and (b) were 31 and 58 nm, respectively. The line profiles along the dotted line in , , and directions are shown in (c), (d), and (e), respectively. (f) The excitation and emission relation of the fluorescent beads measured with the excitation at 500 nm. The dotted line in (f) indicates a slope of 2. (g) The excitation spectrum of the fluorescent beads measured with the emission at 440 nm. 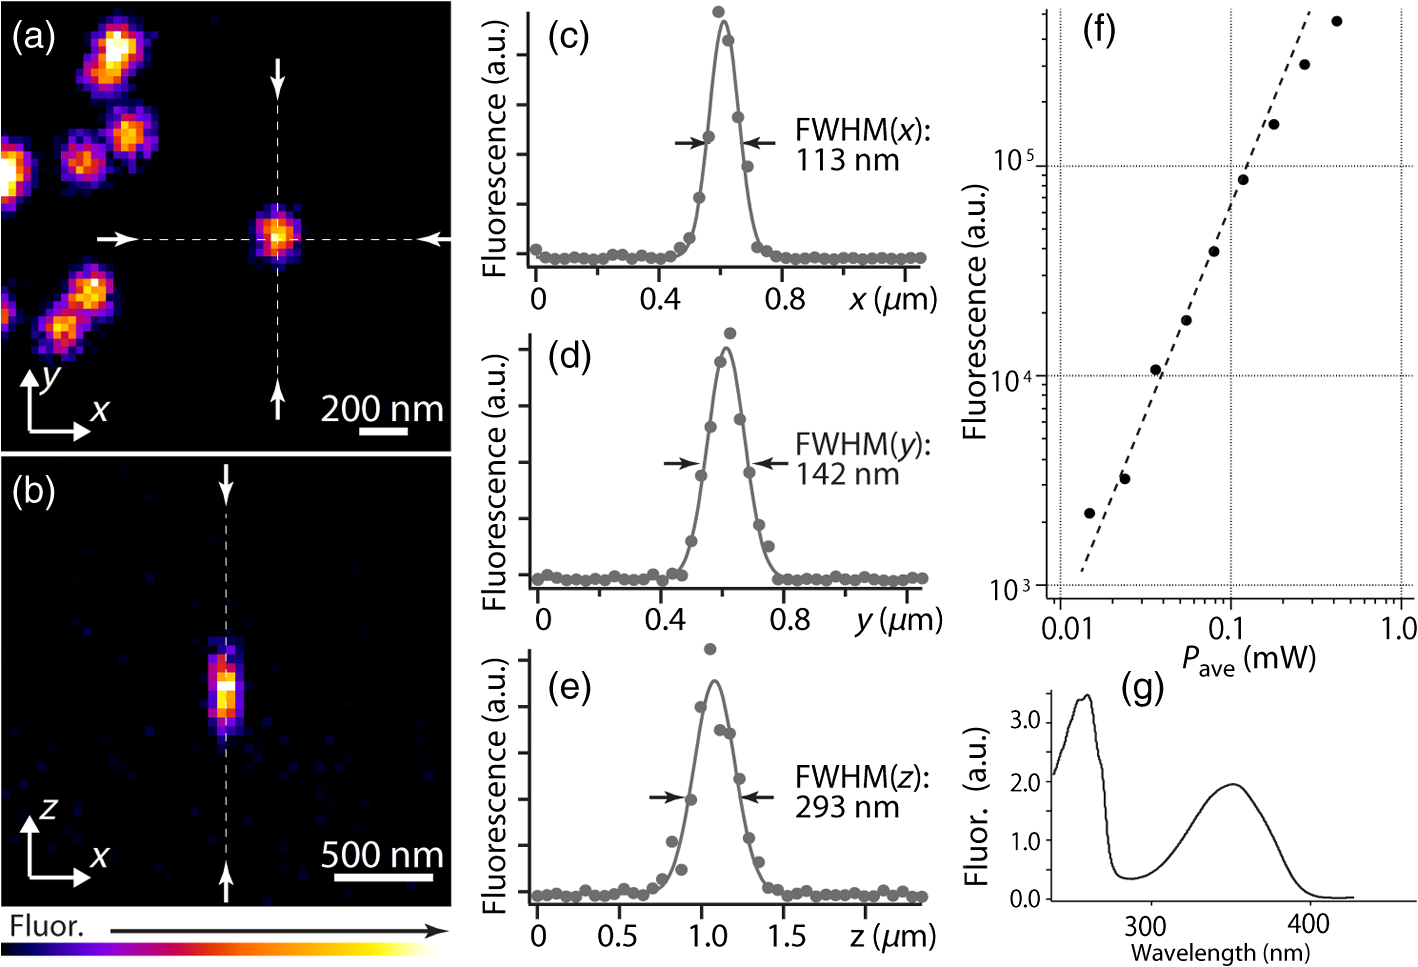 In addition to the fundamental improvement of the spatial resolution, we can expect that visible-wavelength two-photon excitation provides high image contrast and suppression of the background. Figure 7 shows the comparison of images taken by confocal single-photon and visible-wavelength two-photon excitation. mseCFP expressed in the nucleosomes of a living HeLa cell was imaged by 405 nm for single-photon excitation [Figs. 7(a) and 7(b)] and 525 nm for visible-wavelength two-photon excitation [Figs. 7(c) and 7(d)]. The image contrast itself is significantly improved in the visible-wavelength two-photon excitation scheme, presumably due to the localization of the excitation volume within the laser focus. The localization of the excitation itself is key since even a very small pinhole cannot eliminate the out-of-focus signal completely. Although the theoretical resolutions are similar in both observations, the higher optical sectioning capability with the nonlinear excitation significantly contributes to enhancing the image contrast and reveals cellular interiors more distinctly. Fig. 7Fluorescence images of a living HeLa cell expressing mseCFP at nucleosome observed by [(a) and (b)] single-photon excitation at 405 nm and [(c) and (d)] two-photon excitation at 525 nm. The pixel dwell time was . The excitation powers for single- and two-photon excitation were and 0.24 mW, respectively. The diameter of detection pinhole () corresponds to 0.47 Airy calculated with the center wavelength of mseCFP emission (475 nm). A silicone-immersion objective lens with an NA of 1.3 was used. The scale bars are . The pixel size for (a) and (c) and (b) and (d) are and , respectively. 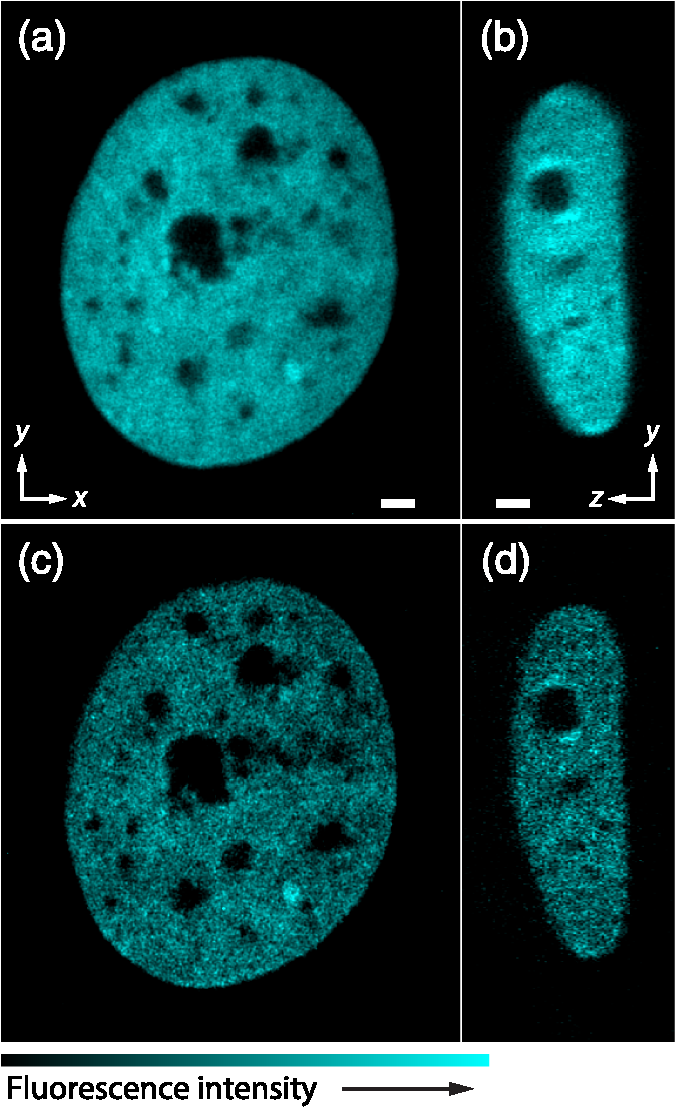 5.Time-Lapse Imaging and PhotostabilitySince labeling a sample with FPs is useful in the investigation of cells under physiological conditions, we also examined the capability of visible two-photon excitation in the observation of living cells. HeLa cells expressing Sirius at mitochondria were excited by pulsed laser light at 525 nm wavelength. The cells were kept at 37°C in an incubation chamber on the microscope stage in order to maintain the cell viability during the observation. As shown in Fig. 8, the dynamics of mitochondria expressing Sirius in a HeLa cell was clearly visualized. In this experiment, we did not observe a rapid morphological change in the cell during the image acquisition. However, the damage seems to have accumulated to some degree with irradiation, since some change in the shape of mitochondria toward a round or ring form was observed after the image acquisition. The change of the mitochondria shape after imaging was more evident under excitation with higher power. Fig. 8Time-lapse images of living HeLa cells expressing Sirius in mitochondria. The mitochondrial movement in a HeLa cell was observed with Sirius excited using 525 nm pulsed light. A water-immersion objective lens with an NA of 1.2 was used for the observations. The images were taken every 2 min at an imaging rate of 6.6 s/image ( for ). The average excitation power was 2.0 mW at the object plane. Scale bar: .  We also examined the photobleaching properties of the FPs used in the above experiments. For this purpose, we investigated the decay of fluorescence intensity during fluorescence imaging of a living HeLa cell expressing single FP, as shown in Figs. 9(a)–9(d). Figures 9(e)–9(h) show the decay curves of fluorescence intensity of each FP obtained from the images as an average of 500 pixels in a image. The fluorescence intensity in the decay curves was normalized with that of the first image. We examined the photobleaching efficiency with the different excitation conditions. The experimental result shows the clear difference in the bleaching efficiencies of each protein. The fluorescence intensity occasionally increased during imaging as seen in the result using Sirius and mTFP1 due to the movement of the stained organelles. The photobleaching efficiency is stronger in the FPs with a longer excitation wavelength. This might also be explained by the high excitation efficiency due to the resonance to the single-photon absorption. This experimental result also confirms that it is important to consider the bleaching property of FPs for performing multicolor time-lapse imaging, and the choice of FPs is still important even in single wavelength excitation. Fig. 9The decay of fluorescence intensity during image acquisition. Pulsed laser light at 525 nm with duration of 200 fs and a repetition rate of 80 MHz was used for excitation. A water-immersion lens with an NA of 1.2 was used. (a) to (d) Fluorescence images of living HeLa cells expressing (a) Sirius at mitochondria, (b) mseCFP at nucleosome, (c) mTFP1 at Golgi apparatus, and (d) EGFP at nucleoli, respectively. A water-immersion objective lens with an NA of 1.2 was used, and the pixel size of the images is 87 nm. (e) to (h) Decay curves of fluorescence intensity of each FP. The signal decays of Sirius with an excitation power of 0.25 mW were not plotted because the fluorescence signal was too weak to visualize the subcellular structures.  To demonstrate the stability of the imaging and resilience to photobleaching of out-of-focus regions, we also performed volumetric imaging of a HeLa cell expressing Sirius, EGFP, and mTFP1 in the mitochondrial matrix, nucleoli, and nucleosomes, respectively [Figs. 10(a)–10(c)]. In this observation, images of each sample were recorded for each slice in the stack, starting from the bottom. To reconstruct a three-dimensional (3-D) image, we used volume rendering of the image stacks. Figures 10(a)–10(c) are composed of 19, 33, and 42 images, respectively. The resulting images clearly show how this method enables volumetric observations with high optical sectioning capability derived from nonlinear excitation. Fig. 10Three-dimensional visualization of a fixed HeLa cell expressing (a) Sirius at mitochondria (Video 1), (b) EGFP at nucleoli (Video 2), and (c) mTFP1 at nucleosome (Video 3) by using volume rendering. Pulsed laser light at 525 nm with duration of 200 fs and a repetition rate of 80 MHz was used for excitation. An oil-immersion objective lens with an NA of 1.4 was used. The excitation powers for (a) to (c) were 0.2, 0.03, and 0.08 mW, respectively. The pixel dwell times were for (a) and for (b) and (c). Total image acquisition times for (a) through (c) were 166, 7, and 8 min, respectively. The voxel sizes were for (a) and for (b) and (c). The scale bars are for (a) and for the inset in (a) (b), and (c). (Video 1, MOV, 0.66 MB [URL: http://dx.doi.org/10.1117/1.JBO.20.10.101202.1]; Video 2, MOV, 0.36 MB [URL: http://dx.doi.org/10.1117/1.JBO.20.10.101202.2]; Video 3, MOV, 0.84 MB) [ http://dx.doi.org/10.1117/1.JBO.20.10.101202.3].  6.Simultaneous Single- and Two-Photon Excitation ImagingThe number of FPs for simultaneous observation can be increased by combining conventional single-photon excitation. There are a variety of FPs that can be excited by single-photon absorption at wavelength, such as Venus,41 DsRed,42 and mCherry.43 Therefore, simultaneous excitation of FPs by using both single- and two-photon absorption is practical for expanding the usable emission wavelength range for FP imaging. As a demonstration of this approach, we observed a living HeLa cell expressing mTFP1, EGFP, Venus, and DsRed at Golgi apparatus, nucleoli, actin filaments, and mitochondria, respectively, as shown in Fig. 11. We used an optical setup shown in Fig. 11(a) with a 525 nm pulsed laser light in this observation. Figures 11(b)–11(e) show fluorescence images obtained by each detection channel in Fig. 11(a). Figure 11(f) was reconstructed by applying the spectral unmixing35 to Figs. 11(b)–11(e). This demonstration confirms that the organelles stained with FPs can be concurrently visualized by using a single excitation wavelength. Fig. 11(a) Optical setup for simultaneous single-photon and visible-wavelength two-photon excitation imaging. An OPO system (Spectra Physics, Inspire OPO) seeded by a mode-locked Ti:sapphire laser (Spectra Physics, Mai Tai) equipped with an SHG unit was used as the excitation light source, providing 525 nm pulsed light with the repetition rate of 80 MHz and pulse width of 200 fs. The reflection/transmission bands of DM7, DM8, and DM9 are 350 to 532/541 to 1200 (Semrock, Di02-R532), 457 to 473/488 to 647 (Semrock, LM01-480), and 350 to 550/570 to 950 (Semrock, FF560-FDi01), respectively. The transmission band of BP8 was 542 to 582 nm (Semrock, FF01-562/40). (b) to (e) Fluorescence images of living HeLa cells expressing mTFP1, EGFP, Venus, and DsRed at Golgi apparatus, nucleoli, actin filaments, and mitochondria detected through the wavelength bands with (b) 410 to 490 nm, (c) 490 to 500 nm, (d) 540 to 560 nm, and (e) 560 to 580 nm. The pixel dwell time in the measurement was . A silicone-immersion objective lens with an NA of 1.3 was used for the observations. Pixel number of the images is 612 for both and directions. (f) shows an image reconstructed by overlaying the unmixed fluorescence distributions, where Golgi apparatus, nucleoli, actin filaments, and mitochondria are displayed in gray, blue, red, and green, respectively. 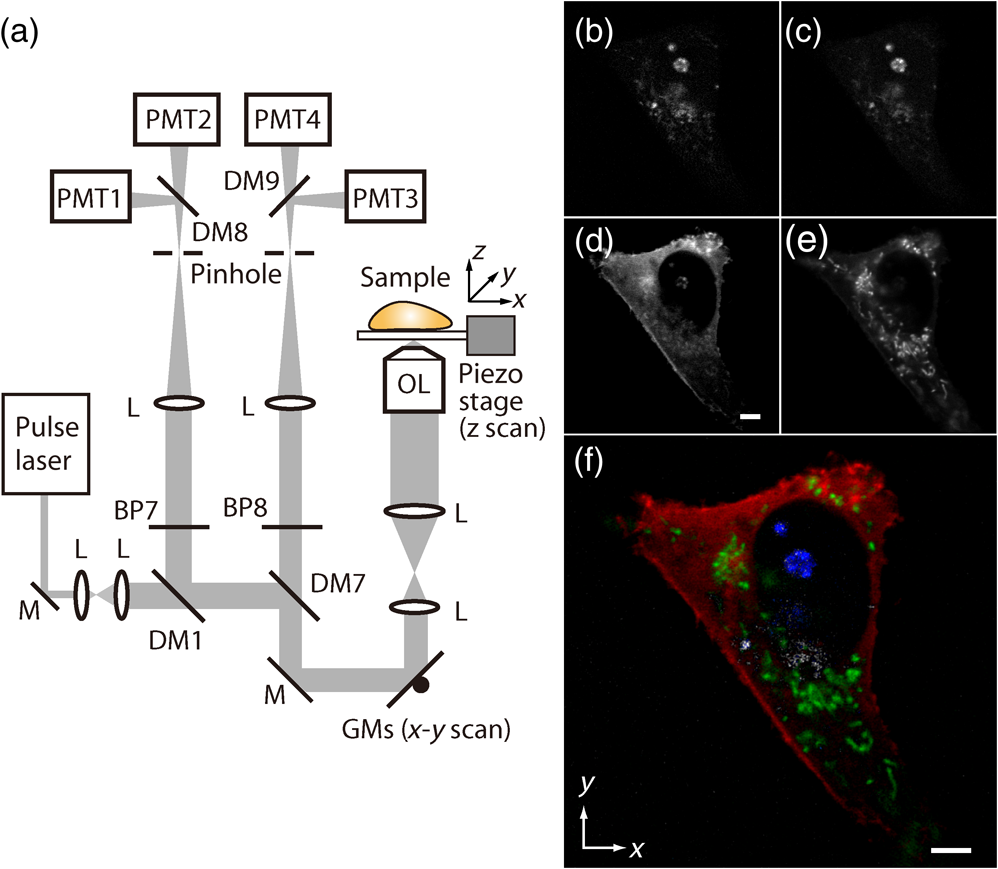 7.DiscussionIn this paper, we reported the first use of visible-wavelength two-photon excitation of multiple FPs for simultaneous multicolor fluorescence imaging. The quadratic fluorescence response against the excitation intensity shown in Figs. 4(a)–4(d) clearly demonstrates that FPs were excited via two-photon absorption. DUV excitation has not been an obvious choice for FP imaging due to phototoxicity. By exploiting visible light for two-photon excitation, we attain the benefits of DUV excitation without the phototoxicity induced by direct DUV irradiation and the necessity of special optics designed for DUV light. Due to the short-wavelength nonlinear excitation, the two-photon excitation at the visible wavelength provides 3-D imaging capability with high spatial resolution. The use of nonlinear excitation additionally suppresses the background signals from out-of-focus planes, resulting in a substantial improvement of image contrast.44,45 Despite the fact that using a short excitation wavelength compromises the imaging depths offered by NIR light, which provides a major advantage for conventional two-photon excitation microscopy, our work clearly demonstrates that the visible-wavelength two-photon excitation can be utilized to allow multichannel imaging of subcellular structures. One of the major advantages in the visible-wavelength two-photon excitation is the simultaneous multicolor imaging capability with less chromatic aberration. In the visible-wavelength two-photon excitation mode, we need to use FPs that have almost no light absorption at the excitation laser wavelength. This requirement limits the number of simultaneously observable targets. However, this limitation can be overcome by combining conventional single-photon excitation of FPs, as demonstrated in Fig. 11. Another important advantage of the technique is the high spatial resolution due to the nonlinear excitation. As discussed with Figs. 5 and 6, the visible-wavelength two-photon excitation mode realizes the spatial resolution as higher than conventional confocal microscopy using a visible wavelength for excitation. The improved resolution enables us to observe the 3-D structures in cellular organelles that are difficult to visualize in conventional confocal microscopy. The suppression of background fluorescence by a combination of nonlinear excitation and confocal detection also effectively contributes to the ability to recognize small structures near the diffraction limit with high image contrast.44,45 In our experiment, we found that the single- and two-photon excitations of FPs at DUV region exhibit different emission spectra. While some reports of a difference in emission spectra between single- and two-photon excitation have emerged, the mechanism has not been well understood.46 For the fluorescence response observed in our experiments, two different photophysical pathways can be proposed. One is Förster resonance energy transfer (FRET) from two-photon excited amino acid residues, such as tryptophan, tyrosine, and phenylalanine. The other pathway is initiated by the direct excitation of a fluorophore to its upper excitation state. Visser et al. have investigated the excitation and emission pathways of ECFP, EGFP, and EYFP (Ref. 29) under DUV single-photon excitation through fluorescence lifetime measurement experiments and concluded that both pathways could be taken for the fluorescence emission. We consider, in our visible-wavelength two-photon excitation mode, that the fluorescence emission might be caused predominantly by direct fluorophore excitation and not by FRET. As reported in Ref 18, when the excitation wavelength is close to the single-photon absorption band, the enhancement of two-photon excitation by the resonance effect can be expected. Since it is unlikely that FRET causes such a spectrum difference, our experiment may also indicate that the direct excitation is the main pathway for the fluorescence emission under visible-wavelength two-photon excitation. Our experimental result may then show that the emission spectrum is not necessarily independent of the excitation pathway, which may give a new insight for understanding the photophysical mechanism of fluorescence excitation and emission. In addition, if the direct DUV excitation of fluorophore is possible, the visible-wavelength two-photon excitation can be applied to fluorescence observation using other types of probes. As an example, we have confirmed that ATTO488 dyes can produce fluorescence emission through two-photon excitation with a 560 nm pulsed laser light as shown in Fig. 12. Fig. 12(a) Fluorescence image of ATTO488-stained tubulin in HeLa cells obtained by excitation at 560 nm. The OPO system shown in Fig. 11 was used for the excitation. The detection wavelength region was 420 to 500 nm. The excitation power at the focal plane and the pixel dwell time were 0.4 mW and , respectively. An oil-immersion objective lens with an NA of 1.4 was used for the observation. (b) Absorption spectrum of an ATTO488 solution. (c) The excitation and emission relation of an ATTO488 solution. The dotted line shows a slope of 2. Scale bar: .  To apply the presented technique to various types of live cell imaging, the phototoxicity given by DUV excitation can be an issue. Although it was possible to observe damage in some cases, compared to single-photon excitation at DUV, two-photon excitation produces less damage since absorption is essentially localized to within the focal volume and is negligible in out-of-focus planes. In addition, as also discussed above, provided the DUV excitation of fluorescence excitation is presumably enhanced by resonant two-photon absorption, the DUV excitation efficiency of the endogenous molecule would be much lower than that of FPs, which can explain our observation of a weak autofluorescence background. Optimization of excitation power and exposure time allows imaging of protein dynamics in living cells for sufficient observation times without observing morphological changes in intracellular structures. Using detectors with higher quantum efficiency, such as an EM-CCD camera, together with multifocus excitation47–49 can further reduce the light exposure and extend the application of the technique to a wide range of biological samples. The opening up of a new multiphoton regime for multicolor fluorescent protein imaging, which allows simultaneous single- and two-photon imaging, should continue to be optimized with further work and lead to a large number of simultaneous targets in fluorescence imaging. This multiplexing limitation is probably the primary drawback of fluorescence microscopy in the current state of the art, since recent resolution advances in imaging now allow exquisite spatial detail. The cellular feature specificity that is the key role of probe chemistry is quite limited by the ability to imaging multiple concurrent targets, and the method we demonstrate here shows a practical method for breaking this limitation. Although some issues still remain in our multicolor imaging technique, the high spatial resolution and the low chromatic-aberration characteristic are additionally advantageous for cellular imaging. The advantages in our technique can also boost confocal microscopy based techniques, such as fluorescence-lifetime imaging microscopy, fluorescence correlation spectroscopy, and fluorescence cross-correlation spectroscopy. On top of that, the visible-wavelength two-photon mode can be combined with laser scanning based super-resolution techniques, such as stimulated emission depletion50 and saturated excitation microscopy.51 AcknowledgmentsThe authors thank S. Kawano for his assistance in developing the laser scanning and fluorescence unmixing software, S. Araki and S. Mizobuchi for their assistance in plasmids preparation, and Professor Y. Inouye for the spectral measurement. This research is partially supported by the Japan Society for the Promotion of Science (JSPS) through the Funding Program for Next Generation World-Leading Researchers (NEXT Program), initiated by the Council for Science and Technology Policy (CSTP), by Photonics Advanced Research Center in Osaka University to K.F., and by the Cooperative Research Program of Network Joint Research Center for Materials and Devices, Precursory Research for Embryonic Science from Japan Science and Technology Agency, and Grant-in-Aid for Scientific Research on Innovative Areas “Spying minority in biological phenomena (No. 3306)” from MEXT to T. N. ReferencesR. N. Day and M. W. Davidson,
“The fluorescent protein palette: tools for cellular imaging,”
Chem. Soc. Rev., 38 2887
–2921
(2009). http://dx.doi.org/10.1039/b901966a CSRVBR 0306-0012 Google Scholar
M. J. Booth et al.,
“Full spectrum filterless fluorescence microscopy,”
J. Microsc., 237
(1), 103
–109
(2010). http://dx.doi.org/10.1111/(ISSN)1365-2818 JMICAR 0022-2720 Google Scholar
S. Dorsch et al.,
“Analysis of receptor oligomerization by FRAP microscopy,”
Nat. Methods, 6
(3), 225
–230
(2009). http://dx.doi.org/10.1038/nmeth.1304 1548-7091 Google Scholar
P. Mahou et al.,
“Multicolor two-photon tissue imaging by wavelength mixing,”
Nat. Methods, 9
(8), 815
–818
(2012). http://dx.doi.org/10.1038/nmeth.2098 1548-7091 Google Scholar
T. Kogure et al.,
“A fluorescent variant of a protein from the stony coral Montipora facilitates dual-color single-laser fluorescence cross-correlation spectroscopy,”
Nat. Biotechnol., 24
(5), 577
–581
(2006). http://dx.doi.org/10.1038/nbt1207 NABIF9 1087-0156 Google Scholar
C. Xu et al.,
“Multiphoton fluorescence excitation: new spectral windows for biological nonlinear microscopy,”
Proc. Natl. Acad. Sci. USA, 93
(20), 10763
–10768
(1996). http://dx.doi.org/10.1073/pnas.93.20.10763 1091-6490 Google Scholar
W. R. Zipfel, R. M. Williams and W. W. Webb,
“Nonlinear magic: multiphoton microscopy in the biosciences,”
Nat. Biotechnol., 21
(11), 1369
–1377
(2003). http://dx.doi.org/10.1038/nbt899 NABIF9 1087-0156 Google Scholar
K. G. Heinze, A. Koltermann and P. Schwille,
“Simultaneous two-photon excitation of distinct labels for dual-color fluorescence crosscorrelation analysis,”
Proc. Natl. Acad. Sci. USA, 97
(19), 10377
–10382
(2000). http://dx.doi.org/10.1073/pnas.180317197 1091-6490 Google Scholar
T. Kogure et al.,
“Fluorescence imaging using a fluorescent protein with a large Stokes shift,”
Methods, 45
(3), 223
–226
(2008). http://dx.doi.org/10.1016/j.ymeth.2008.06.009 MTHDE9 1046-2023 Google Scholar
S. E. Tillo et al.,
“A new approach to dual-color two-photon microscopy with fluorescent proteins,”
BMC Biotechnol., 10
(6), 6
(2010). http://dx.doi.org/10.1186/1472-6750-10-6 BBMIE6 1472-6750 Google Scholar
K. Wang et al.,
“Three-color femtosecond source for simultaneous excitation of three fluorescent proteins in two-photon fluorescence microscopy,”
Biomed. Opt. Express, 3
(9), 1972
–1977
(2012). http://dx.doi.org/10.1364/BOE.3.001972 BOEICL 2156-7085 Google Scholar
M. T. Butko et al.,
“Simultaneous multiple-excitation multiphoton microscopy yields increased imaging sensitivity and specificity,”
BMC Biotechnol., 11
(20), 20
(2011). http://dx.doi.org/10.1186/1472-6750-11-20 BBMIE6 1472-6750 Google Scholar
W. Denk, J. H. Strickler and W. W. Webb,
“Two-photon laser scanning fluorescence microscopy,”
Science, 248
(4951), 73
–76
(1990). http://dx.doi.org/10.1126/science.2321027 SCIEAS 0036-8075 Google Scholar
F. Helmchen and W. Denk,
“Deep tissue two-photon microscopy,”
Nat. Methods, 2
(12), 932
–940
(2005). http://dx.doi.org/10.1038/nmeth818 1548-7091 Google Scholar
A. Diaspro, Confocal and Two-Photon Microscopy: Foundations, Applications, and Advances, Wiley-Liss, Inc., New York
(2001). Google Scholar
G. Norris et al.,
“A promising new wavelength region for three-photon fluorescence microscopy of live cells,”
J. Microsc., 246
(3), 266
–273
(2012). http://dx.doi.org/10.1111/j.1365-2818.2012.03610.x JMICAR 0022-2720 Google Scholar
M. Drobizhev et al.,
“Two-photon absorption properties of fluorescent proteins,”
Nat. Methods, 8
(5), 393
–399
(2011). http://dx.doi.org/10.1038/nmeth.1596 1548-7091 Google Scholar
M. Drobizhev et al.,
“Resonance enhancement of two-photon absorption in fluorescent proteins,”
J. Phys. Chem. B, 111
(50), 14051
–14054
(2007). http://dx.doi.org/10.1021/jp075879k JPCBFK 1520-6106 Google Scholar
T. A. Smith et al.,
“Deep-UV confocal fluorescence imaging and super-resolution optical microscopy of biological samples,”
J. Innov. Opt. Health Sci., 5
(4), 1250025
(2012). http://dx.doi.org/10.1142/S1793545812500253 JIOHAA 1793-7205 Google Scholar
Y. Guo et al.,
“Noninvasive two-photon-excitation imaging of tryptophan distribution in highly scattering biological tissues,”
Opt. Commun., 154
(5–6), 383
–389
(1998). http://dx.doi.org/10.1016/S0030-4018(98)00207-7 OPCOB8 0030-4018 Google Scholar
J. Balaji, R. Desai and S. Maiti,
“Live cell ultraviolet microscopy: a comparison between two- and three-photon excitation,”
Mircosc. Res. Tech., 63
(1), 67
–71
(2004). http://dx.doi.org/10.1002/(ISSN)1097-0029 MRTEEO 1059-910X Google Scholar
K. König et al.,
“Two-photon excited lifetime imaging of autofluorescence in cells during UVA and NIR photostress,”
J. Microsc., 183
(3), 197
–204
(1996). JMICAR 0022-2720 Google Scholar
S. Maiti et al.,
“Measuring serotonin distribution in live cells with three-photon excitation,”
Science, 275
(5299), 530
–532
(1997). http://dx.doi.org/10.1126/science.275.5299.530 SCIEAS 0036-8075 Google Scholar
W. R. Zipfel et al.,
“Live tissue intrinsic emission microscopy using multiphoton-excited native fluorescence and second harmonic generation,”
Proc. Natl. Acad. Sci. USA, 100
(12), 7075
–7080
(2003). http://dx.doi.org/10.1073/pnas.0832308100 1091-6490 Google Scholar
G. Norris et al.,
“Increased signals from short-wavelength-excited fluorescent molecules using sub-Ti:sapphire wavelengths,”
J. Microsc., 248
(2), 200
–207
(2012). http://dx.doi.org/10.1111/jmi.2012.248.issue-2 JMICAR 0022-2720 Google Scholar
F.-J. Kao,
“The use of optical parametric oscillator for harmonic generation and two-photon UV fluorescence microscopy,”
Microsc. Res. Tech., 63
(3), 175
–181
(2004). http://dx.doi.org/10.1002/(ISSN)1097-0029 MRTEEO 1059-910X Google Scholar
S. Quentmeier, S. Denicke and K.-H. Gericke,
“Two-color two-photon fluorescence laser scanning microscopy,”
J. Fluoresc., 19
(6), 1037
–1043
(2009). http://dx.doi.org/10.1007/s10895-009-0503-x JOFLEN 1053-0509 Google Scholar
O. Nakamura,
“A two-photon scanning fluorescence microscope with deep UV excitation and near UV detection,”
Optik, 100
(4), 167
–170
(1995). OTIKAJ 0030-4026 Google Scholar
N. V. Visser et al.,
“Direct observation of resonance tryptophan-to-chromophore energy transfer in visible fluorescent proteins,”
Biophys. Chem., 116
(3), 207
–212
(2005). http://dx.doi.org/10.1016/j.bpc.2005.04.013 BICIAZ 0301-4622 Google Scholar
W. Tomosugi et al.,
“An ultramarine fluorescent protein with increased photostability and pH insensitivity,”
Nat. Methods, 6
(5), 351
–353
(2009). http://dx.doi.org/10.1038/nmeth.1317 1548-7091 Google Scholar
H. W. Ai et al.,
“Exploration of new chromophore structures leads to the identification of improved blue fluorescent proteins,”
Biochemistry, 46
(20), 5904
–5910
(2007). http://dx.doi.org/10.1021/bi700199g BIORAK 0006-2979 Google Scholar
T. Matsuda, A. Miyawaki and T. Nagai,
“Direct measurement of protein dynamics inside cells using a rationally designed photoconvertible protein,”
Nat. Methods, 5
(4), 339
–345
(2008). http://dx.doi.org/10.1038/nmeth.1193 1548-7091 Google Scholar
H. W. Ai et al.,
“Directed evolution of a monomeric, bright and photostable version of Clavularia cyan fluorescent protein: structural characterization and applications in fluorescence imaging,”
Biochem. J., 400
(3), 531
–540
(2006). http://dx.doi.org/10.1042/BJ20060874 BIJOAK 0264-6021 Google Scholar
R. Y. Tsien,
“The green fluorescent protein,”
Annu. Rev. Biochem., 67 509
–544
(1998). http://dx.doi.org/10.1146/annurev.biochem.67.1.509 ARBOAW 0066-4154 Google Scholar
T. Zimmermann et al.,
“Spectral imaging and linear un-mixing enables improved FRET efficiency with a novel GFP2-YFP FRET pair,”
FEBS Lett., 531
(2), 245
–249
(2002). http://dx.doi.org/10.1016/S0014-5793(02)03508-1 FEBLAL 0014-5793 Google Scholar
J. R. Lakowicz, Principles of Fluorescence Spectroscopy, 3rd ed.Springer Science+Business Media, New York
(2006). Google Scholar
S.-P. Jiang et al.,
“Two-photon excitation of proteins,”
Chem. Phys. Lett., 104
(1), 109
–111
(1984). http://dx.doi.org/10.1016/0009-2614(84)85315-4 CHPLBC 0009-2614 Google Scholar
M. Gu, Principles of Three-Dimensional Imaging in Confocal Microscopes, World Scientific, Singapore
(1996). Google Scholar
H. T. M. van der Voort and G. J. Brakenhoff,
“3-D image formation in high-aperture fluorescence confocal microscopy: a numerical analysis,”
J. Microsc., 158
(1), 43
–54
(1990). http://dx.doi.org/10.1111/jmi.1990.158.issue-1 JMICAR 0022-2720 Google Scholar
S. Hell et al.,
“Aberrations in confocal fluorescence microscopy induced by mismatches in refractive index,”
J. Microsc., 169
(3), 391
–405
(1993). http://dx.doi.org/10.1111/jmi.1993.169.issue-3 JMICAR 0022-2720 Google Scholar
T. Nagai et al.,
“A variant of yellow fluorescent protein with fast and efficient maturation for cell-biological applications,”
Nat. Biotechnol., 20
(1), 87
–90
(2002). http://dx.doi.org/10.1038/nbt0102-87 NABIF9 1087-0156 Google Scholar
M. V. Matz et al.,
“Fluorescent proteins from nonbioluminescent Anthozoa species,”
Nat. Biotechnol., 17
(10), 969
–973
(1999). http://dx.doi.org/10.1038/13657 NABIF9 1087-0156 Google Scholar
N. C. Shaner et al.,
“Improved monomeric red, orange and yellow fluorescent proteins derived from Discosoma sp. red fluorescent protein,”
Nat. Biotechnol., 22
(12), 1567
–1572
(2004). http://dx.doi.org/10.1038/nbt1037 NABIF9 1087-0156 Google Scholar
C. J. R. Sheppard and M. Gu,
“Image formation in two-photon fluorescence microscopy,”
Optik, 86
(3), 104
–106
(1990). OTIKAJ 0030-4026 Google Scholar
O. Nakamura,
“Three-dimensional imaging characteristics of laser scan fluorescence microscopy: two-photon excitation vs. single-photon excitation,”
Optik, 93
(1), 39
–42
(1993). OTIKAJ 0030-4026 Google Scholar
L. Parma and N. Omenetto,
“Fluorescence behavior of 7-hydroxycoumarine excited by one-photon and two-photon absorption by means of a tunable dye laser,”
Chem. Phys. Lett., 54
(3), 544
–546
(1978). http://dx.doi.org/10.1016/0009-2614(78)85281-6 CHPLBC 0009-2614 Google Scholar
J. Bewersdorf, R. Pick and S. W. Hell,
“Multifocal multiphoton microscopy,”
Opt. Lett., 23
(9), 655
–657
(1998). http://dx.doi.org/10.1364/OL.23.000655 OPLEDP 0146-9592 Google Scholar
K. Fujita et al.,
“Confocal multipoint multiphoton excitation microscope with microlens and pinhole arrays,”
Opt. Commun., 174
(1–4), 7
–12
(2000). http://dx.doi.org/10.1016/S0030-4018(99)00662-8 OPCOB8 0030-4018 Google Scholar
T. Shimozawa et al.,
“Improving spinning disk confocal microscopy by preventing pinhole cross-talk for intravital imaging,”
Proc. Natl. Acad. Sci. U. S. A, 110
(9), 3399
–3404
(2013). http://dx.doi.org/10.1073/pnas.1216696110 PNASA6 0027-8424 Google Scholar
S. W. Hell and J. Wichmann,
“Breaking the diffraction resolution limit by stimulated emission: stimulated-emission-depletion fluorescence microscopy,”
Opt. Lett., 19
(11), 780
–782
(1994). http://dx.doi.org/10.1364/OL.19.000780 OPLEDP 0146-9592 Google Scholar
K. Fujita et al.,
“High-resolution confocal microscopy by saturated excitation of fluorescence,”
Phys. Rev. Lett., 99
(22), 228105
(2007). http://dx.doi.org/10.1103/PhysRevLett.99.228105 PRLTAO 0031-9007 Google Scholar
|


