
|
|
1.IntroductionPhotoacoustic (PA) microscopy (PAM) has been applied to cellular molecular imaging based on either endogenous contrast agents, such as hemoglobin, melanin or DNA/RNA,1–4 or exogenous contrast agents. The later included dyes and a variety of nanoparticles, in particular gold nanoparticles (GNPs).5–8 In PAM, the light absorbed by the target generates thermoelastic expansion, producing pressure waves which can be detected using an ultrasonic transducer. Since the contrast in this technique originates from light absorption, there is a significant advantage for using GNPs, which have high, wavelength specific, and often tunable optical absorption properties. Not only they can yield increased contrast but they can also be functionalized with antibodies and specifically bind to cancer cells, thus providing molecular contrast for cell imaging.9 However, cellular structure is typically not visible in PAM since the signal originates from the GNPs and not from the cell itself. To provide this missing information, previous studies presented PAM images of cells tagged with GNPs coregistered with either histology or dark-field images that required a separate system.5,6 We have previously shown that quantitative phase imaging (QPI) can provide high quality images of cellular structure.10–13 In this paper, we present a dual-modality system allowing simultaneous acquisition of QPI and PAM images, providing both structural and molecular information on the cell. Skin cancer cells specifically tagged with GNPs functionalized with anti-epidermal growth factor receptor (EGFR) were imaged and compared to untagged cells to demonstrate molecular contrast. This combination of QPI and PAM was also demonstrated on RBCs by using hemoglobin as the source of contrast. A unique aspect of our approach is the use of a low profile and extremely low-cost piezo ceramic (PZT) ring for acoustic detection. Confocal alignment of the optical beam and the acoustic detector is often a challenge in PAM system design. This problem was previously overcome by placing the transducer at an angle,5 by using an optical-acoustic combiner which was optically transparent but acoustically reflective,1 or by using a dark-field illumination scheme, which allowed room for the transducer underneath the optical objective.14 These methods inserted constraints on the system design and made it more cumbersome. Ring ultrasonic transducers4,15,16 or optical ring resonators17 have also been suggested, however, those described in the literature were custom-made and, in some cases, relatively expensive. The PZT ring used here has not been used before for PAM, it is commercially available at a low cost of only a few dollars each, and its implementation for PAM detection allowed simple alignment of the transducer and the optical beams. The remainder of this paper is organized as follows: in Sec. 2, the dual-modality imaging system is discussed, including analysis of factors that impact the signal-to-noise ratio (SNR) in each modality. In Sec. 3, the response and sensitivity of the ring transducer are analyzed. Next, coregistered QPI + PAM images of RBCs and GNP tagged cancer cells are presented, followed by a discussion in Sec. 4. 2.Experimental Setup and MethodsThe imaging system incorporates two imaging modalities: QPI and PAM, as illustrated in Fig. 1(a). The previously demonstrated QPI system is based on off-axis holography.13 Light from a 633-nm He-Ne laser is split into probe and reference arms using a beam splitter, and the reference beam deviates from the optical axis by a small angle of . The probe light, at an optical power around , is transmitted through the sample and collected via a objective (Leica 440 Achro, ) while the reference passes through an identical objective lens and is combined with the probe using a second beam splitter. The resultant interference pattern is focused onto a monochrome charge-coupled device (CCD) (Flea 3, Point Grey). The QPI field of view is , thus requiring no scanning for QPI imaging of a single cell or a few cells in close proximity. Fig. 1(a) Experimental setup: quantitative phase imaging (QPI) component included a He-Ne source split into a reference and a probe beam, both passed through identical objective lenses and were combined onto a charge-coupled device (CCD) camera. The PAM component included a diode-pumped solid-state (DPSS) laser, sinusoidally modulated using an acousto-optic modulator (AOM). The beam passed through a beam expander and an objective lens before hitting the sample. The ultrasonic detection was done with a ring PZT, and the signal was amplified and measured using an RF spectrum analyzer. (b) Ultrasonic ring detector.  The final interference image included the summation of four terms: the intensities of each individual field and the two terms containing cross-correlated information. The linear phase difference between the arms due to the off axis reference field translated into a shift of the interference terms in the Fourier domain. Digital spatial filtering of the Fourier transform of the image isolated a single interference term. Following the filtering, inverse Fourier transform was performed and the phase information was retrieved from the complex signal. Next, a phase unwrapping algorithm was applied to remove ambiguities. The unwrapping algorithm assumes a “smooth” phase profile, meaning a phase change smaller than between adjacent pixels. This is a reasonable assumption for most images of biological samples. Finally, a polynomial fit of the first degree was subtracted from the resulting image to compensate for any tilting of the sample and reveal the detrended phase delays caused by the biological specimen. These image processing algorithms have been elaborated in previous works.10,18 The resulting phase delay is linearly related to the path length and the refractive index :18 where is the optical wavelength.Assuming a shot-noise dominated image, the SNR should be proportional to the square root of the exposure time and the number of averaged images. However, the actual SNR was lower due to coherent artifacts.18 These artifacts were partially reduced by subtracting a background image without the cell. For the cellular phase images, an exposure of 50 ms was implemented, along with averaging 10 images. However, both could be reduced if the light intensity was increased or if we compromised for a lower SNR. The PAM system includes a diode-pumped solid-state (DPSS) 532-nm source (C531005FX, Laserglow Technologies), which is sinusoidally modulated using an acousto-optic modulator (AOM; 1205C, Isomet) driven by an analog modulation radio frequency (RF) driver (532C-L, Isomet). The beam passes through a beam expander, allowing the beam diameter to be varied from 2 to . The beam is focused onto the sample using the QPI probe objective and a notch filter is used to prevent reflected light from the PAM beam from reaching the camera. This filter can be removed in order to observe the location of the PAM beam, which was partially reflected from the sample to the camera, enabling coregistration of the two modalities before each PAM measurement. The optical power of the PAM excitation on the cell samples was around 3 mW. An optical source modulated at frequency with optical intensity , focused on an absorbing target significantly smaller than the acoustic wavelength will generate, via the PA effect, a pressure amplitude at the same frequency:19 where is the thermal expansion coefficient, is the specific heat, is the speed of sound in the surrounding medium, is the fraction of light absorbed by the target, and is the distance between the absorber and the point of measurement. This theoretical value will be compared to the experimental measurements in the following section.The PA pressure wave is detected using a PZT-5H ring element (Boston Piezo-Optics) with an inner diameter of 5.11 mm, wall thickness of 1 mm, and height of 3 mm [Fig. 1(b)]. The PZT is placed directly on the sample dish so both the PA and the QPI beams go through its center and the PA detection is performed on-axis. The PZT ring is connected to electrodes with a micro-coax wire and the output signal is amplified (VCA2615, TI) and demodulated using an RF spectrum analyzer (RFSA; E4411B, Agilent). Since the PA beam was smaller than the imaged cells, the sample was raster scanned at the desired resolution in order to generate a PA image immediately following the acquisition of the wide-field QPI image. For each location, a frequency response of 10 kHz around the modulation frequency was sampled. The response was fitted to a Gaussian and its peak was taken as the image pixel value. If the standard deviation of the fitted Gaussian deviated significantly from the expected value (around 1.3 kHz), the pixel value was set to 0. This method allowed for noise reduction with less averaging. The dominant noise source for the PA image was the amplifier, with a measured noise figure of 23.5 dB around 1 MHz. When measuring with an RFSA, the SNR is inversely proportional to the square root of the resolution bandwidth (RBW), which was limited in this model to 1 kHz or greater. Since the amplifier noise is not affected by the optical intensity, the SNR was linear with the optical intensity, according to Eq. (2). 3.Experimental Results3.1.Detection SensitivityTo measure the sensitivity of the miniature ring transducer, PA measurements were performed on a dry black ink target immersed in water. First, the detection frequency response was characterized by scanning the excitation frequencies and taking the ratio of the values at the modulation frequency with the laser turned on and off. Figure 2(a) shows two distinct resonance peaks around 600 kHz and 1.2 MHz, which are a result of the ring shape and correspond with the harmonics of , with being the detector diameter. Naturally, the PA excitation in the following experiments was performed at one of the resonance frequencies. We have also performed an XY-scan of the transducer location relative to the PA beam to characterize the spatial sensitivity. At the resonance frequency of 1.2 MHz, the PA response dropped by 3 dB when the beam moved from the center of the ring transducer. Next, the PA response of the ink target was measured using a calibrated hydrophone (Y-104S, Sonic Concepts) for comparison to the response of the transducer, for several levels of optical power between 0.96 and 9.5 mW. The laser power was measured before each PA measurement. Also, the laser stability was measured over a period of 10 min and was found to be . The hydrophone was placed from the surface and was lifted during the transducer measurements to avoid blocking the pressure wave propagation. The hydrophone sensitivity was at a frequency of 1 MHz. The transducer response was measured at its resonance frequency of 1.2 MHz and based on the AOM specifications, it could be assumed that the modulation depth is similar to that at 1 MHz. Both the hydrophone and the transducer responses were measured with the RFSA after amplification. A reference signal from the function generator was used to calculate the output voltages before the amplifier. The result, shown in Fig. 2(b), shows that the PA response is linear for these levels of optical excitation. Fig. 2Detection sensitivity estimation: (a) photoacoustic (PA) frequency response: PA signal-to-noise ratio versus excitation modulation frequency. Response showing two distinct resonance frequencies. (b) Voltage output of hydrophone (blue, x markers) and PZT transducer (pink, circle markers) for different levels of optical power. (c) Voltage output versus pressure for the PZT transducer. Pressure reaching the transducer was calculated as 76% of the pressure measured by the hydrophone above the target. The estimated transducer sensitivity was . (d) PA response of the transducer, as measured by the spectrum analyzer, for the maximum optical power (of 9.5 mW). Calculated noise equivalent pressure: .  The pressure reaching the hydrophone was calculated by dividing the voltage by , yielding a maximum pressure of 1.25 Pa. Assuming that the absorption of the ink target is close to 100% and substituting the following values in Eq. (2): ; (for water20); ; ; ; , the calculated pressure is 0.78 Pa, which is on the scale of the measured value. To estimate the pressure reaching the ring transducer, we have assumed that the pressure propagated as a spherical wave without loss, and the transducer detected the pressure wave hemisphere minus the spherical cap above the transducer height. Given the transducer diameter and height, the pressure reaching the transducer for each level of optical power was estimated as 76% of the pressure calculated for the hydrophone. The result is shown in Fig. 2(c), and the transducer sensitivity was estimated from the line slope to be around . The common measure for estimating ultrasonic detection sensitivity is the noise equivalent pressure (NEP), which is the lowest pressure that can be detected by the system.19 Figure 2(d) shows the PA response measured in the RFSA for the maximum optical power, which generated, according to Fig. 2(b) and , a pressure . Since the PA peak was , and assuming that the minimum detectable pressure corresponds to the PA peak reaching the noise floor, the NEP for this RBW should be . To calculate the NEP per , this result should be divided by , yielding . This value is about 20 times higher than typical spherically focused transducers.19 In addition, the detection bandwidth (BW) is only around 100 kHz, significantly narrower than typical commercial transducers, making it even less sensitive if we were comparing pulsed excitation. This is mainly due to the lack of any backing material to dampen the PZT vibrations. The limitations and advantages of using this transducer for different excitation schemes will be further discussed in the next section. 3.2.Imaging Red Blood Cells and Polystyrene SpheresTo demonstrate QPI and PAM dual imaging capabilities, RBCs and polystyrene microspheres mixtures were imaged. The two differ significantly in their shape, refractive index, and optical absorption. The samples included microspheres (4210A, Thermo Scientific), which were centrifuged and resuspended in phosphate buffered saline (PBS). The RBCs were obtained from a human blood drop dissolved in a 1.8% solution of ethylenediaminetetraacetic acid (46-034-Cl, Corning Cellgro) in PBS to prevent coagulation. The blood solution was mixed with a solution of before being mixed with the microsphere solution. The combined solution was dropped onto a fluorodish chamber (FD 6040-100, World Precision Instruments). After standing for 30 min to allow the cells to fix to the surface, the solution was washed and replaced with a fresh PBS + bovine serum albumin solution. The ring transducer was fully immersed in the liquid for acoustic coupling. The sample was imaged with a PA beam size of (full width half max) and scan step of . Ten images were averaged to generate a QPI image and seven PA responses were averaged in the frequency domain to calculate each PA image pixel. The QPI image is presented in Fig. 3(a), showing the characteristic disc shape of the RBC relative to the sphere. The sphere phase is significantly higher due to the higher refractive index difference between it and the surrounding medium (,21 ).22 The PAM image is presented in Fig. 3(b), showing only the RBCs due to lack of optical absorption of the polystyrene at 532 nm. Since QPI already provides a high-resolution image of the discocyte, the PAM beam size was set to a lower resolution to reduce scan time; therefore, the RBC does not appear as a biconcave disc in the PAM image. Figure 3(c) shows a superposition of both images, where a quasi three-dimensional structure is generated from the QPI image and the color is defined by the PAM value. To calculate the height in the -dimension, values of and were assumed. Fig. 3(a) QPI and (b) photoacoustic microscopy (PAM) images of two red blood cells (RBCs; on the left) and one polystyrene sphere (on the right). Subplot on the left in (a) includes RBCs shown in a color span limited to 2 radians. (c) Overlay of PAM value from (b) on the quasi three-dimensional (3-D) structure generated from (a) using and . (Video 1, MPEG, 1.1 MB) [URL: http://dx.doi.org/10.1117/1.JBO.20.8.086002.1]. 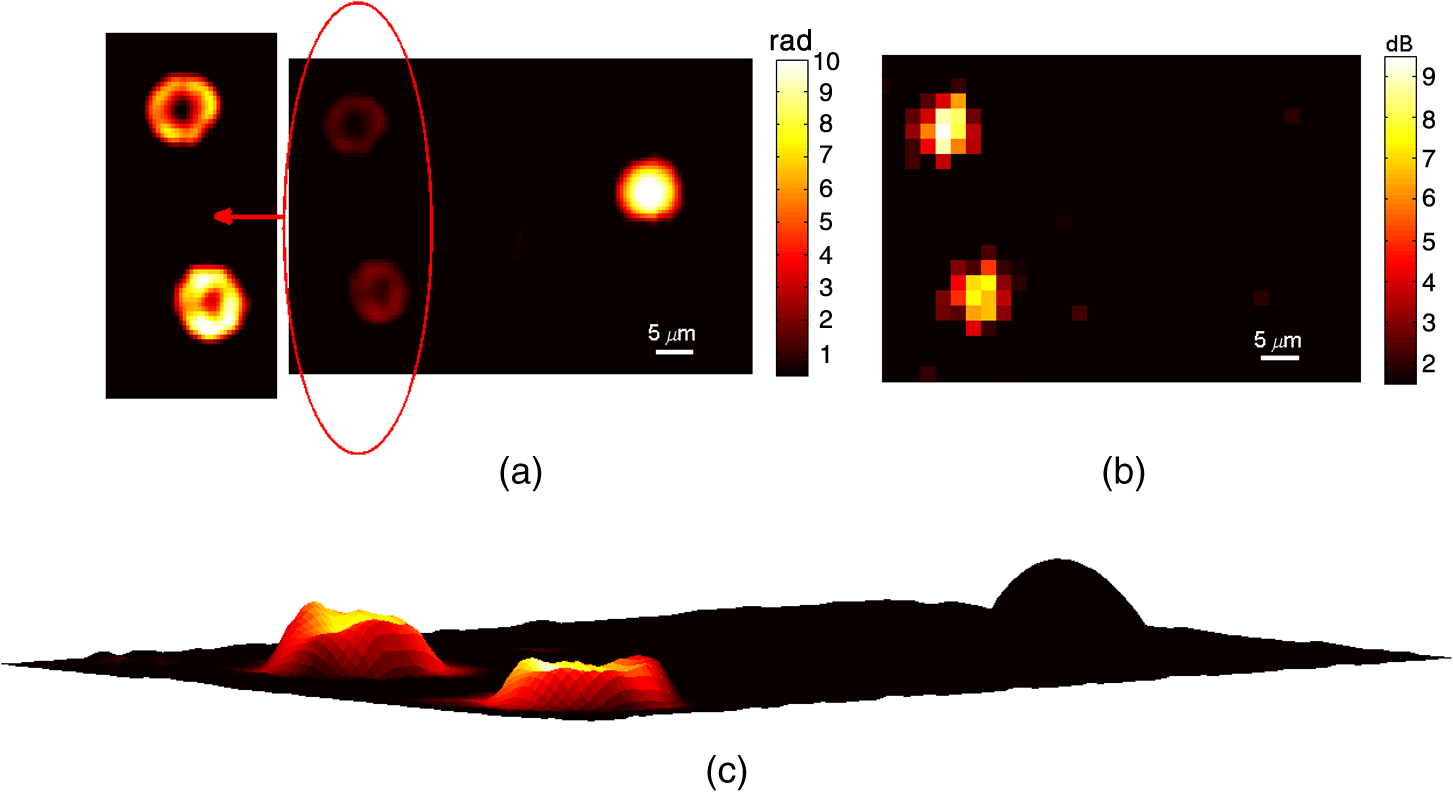 3.3.Imaging Cancer Cells Tagged with Gold NanoparticlesFor imaging cancer cells, A431 human epithelial carcinoma cells were chosen for their high EGFR expression.23 Functionalized GNPs were created and incubated with plated A431 cells, as reported in our previous work.24 Dulbecco’s modified eagle’s medium was used as a cellular media, as well as a coupling media, so that the media covered the extent of the ring transducer. Figure 4 shows the QPI, PAM, and superposition of both images, assuming ,25 for two adjacent cancer cells. These images demonstrate similar phase images for the two cells but a different level of GNP binding, resulting in different PA signals. Two consecutive PA images were taken with different beam dimensions: one with a beam size of and scan step of and one with a beam size of and scan step of . The second demonstrates that a beam approximately the size of the cell can be used for quick estimation of the molecular expression of the cell if the spatial locations of the GNP absorbers within the cell are not of interest. The maximum PA value is higher for the smaller beam size since the GNP distribution in the cells was not homogenous; therefore, the expanded beam covered also area that lacked GNP tagging. However, when using an expanded beam, it should be possible to increase the optical power while preserving the optical power per unit area in order to increase the SNR. In order to confirm molecular specificity, cells which were not exposed to GNPs (negative control) were also imaged, yielding similar QPI images but PA values , a level considered as background noise. These results correspond with our previous study on dark-field imaging of similar cells and GNPs.26 QPI images were also taken after the PAM scan to verify that there was no apparent structural damage to the cells that could have affected the PAM image during scanning. Fig. 4(a) QPI and (b and c) PAM images of two cancer cell tagged with gold nanoparticles. (b) Image was taken with a beam size of and a scan step of and (c) with a beam size of and a scan step of . (d) Overlay of PAM value from (b) on the quasi 3-D structure generated from (a) using . (Video 2, MPEG, 1.3 MB) [URL: http://dx.doi.org/10.1117/1.JBO.20.8.086002.2]. 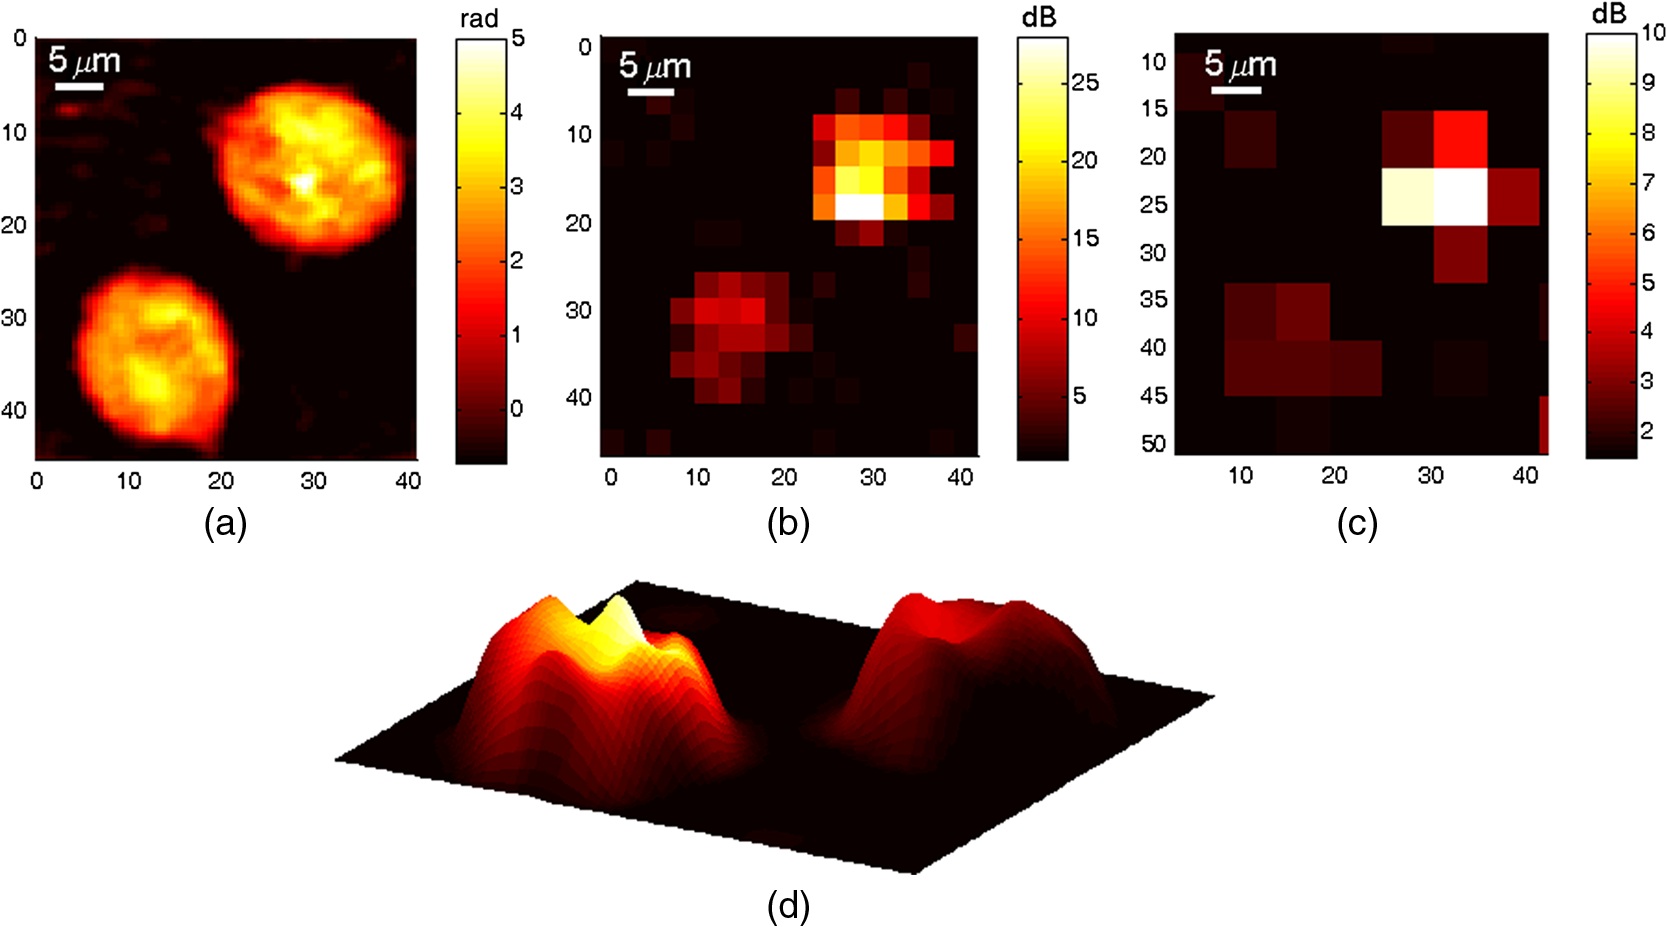 4.DiscussionIn this paper, we have presented two main innovations—the combination of QPI and PAM and the use of a low-cost ring PZT for PA detection. The dual modality is applicable to cellular microscopy requiring both molecular and structural information. Example applications are imaging RBC morphology along with oxygenation and hemoglobin levels, which may apply to the diagnosis of several diseases affecting the RBCs, including malaria and sickle-cell disease, and phenotyping cancer cells tagged with nanoparticles functionalized with various antibodies. The PZT ring enables a very simple and low-cost solution to the challenge of aligning the QPI and PAM beams in addition to the PA ultrasonic detection. However, this comes at the expense of reduced sensitivity and narrower BW compared to the standard focused transducers which are mostly used in PAM systems. For sinusoidal excitation, the system only sacrifices a factor of 20 in sensitivity compared to common PAM systems, however, it would be significantly less sensitive for a wideband pulsed excitation since it would filter out most of the response. Future study may compare the SNR from pulsed versus sinusoidal excitation using this transducer. While pulsed excitation is more efficient for PA than sinusoidal excitation due to the higher peak power,27 there is still a value for using continuous-wave sources, mainly their low cost and small size. In fact, at the power levels used in this system, the excitation could have been performed using low-cost laser diodes. The small dimensions of the ring detector may allow for compact implementation of the system, based on fiber optics for excitation, in a reflection as well as transmission configuration. In the presented work, the QPI acquisition was a few tens of milliseconds, while the PAM acquisition took about (for about 5 averages), therefore, taking at least a few seconds per scan depending on the scanning range and not including overheads of the motor’s motion. However, if PAM spatial resolution is not required, then the beam can be expanded to about the cell size and a single PAM measurement can be taken per cell. In this case, the acquisition time of both modalities will be similar and they can be fully simultaneous. It is of interest also to refer to photothermal imaging (PTI), an imaging modality which is based on the same contrast mechanism as optical absorption, and which has been widely researched for the imaging of GNPs.13,28,29 While in PAM the optical absorption generates a pressure wave which is detected ultrasonically, in PTI the absorption generates local heating which changes the local refractive index, a change that can be detected optically using digital holography or OCT. The different detection mechanisms make it difficult to compare the methods’ performances quantitatively. However, there are a few important differences to note. First, PTI has the advantage of optical detection, which does not require a coupling medium, and for a dual-modality imaging system, the detection can be done using the same camera as for QPI. However, the ultrasonic detection of PAM, which is completely separated from the QPI detection, can be an advantage. It can allow for fully simultaneous imaging in both modalities, while in PTI, the photothermal image cannot be acquired at the same time as the QPI image if the same camera is used for both modalities. It is also important to note that the spatial resolution in PTI is defined by the heat diffusion and a lower excitation modulation frequency results in poorer spatial resolution but a higher SNR.13,29 On the other hand, in PAM, the resolution is defined only by the size of the excitation beam, which does not affect the SNR as long as the beam illuminates a spatially homogenous absorbing target. In summary, coregistered structural and molecular cellular images were obtained using a dual-modality system of QPI and PAM. The use of a small and low-cost ring ultrasonic transducer allowed for a simple confocal implementation and can potentially allow for further minimization of the system dimensions. AcknowledgmentsThis work was supported by an NSF grant (CBET 1445992). We would like to acknowledge Dr. Carl Herickhoff for his assistance with the PZT detectors. AS would like to acknowledge support from the Rothschild Fellowship and the Weizmann Institute of Science—National Postdoctoral Award Program for advancing women in science. W. J. E. would like to acknowledge support from the Pratt-Gardner Fellowship. ReferencesL. Wang, K. Maslov and L. V. Wang,
“Single-cell label-free photoacoustic flowoxigraphy in vivo,”
Proc. Natl. Acad. Sci., 110
(15), 5759
–5764
(2013). http://dx.doi.org/10.1073/pnas.1215578110 Google Scholar
E. I. Galanzha et al.,
“In vivo, noninvasive, label-free detection and eradication of circulating metastatic melanoma cells using two-color photoacoustic flow cytometry with a diode laser,”
Cancer Res., 69
(20), 7926
–7934
(2009). http://dx.doi.org/10.1158/0008-5472.CAN-08-4900 Google Scholar
E. M. Strohm, E. S. L. Berndla and M. C. Kolios,
“High frequency label-free photoacoustic microscopy of single cells,”
Photoacoustics, 1 49
–53
(2013). http://dx.doi.org/10.1016/j.pacs.2013.08.003 Google Scholar
D. Yao et al.,
“In vivo label-free photoacoustic microscopy of cell nuclei by excitation of DNA and RNA,”
Opt. Lett., 35
(24), 4139
–4141
(2010). http://dx.doi.org/10.1364/OL.35.004139 OPLEDP 0146-9592 Google Scholar
J. R. Cook, W. Frey and S. Emelianov,
“Quantitative photoacoustic imaging of nanoparticles in cells and tissues,”
ACS Nano, 7
(2), 1272
–1280
(2013). http://dx.doi.org/10.1021/nn304739s ANCAC3 1936-0851 Google Scholar
S. Mallidi et al.,
“On sensitivity of molecular specific photoacoustic imaging using plasmonic gold nanoparticles,”
in IEEE Engineering in Medicine and Biology Society,
6338
–6340
(2009). Google Scholar
S. Yang, F. Ye and D. Xing,
“Intracellular label-free gold nanorods imaging with photoacoustic microscopy,”
Opt. Express, 20
(9), 10370
–10375
(2012). http://dx.doi.org/10.1364/OE.20.010370 OPEXFF 1094-4087 Google Scholar
G. P. Luke, D. Yeager and S. Y. Emelianov,
“Biomedical applications of photoacoustic imaging with exogenous contrast agents,”
Ann. Biomed. Eng., 40
(2), 422
–437
(2012). http://dx.doi.org/10.1007/s10439-011-0449-4 ABMECF 0090-6964 Google Scholar
I. H. El-Sayed, X. Huang and M. A. El-Sayed,
“Surface plasmon resonance scattering and absorption of anti-EGFR antibody conjugated gold nanoparticles in cancer diagnostics: applications in oral cancer,”
Nano Lett., 5
(5), 829
–834
(2005). http://dx.doi.org/10.1021/nl050074e NALEFD 1530-6984 Google Scholar
N. T. Shaked et al.,
“Two-step-only phase-shifting interferometry with optimized detector bandwidth for microscopy of live cells,”
Opt. Express, 17
(18), 15585
–15591
(2009). http://dx.doi.org/10.1364/OE.17.015585 OPEXFF 1094-4087 Google Scholar
N. T. Shaked, M. T. Rinehart and A. Wax,
“Dual-interference-channel quantitative phase microscopy of live cell dynamics,”
Opt. Lett., 34
(6), 767
–769
(2009). http://dx.doi.org/10.1364/OL.34.000767 OPLEDP 0146-9592 Google Scholar
N. T. Shaked et al.,
“Quantitative microscopy and nanoscopy of sickle red blood cells performed by wide field digital interferometry,”
J. Biomed. Opt., 16
(3), 030506
(2011). http://dx.doi.org/10.1117/1.3556717 JBOPFO 1083-3668 Google Scholar
W. J. Eldridge et al.,
“Fast wide-field photothermal and quantitative phase cell imaging with optical lock-in detection,”
Biomed. Opt. Express, 5
(8), 2517
–2525
(2014). http://dx.doi.org/10.1364/BOE.5.002517 Google Scholar
H. Wang et al.,
“Reflection-mode optical-resolution photoacoustic microscopy based on a reflective objective,”
Opt. Express, 21
(20), 24210
–24218
(2013). http://dx.doi.org/10.1364/OE.21.024210 OPEXFF 1094-4087 Google Scholar
H. Estrada et al.,
“Real-time optoacoustic brain microscopy with hybrid optical and acoustic resolution,”
Laser Phys. Lett., 11
(4), 045601
(2014). http://dx.doi.org/10.1088/1612-2011/11/4/045601 1612-2011 Google Scholar
L. Xi et al.,
“ Evaluation of breast tumor margins in vivo with intraoperative photoacoustic imaging,”
Opt. Express, 20
(8), 8726
–8731
(2012). http://dx.doi.org/10.1364/OE.20.008726 OPEXFF 1094-4087 Google Scholar
S. Chen et al.,
“A fiber-optic system for dual-modality photoacoustic microscopy and confocal fluorescence microscopy using miniature components,”
Photoacoustics, 1 30
–35
(2013). http://dx.doi.org/10.1016/j.pacs.2013.07.001 Google Scholar
M. T. Rinehart, Y. Zhu and A. Wax,
“Quantitative phase spectroscopy,”
Biomed. Opt. Express, 3
(5), 958
–965
(2012). http://dx.doi.org/10.1364/BOE.3.000958 BOEICL 2156-7085 Google Scholar
A. M. Winkler, K. Maslov and L. V. Wang,
“Noise-equivalent sensitivity of photoacoustics,”
J. Biomed. Opt., 18
(9), 097003
(2013). http://dx.doi.org/10.1117/1.JBO.18.9.097003 JBOPFO 1083-3668 Google Scholar
W. M. Haynes, CRC Handbook of Chemistry and Physics, 95th ed.CRC Press/Taylor and Francis, Boca Raton, Florida
(2015). Google Scholar
J. E. Mark,
“Polystyrene,”
Polymer Data Handbook, Oxford University Press, New York
(1998). Google Scholar
Y. Park et al.,
“Refractive index maps and membrane dynamics of human red blood cells parasitized by Plasmodium falciparum,”
Proc. Natl. Acad. Sci., 105
(37), 13730
–13735
(2008). http://dx.doi.org/10.1073/pnas.0806100105 Google Scholar
J. A. Fernandez-Pol,
“Epidermal growth factor receptor of A431 cells,”
J. Biol. Chem., 260
(8), 5003
–5011
(1985). JBCHA3 0021-9258 Google Scholar
K. Seekell et al.,
“Optimization of immunolabeled plasmonic nanoparticles for cell surface receptor analysis,”
Methods, 56
(2), 310
–316
(2012). http://dx.doi.org/10.1016/j.ymeth.2011.08.017 MTHDE9 1046-2023 Google Scholar
W. J. Choi et al.,
“Full-field optical coherence microscopy for identifying live cancer cells by quantitative measurement of refractive index distribution,”
Opt. Express, 18
(22), 23285
–23295
(2010). http://dx.doi.org/10.1364/OE.18.023285 OPEXFF 1094-4087 Google Scholar
A. C. Curry, M. Crow and A. Wax,
“Molecular imaging of epidermal growth factor receptor in live cells with refractive index sensitivity using dark-field microspectroscopy and immunotargeted nanoparticles,”
J. Biomed. Opt., 13
(1), 014022
(2008). http://dx.doi.org/10.1117/1.2837450 JBOPFO 1083-3668 Google Scholar
K. Maslov and L. V. Wang,
“Photoacoustic imaging of biological tissue with intensity-modulated continuous-wave laser,”
J. Biomed. Opt., 13
(2), 024006
(2008). http://dx.doi.org/10.1117/1.2904965 JBOPFO 1083-3668 Google Scholar
A. Gaiduk et al.,
“Detection limits in photothermal microscopy,”
Chem. Sci., 1
(3), 343
–350
(2010). http://dx.doi.org/10.1039/c0sc00210k 1478-6524 Google Scholar
C. Pache et al.,
“Fast three-dimensional imaging of gold NPs in living cells with photothermal optical lock-in optical coherence microscopy,”
Opt. Express, 20
(19), 21385
–21399
(2012). http://dx.doi.org/10.1364/OE.20.021385 OPEXFF 1094-4087 Google Scholar
BiographyAdi Sheinfeld is a postdoctoral fellow at Duke University in Durham, North Carolina. She received her BSE in electrical engineering at the Technion in Haifa, Israel, and her MSE and PhD in electrical engineering at Tel-Aviv University in Tel-Aviv, Israel. Will J. Eldridge is a doctoral graduate student at Duke University in Durham, North Carolina. He received his BS in applied sciences—biomedical engineering from the University of North Carolina in Chapel Hill and his MS in biomedical engineering from Duke University. Adam Wax joined the faculty of the biomedical engineering department at Duke University in 2002 and is currently the Theodore Kennedy professor of biomedical engineering. He received his PhD in physics from Duke in 1999 and completed his postdoctoral training at MIT. His research interests include optical spectroscopy for early cancer detection, novel microscopy, and interferometry techniques. |


