|
|
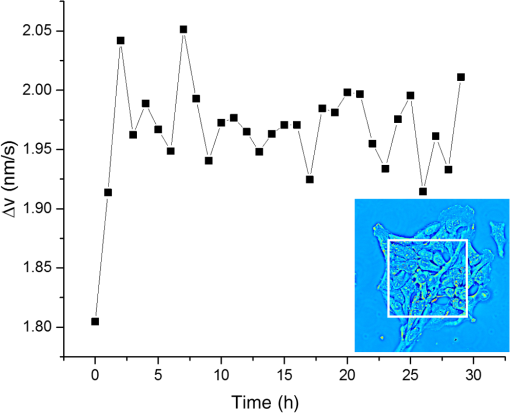
1.Introduction1.1.Intracellular TransportThroughout its cycle, a living cell is subject to highly dynamic processes, coordinated in both time and space.1,2 Despite great progress on the subject, intracellular transport remains insufficiently understood.3–5 Trafficking at intracellular level results from both thermal diffusion and activity of molecular motors.6 This process has been examined through techniques that generally rely on fluorescence imaging,7 e.g., fluorescent speckle microscopy,8 fluorescence correlation spectroscopy,9 fluorescence resonance energy transfer,10 fluorescence recovery after photobleaching,11 and fluorescence lifetime imaging microscopy.12 Recently, there has been significant progress in superlocalization microscopy, such as stochastic optical reconstruction microscopy,13 photoactivated localization microscopy,14,15 and their precursor, fluorescence imaging with one nanometer accuracy,16 which are closing the gap between cellular and molecular scale biology. In combination with fluorescence microscopy, particle tracking is a widely used approach for studying the transport of discrete objects inside the cell, such as embedded particles, organelles, and vesicles.17–20 Analyzing the trajectories of these particles in terms of their mean squared displacements provides valuable information about the nature of transport and even the rheology of the surrounding medium.21 However, this approach has limited applicability when the system of interest is continuous, such as actin and microtubule cytoskeleton at spatial scales larger than the mesh size. Furthermore, particle tracking does not contain explicit spatial information. In this paper, we study the spatiotemporal dynamics of mass transport in unlabeled cells, quantifying differences between nuclear and cytoplasmic mass traffic. We are able to access numeric values associated with both active and passive transport simultaneously and faster than particle tracking-based approaches. We performed “dispersion-relation” analysis to quantify spatiotemporal transport, which can be used for both continuous and discrete mass distributions.22,23 Due to the label-free method employed, our measurements are not limited by photobleaching or photoxicity, and thus can monitor cell dynamics over broad time scales and multiple cell cycles. We used spatial light interference microscopy (SLIM), which is a highly sensitive form of quantitative phase imaging (QPI), implemented as an add-on to an existing phase contrast microscope. 1.2.Quantitative Phase ImagingQPI has received tremendous scientific interest, especially in the past decade.24,25 Since the 1950s, scientists have recognized the potential of optical phase to provide “quantitative” information about biological specimens, including cell dry mass.26,27 QPI, in which the optical path length map across a specimen is measured, has become a rapidly emerging field with important applications in biomedicine.28 QPI utilizes the fact that the phase of a field is much more sensitive to the specimen structure than its amplitude. As fields from the source interact with the specimen, phase shifts are induced in the scattered field with respect to the incident light. This phase shift contains the desired structural information about the sample under investigation. However, cameras and detectors can only measure intensity. To obtain the phase information, interference methods must be employed. Recently, a number of such methods have been developed from various groups around the world.29–42 2.Imaging2.1.Spatial Light Interference MicroscopyWe use SLIM43,44 to quantitatively obtain the path length differences from the phase images without staining the samples. SLIM is based on the principles of phase contrast microscopy45 and holography46 and introduces additional phase delays between the scattered and incident light. As a result, SLIM enables retrieving quantitative phase information of unstained samples, including live cells, with high sensitivity due to the low level of spatial noise (0.3 nm) and temporal stability (0.03 nm).43,44 Recently, SLIM has become a useful tool for research in several biomedical areas.47–54 In particular, SLIM is a valuable tool for studying intracellular transport across a broad range of spatiotemporal scales, as detailed in the next Sec. 2.2.22,23,55 For all the measurements presented here, we used the commercial SLIM module (Q100, Phi Optics, Inc.), which yields 4 MP images, at maximum acquisition rate of , and is fully programmable in terms of data acquisition. The module was coupled to a motorized inverted microscope (AxioObserver Z1, Zeiss), equipped with an incubator and temperature, humidity, and control for long-term live cell imaging. 2.2.Dispersion-Relation Phase SpectroscopyUsing SLIM, we can measure the changes in the optical path length through live specimens. These changes in the optical path length are proportional to the values of the dry mass in the cell.52 Intracellular transport measurements are performed in the focal plane. In this way, our analysis provides information about two-dimensional (2-D) transport. While a live cell is a three-dimensional (3-D) system, mass movement has, to the same approximation, the same statistical behavior in 2-D and 3-D. The temporal autocorrelation associated with the dry mass density, (in ), is defined as where is the density data outputted by SLIM and the angular brackets denoted averaging over a time-varying ensemble. We assume ergodicity, such that, in practice, we replace the ensemble average with a time average. Since the intracellular transport is due to both random and deterministic contributions, satisfies the “advection–diffusion” equation:22,23In Eq. (2), is the diffusion coefficient of the Brownian (diffusion) component and is the velocity of the active (deterministic) component. In order to solve for , we use Fourier transform [Eq. (2)] with respect to and use the differentiation properties of the Fourier transform to obtain where is the angular spatial frequency or mode and the variable conjugate to . Equation (3) is first order in time; through integration we obtain the solutionwhere we assumed is normalized such that .Equation (4) indicates that a mass drift at constant velocity introduces a sinusoidal modulation to the autocorrelation function. Clearly, in a living cell we expect a distribution of velocities, with various magnitudes and orientations, say , where is the mean velocity. Averaging the autocorrelation function over the ensemble of velocity distribution yields Note that the integral in Eq. (5) amounts to a Fourier transform with respect to velocity . The conjugated variable is . Thus, Eq. (5) can be rewritten as where is the Fourier transform of shifted at , i.e., the Fourier transform of the zero-average velocity distribution. Again, we note a sinusoidal modulation term, , in which this time is due to the dominant (mean) velocity, .If we consider the second-order Taylor expansion of about the origin, we can obtain an analytic expression for Eq. (6) that is not dependent on the specific shape of . We start with the expansion of and assuming isotropy, i.e., , we find Next, we use the “central ordinate theorem” (see, e.g., Chapter 2 in Ref. 24) to identify each term in the expansion of with the moments of , namely In deriving Eq. (8), we used the fact that is a probability density, such that it is normalized to unit area. For Eq. (9), in addition to the central ordinate theorem, we also used the differentiation theorem, , where indicates Fourier transformation. Deriving Eq. (10) requires the use of the differentiation theorem twice, . Note that Eq. (9) amounts to the first-order moment of , which is zero (already shifted the origin of the velocity distribution at ). Finally, Eq. (10) gives the variance of the velocity distribution, . Combining Eqs. (7) and (8), we obtain Therefore, the velocity averaged autocorrelation function, which is the main quantity of interest, is computed from our data as In all the measurements presented here, we did not observe a dominant velocity, . This can be readily understood by an equal probability for the mass to be transported in opposite directions. Thus, with , Eq. (12) can be expressed in the frequency domain as where is the bandwidth and we used the knowledge that the Fourier transform of an exponential, , is a Lorentzian, . Importantly, the expression for the bandwidth (or decay rate) amounts to a (ensemble averaged) “dispersion relation”:Equation (14) relates the spatial frequency (mode) , with a temporal frequency quantity, , the diffusion coefficient, , and the standard deviation of the velocity distribution, . The expression shown in Eq. (14) combines the spatiotemporal frequencies associated with mass transport, where the active transport is expressed by the linear term and the passive transport with the quadratic term in . Hence, through QPI and dispersion-relation analysis, it is possible to retrieve information about and distinguish between both active and passive intracellular transport. 2.3.Cell Culture PreparationThe sample under study consists of living HeLa cells from human cervix. The cells were grown in adherent growth mode in Dulbecco’s modified Eagle medium containing 10% fetal calf serum and antibiotics. The cells were imaged under controlled physiological conditions, 37°C and 5% , using a petri dish. HeLa cells were imaged with the SLIM setup (see Sec. 2.1), using a objective, over a 30 h time period with an acquisition rate of , across eight clusters of cells. 3.ResultsIn order to study intracellular transport, randomly selected regions in both the cytoplasm and nucleus of each cell were examined. The white boxes in Fig. 1 show examples of such regions. Once the regions of interest are selected, we maintain the same region on the cell to perform the analysis over time. Following the dispersion-relation phase spectroscopy (DPS) analysis described in Sec. 2.2, we calculate the temporal autocorrelation function of 2-D mass density for each spatial frequency, within each region. This temporal autocorrelation function decays exponentially according to Eq. (3), which denotes the dispersion-relation associated with the intracellular transport. Figure 2 shows that by fitting the experimental data of , that is, the decay rate as a function of wave number, , it is possible to obtain information about the standard deviation of velocity in the case of active transport, as well as the diffusion coefficient for passive transport. Note that the flattening of the data at high is due to the resolution of the microscope, which is diffraction limited. Fig. 1Spatial light interference microscopy image of four live HeLa cells. Color bar indicates cell thickness computed from phase measurements. White boxes illustrate regions of interest where the dispersion-relation phase spectroscopy analysis is performed (Video 1, MOV, 1.9 MB) [URL: http://dx.doi.org/10.1117/1.JBO.20.11.111209.1]. 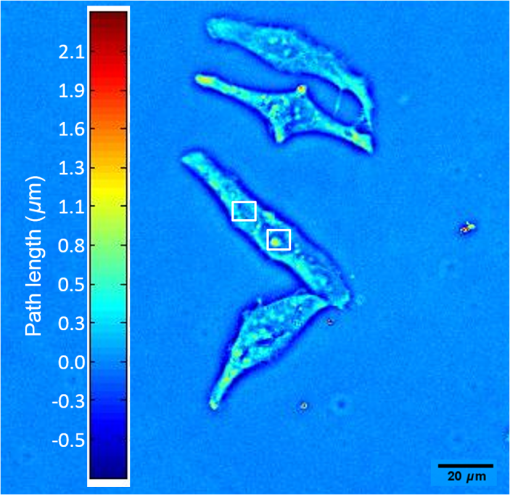 Fig. 2Azimuthal average of to obtain , plotted in log–log scale. By fitting this experimental curve with a function, it is possible to measure the standard deviation of the velocity distribution in active transport. Fitting with a function gives information about the diffusion coefficient in passive transport. This analysis was made on A549 lung cancer cells with an acquisition rate of , . 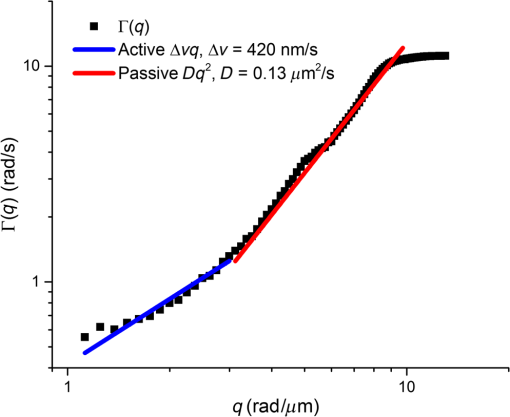 In order to compare the dynamics of active transport, we retrieved the standard deviation velocities inside the nucleus and the cytoplasm for nine cells, over the 30 h time period. In doing so, it was possible to determine when cellular division occurs for each cell, as depicted in Fig. 3. In the cytoplasm, it was observed that immediately prior to the division process, the standard deviation of velocities decreases and then suddenly increases after cell division. However, in the nucleus, these changes do not seem to be significant. Fig. 3Standard deviation of the velocity distribution, , over 30 h for one cell. Black line shows the dynamics inside the cytoplasm and red line shows the dynamics inside the nucleus, as indicated. 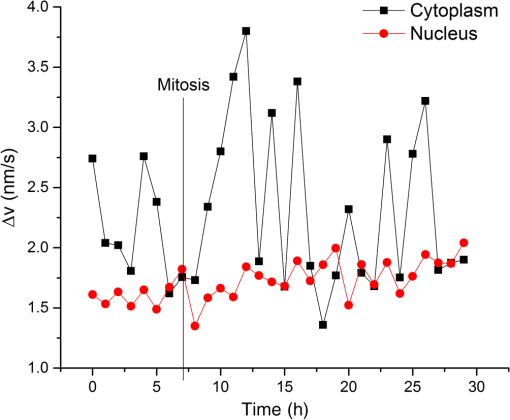 The standard deviation of velocities in both the nucleus and the cytoplasm do not exhibit an explicit trend over time, therefore, to determine if the velocity in the cytoplasm is statistically different from the velocity in the nucleus, we use the -test56 with a 95% confidence interval. For this analysis, the null hypothesis () is that both cellular components (i.e., nucleus and cytoplasm) are equal. Therefore, if the average -values for standard deviation of velocities are less than 5%, we can reject , i.e., both sample regions are statistically different. The mean values of the standard deviation of velocity, in both the cytoplasm and nucleus, for nine cells are provided in Fig. 4. In all cases, these were statistically different according to -test conditions outlined above, since the average of -values (0.0042) is much smaller than 0.05 (5%). Fig. 4Average and standard deviation error bars (measurements/cell) of for individual cells, monitored over 30 h. Velocity distribution in the cytoplasm is statistically significantly broader than in the nucleus, according to the -test with 95% significance. The -values are indicated for each cell. 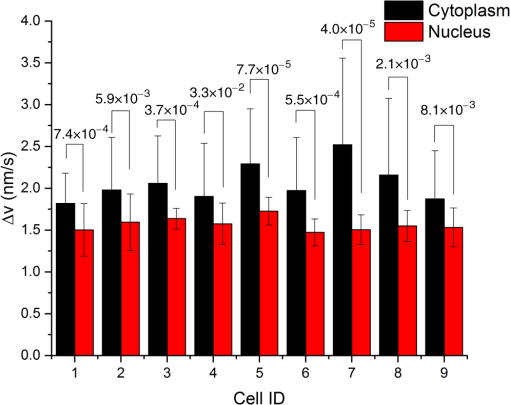 We note that DPS works equally well for regions that are larger than a single cell. The information in this case is averaged over that particular spatial scale. In order to compare such large-scale measurements with the results above of intracellular domains, we studied the active transport in a cell cluster over 30 h. The domain analyzed is shown in the inset of Fig. 5. The standard deviation for this cell cluster was measured every 20 min. As shown in Fig. 5, the standard deviation of the velocity distribution falls in the range measured earlier for subcellular regions. Interestingly, we found a small but consistent increase in the standard deviation over the measurement window. This trend may suggest that as the cell cluster forms intercellular connections, the probability for faster transport velocity increases, broadening the velocity distribution. This type of measurement may reveal new knowledge about, for example, proliferation and migration of tumor cells. 4.SummaryHere we studied, for the first time to our knowledge, intracellular transport over periods longer than a cell cycle. This type of study is possible due to the label-free imaging method used, SLIM, and dispersion-relation analysis, which allows us to decouple active from passive mass transport. Interestingly, we found that the active component of transport is characterized by a significantly narrower velocity distribution in the nucleus than in the cytoplasm. These findings suggest that the active transport in the cytosol contains higher velocities than in the nucleus. Finally, we observed that cell clusters are characterized by a velocity distribution that broadens in time. This result may be related to cell–cell communication processes, which favor faster transport across cell populations. The approach presented here may open the door for other studies in cell biology. Due to the absence of fluorescent markers, the investigation can be applied, in principle, over arbitrarily long periods of time. However, in the future, combining SLIM and fluorescence imaging may enable interesting studies in which the quantitative information from SLIM can be understood simultaneously with specificity from fluorescence markers. AcknowledgmentsWe would like to express our special gratitude to Jon Liang, Matthew Leslie, and Dr. Gaskins for preparing the cells used in the measurements. Silvia Ceballos is grateful to the Administrative Department of Science, Technology and Innovation of the Government of Colombia (Colciencias, http://www.colciencias.gov.co/) and the National University of Colombia at Bogotá for their support of this study. This research was supported by the National Science Foundation (CBET-1040462 MRI, CBET-0939511 STC), Agilent Laboratories, and Phi Optic, Inc. For more information, visit http://light.ece.uiuc.edu/. Competing Interests G. P. has financial interest in Phi Optics, Inc., a company developing quantitative phase imaging technology for materials and life science applications. ReferencesW. Alt, Dynamics of Cells and Tissue Motion, Birkhauser, Basel, Boston
(1997). Google Scholar
M. R. K. Mofrad and R. D. Kamm, Cytoskeletal Mechanics: Models and Measurements, Cambridge University Press, Cambridge, New York
(2006). Google Scholar
M. Schuh,
“An actin-dependent mechanism for long-range vesicle transport,”
Nat. Cell Biol., 13 1431
–U115
(2011). http://dx.doi.org/10.1038/ncb2353 NCBIFN 1465-7392 Google Scholar
M. Often et al.,
“Local motion analysis reveals impact of the dynamic cytoskeleton on intracellular subdiffusion,”
Biophys. J., 102 758
–767
(2012). http://dx.doi.org/10.1016/j.bpj.2011.12.057 BIOJAU 0006-3495 Google Scholar
J. M. Trifaro, S. Gasman and L. M. Gutierrez,
“Cytoskeletal control of vesicle transport and exocytosis in chromaffin cells,”
Acta Physiol., 192 165
–172
(2008). http://dx.doi.org/10.1111/j.1748-1716.2007.01808.x APACAB 0001-6756 Google Scholar
R. Wang et al.,
“Dispersion-relation phase spectroscopy of intracellular transport,”
Opt. Express, 19 20571
–20579
(2011). http://dx.doi.org/10.1364/OE.19.020571 OPEXFF 1094-4087 Google Scholar
J. L. Ross, M. Y. Ali and D. M. Warshaw,
“Cargo transport: molecular motors navigate a complex cytoskeleton,”
Curr. Opin. Cell Biol., 20 41
–47
(2008). http://dx.doi.org/10.1016/j.ceb.2007.11.006 COCBE3 0955-0674 Google Scholar
G. Danuser and C. M. Waterman-Storer,
“Quantitative fluorescent speckle microscopy of cytoskeleton dynamics,”
Annu. Rev. Biophys. Biomol. Struct., 35 361
–387
(2006). http://dx.doi.org/10.1146/annurev.biophys.35.040405.102114 ABBSE4 1056-8700 Google Scholar
O. Krichevsky and G. Bonnet,
“Fluorescence correlation spectroscopy: the technique and its applications,”
Rep. Prog. Phys., 65 251
–297
(2002). http://dx.doi.org/10.1088/0034-4885/65/2/203 RPPHAG 0034-4885 Google Scholar
B. N. G. Giepmans et al.,
“Review—the fluorescent toolbox for assessing protein location and function,”
Science, 312 217
–224
(2006). http://dx.doi.org/10.1126/science.1124618 SCIEAS 0036-8075 Google Scholar
E. A. J. Reits and J. J. Neefjes,
“From fixed to FRAP: measuring protein mobility and activity in living cells,”
Nat. Cell Biol., 3 E145
–E147
(2001). http://dx.doi.org/10.1038/35078615 NCBIFN 1465-7392 Google Scholar
T. W. J. Gadella, T. M. Jovin and R. M. Clegg,
“Fluorescence lifetime imaging microscopy (FLIM)—spatial-resolution of microstructures on the nanosecond time-scale,”
Biophys. Chem., 48 221
–239
(1993). http://dx.doi.org/10.1016/0301-4622(93)85012-7 BICIAZ 0301-4622 Google Scholar
M. J. Rust, M. Bates and X. W. Zhuang,
“Sub-diffraction-limit imaging by stochastic optical reconstruction microscopy (STORM),”
Nat. Methods, 3 793
–795
(2006). http://dx.doi.org/10.1038/nmeth929 1548-7091 Google Scholar
E. Betzig et al.,
“Imaging intracellular fluorescent proteins at nanometer resolution,”
Science, 313 1642
–1645
(2006). http://dx.doi.org/10.1126/science.1127344 SCIEAS 0036-8075 Google Scholar
S. T. Hess, T. P. K. Girirajan and M. D. Mason,
“Ultra-high resolution imaging by fluorescence photoactivation localization microscopy,”
Biophys. J., 91 4258
–4272
(2006). http://dx.doi.org/10.1529/biophysj.106.091116 BIOJAU 0006-3495 Google Scholar
A. Yildiz et al.,
“Myosin V walks hand-over-hand: Single fluorophore imaging with 1.5-nm localization,”
Science, 300 2061
–2065
(2003). http://dx.doi.org/10.1126/science.1084398 SCIEAS 0036-8075 Google Scholar
X. Trepat et al.,
“Universal physical responses to stretch in the living cell,”
Nature, 447 592
(2007). http://dx.doi.org/10.1038/nature05824 Google Scholar
B. Fabry et al.,
“Scaling the microrheology of living cells,”
Phys. Rev. Lett., 87 148102
(2001). http://dx.doi.org/10.1103/PhysRevLett.87.148102 PRLTAO 0031-9007 Google Scholar
A. Caspi, R. Granek and M. Elbaum,
“Enhanced diffusion in active intracellular transport,”
Phys. Rev. Lett., 85 5655
–5658
(2000). http://dx.doi.org/10.1103/PhysRevLett.85.5655 PRLTAO 0031-9007 Google Scholar
D. Mizuno et al.,
“Nonequilibrium mechanics of active cytoskeletal networks,”
Science, 315 370
–373
(2007). http://dx.doi.org/10.1126/science.1134404 SCIEAS 0036-8075 Google Scholar
F. Gittes et al.,
“Microscopic viscoelasticity: shear moduli of soft materials determined from thermal fluctuations,”
Phys. Rev. Lett., 79 3286
–3289
(1997). http://dx.doi.org/10.1103/PhysRevLett.79.3286 PRLTAO 0031-9007 Google Scholar
R. Wang et al.,
“Dispersion-relation fluorescence spectroscopy,”
Phys. Rev. Lett., 109 188104
(2012). http://dx.doi.org/10.1103/PhysRevLett.109.188104 PRLTAO 0031-9007 Google Scholar
R. Wang et al.,
“Dispersion-relation phase spectroscopy of intracellular transport,”
Opt. Express, 19 20571
–20579
(2011). http://dx.doi.org/10.1364/OE.19.020571 Google Scholar
G. Popescu, Quantitative Phase Imaging of Cells and Tissues, McGraw-Hill, New York
(2011). Google Scholar
M. Mir et al.,
“Quantitative phase imaging,”
Prog. Optics, 57 133
–217
(2012). http://dx.doi.org/10.1117/12.2192892 POPTAN 0079-6638 Google Scholar
H. G. Davies and M. H. F. Wilkins,
“Interference microscopy and mass determination,”
Nature, 169 541
–541
(1952). http://dx.doi.org/10.1038/169541a0 Google Scholar
R. Barer,
“Interference microscopy and mass determination,”
Nature, 169 366
(1952). http://dx.doi.org/10.1038/169366b0 Google Scholar
G. Popescu, Quantitative Phase Imaging of Cells and Tissues, McGraw-Hill, New York
(2011). Google Scholar
A. Barty et al.,
“Quantitative optical phase microscopy,”
Opt. Lett., 23 817
–819
(1998). http://dx.doi.org/10.1364/OL.23.000817 OPLEDP 0146-9592 Google Scholar
C. L. Curl et al.,
“Quantitative phase microscopy: A new tool for investigating the structure and function of unstained live cells,”
Clin. Exp. Pharmacol. Physiol., 31 896
–901
(2004). http://dx.doi.org/10.1111/j.1440-1681.2004.04100.x Google Scholar
F. Charriere et al.,
“Cell refractive index tomography by digital holographic microscopy,”
Opt. Lett., 31 178
–180
(2006). http://dx.doi.org/10.1364/OL.31.000178 OPLEDP 0146-9592 Google Scholar
P. Marquet et al.,
“Digital holographic microscopy: a noninvasive contrast imaging technique allowing quantitative visualization of living cells with subwavelength axial accuracy,”
Opt. Lett., 30 468
–470
(2005). http://dx.doi.org/10.1364/OL.30.000468 OPLEDP 0146-9592 Google Scholar
F. Dubois, L. Joannes and J. C. Legros,
“Improved three-dimensional imaging with a digital holography microscope with a source of partial spatial coherence,”
Appl. Opt., 38 7085
–7094
(1999). http://dx.doi.org/10.1364/AO.38.007085 APOPAI 0003-6935 Google Scholar
C. J. Mann et al.,
“High-resolution quantitative phase-contrast microscopy by digital holography,”
Opt. Express, 13 8693
–8698
(2005). http://dx.doi.org/10.1364/OPEX.13.008693 Google Scholar
A. Khmaladze, M. Kim and C. M. Lo,
“Phase imaging of cells by simultaneous dual-wavelength reflection digital holography,”
Opt. Express, 16 10900
(2008). http://dx.doi.org/10.1364/OE.16.010900 OPEXFF 1094-4087 Google Scholar
N. T. Shaked et al.,
“Two-step-only phase-shifting interferometry with optimized detector bandwidth for microscopy of live cells,”
Opt. Express, 17 15585
–15591
(2009). http://dx.doi.org/10.1364/OE.17.015585 OPEXFF 1094-4087 Google Scholar
K. J. Chalut, W. J. Brown and A. Wax,
“Quantitative phase microscopy with asynchronous digital holography,”
Opt. Express, 15 3047
–3052
(2007). http://dx.doi.org/10.1364/OE.15.003047 OPEXFF 1094-4087 Google Scholar
C. Yang et al.,
“Phase-referenced interferometer with subwavelength and subhertz sensitivity applied. to the study of cell membrane dynamics,”
Opt. Lett., 26 1271
–1273
(2001). http://dx.doi.org/10.1364/OL.26.001271 Google Scholar
C. H. Yang et al.,
“Interferometric phase-dispersion microscopy,”
Opt. Lett., 25 1526
–1528
(2000). http://dx.doi.org/10.1364/OL.25.001526 Google Scholar
G. Popescu et al.,
“Diffraction phase microscopy for quantifying cell structure and dynamics,”
Opt. Lett., 31 775
–777
(2006). http://dx.doi.org/10.1364/OL.31.000775 OPLEDP 0146-9592 Google Scholar
T. Ikeda et al.,
“Hilbert phase microscopy for investigating fast dynamics in transparent systems,”
Opt. Lett., 30 1165
–1168
(2005). http://dx.doi.org/10.1364/OL.30.001165 OPLEDP 0146-9592 Google Scholar
G. Popescu et al.,
“Fourier phase microscopy for investigation of biological structures and dynamics,”
Opt. Lett., 29 2503
–2505
(2004). http://dx.doi.org/10.1364/OL.29.002503 OPLEDP 0146-9592 Google Scholar
T. Kim et al.,
“White-light diffraction tomography of unlabeled live cells,”
Nat. Photonics, 8 256
–263
(2014). http://dx.doi.org/10.1038/nphoton.2013.350 NPAHBY 1749-4885 Google Scholar
Z. Wang et al.,
“Spatial light interference microscopy (SLIM),”
Opt. Express, 19 1016
(2011). http://dx.doi.org/10.1364/OE.19.001016 OPEXFF 1094-4087 Google Scholar
F. Zernike,
“How I discovered phase contrast,”
Science, 121 345
(1955). http://dx.doi.org/10.1126/science.121.3141.345 SCIEAS 0036-8075 Google Scholar
D. Gabor,
“A new microscopic principle,”
Nature, 161 777
(1948). http://dx.doi.org/10.1038/161777a0 Google Scholar
G. Popescu et al.,
“New technologies for measuring single cell mass,”
Lab Chip, 14 646
–652
(2014). http://dx.doi.org/10.1039/C3LC51033F LCAHAM 1473-0197 Google Scholar
M. Mir et al.,
“Label-free characterization of emerging human neuronal networks,”
Sci. Rep., 4 4434
(2014). http://dx.doi.org/10.1038/srep04434 SRCEC3 2045-2322 Google Scholar
M. Mir et al.,
“Highly sensitive quantitative imaging for monitoring single cancer cell growth kinetics and drug response,”
PLoS One, 9 e89000
(2014). http://dx.doi.org/10.1371/journal.pone.0089000 POLNCL 1932-6203 Google Scholar
Z. Wang et al.,
“Tissue refractive index as marker of disease,”
J. Biomed. Opt., 16 116017
(2011). http://dx.doi.org/10.1117/1.3656732 JBOPFO 1083-3668 Google Scholar
Z. Wang, H. Ding and G. Popescu,
“Scattering-phase theorem,”
Opt. Lett., 36 1215
(2011). http://dx.doi.org/10.1364/OL.36.001215 OPLEDP 0146-9592 Google Scholar
M. Mir et al.,
“Optical measurement of cycle-dependent cell growth,”
Proc. Natl. Acad. Sci., 108 13124
(2011). http://dx.doi.org/10.1073/pnas.1100506108 Google Scholar
B. Bhaduri et al.,
“Optical assay of erythrocyte function in banked blood,”
Sci. Rep., 4 6211
(2014). http://dx.doi.org/10.1038/srep06211 Google Scholar
R. Gannavarpu et al.,
“Spatiotemporal characterization of a fibrin clot using quantitative phase imaging,”
PLoS One, 9 e111381
(2014). http://dx.doi.org/10.1371/journal.pone.0111381 POLNCL 1932-6203 Google Scholar
R. Wang et al.,
“One-dimensional deterministic transport in neurons measured by dispersion-relation phase spectroscopy,”
J. Phys. Condens. Matter, 23 374107
(2011). http://dx.doi.org/10.1088/0953-8984/23/37/374107 Google Scholar
D. R. Cox and N. Reid, The Theory of the Design of Experiments, CRC Press, Boca Raton, Florida
(2000). Google Scholar
|

