
|
|
1.IntroductionThere is a vast array of fluorescent markers available for selective staining of intracellular organelles. Organic dyes, typically small molecules with high quantum yields and emission bands ranging from the UV to the near-infrared,1–4 can be used to report on the physical properties of their surroundings, including membrane potential,5,6 polarity,7,8 membrane order,9,10 viscosity,11–21 ion concentration,22,23 and pH,24,25 as well as conformational changes in proteins,7,26 and also protein-protein interactions via Förster resonance energy transfer (FRET).27,28 Single probes that offer the possibility of simultaneously measuring multiple parameters are actively sought.29 Nile red, a neutral lipid stain and an oxidation product of the dye Nile blue,30 is a hydrophobic organic dye with absorption and emission bands in the visible spectrum. Nile red is sensitive to polarity, exhibiting solvatochromic shifts, with a redshifting emission spectrum in increasingly polar media.31 It has also found use in monitoring conformational changes in polymers,32 protein aggregation,33 interactions of liposomes with cholesterol and phospholipids,34 and for measurements in micelles.35 Nile red is commonly used to probe lipid-rich intracellular environments and, in particular, lipid droplets (LDs) for which it is a selective stain,30 although this has typically been limited to fluorescence intensity imaging. LDs act as a store for the cell’s energy and contain neutral lipids including triacylglycerols in a core surrounded by a phospholipid monolayer.36 In addition to diseases including diabetes being linked to an excess of lipids,37 -synuclein, a protein associated with Parkinson’s disease, has been shown to bind to LD and influence lipid metabolism.38 There has also been interest in the function of LD for the advancement of biofuels research.39 Recently, research activity appears to have intensified due to the fact that LD have been shown to be dynamic organelles with more significant roles than merely lipid storage,40,41 including interactions with pathogens, as reviewed in Ref. 42, and roles in mediating inflammation.43 Despite this wide-ranging interest, there are still many unknowns regarding LD relating to their formation, budding in the endoplasmic reticulum (ER), cellular distribution, and mechanism of trafficking throughout the cell.44 A greater understanding of the physical properties may help address some of the unresolved issues surrounding LD biogenesis. By imaging the emission properties of fluorescent dyes, i.e., lifetime, wavelength, and polarization, it is possible to measure spatial variations in the chemical and physical properties of intracellular environments. By using Nile red, we are investigating intracellular variations in the dielectric properties of the stained regions. Differences in the intracellular dielectric properties may ultimately find use in monitoring LD biogenesis and protein interactions with LDs. Historically, a single, definitive measure of polarity has proved to be problematic with many empirical parametric scales having been reported in the literature, and in particular, those based on solvatochromic dyes have been authoritatively reviewed.45 Essentially, the dielectric constant is a measure of the reduction of the electric field strength of a charged particle inside a solvent compared to free space. For Nile red, it is believed that after excitation, intramolecular electron transfer occurs and the resultant charge transfer state is responsible for the polarity-sensitive properties of the dye.46 Local changes in polarity/dielectric constant may occur as a result of varying concentrations of solutes,47 ion transport, and dynamic protein interactions. Variations in local polarity arising from interactions of amyloid oligomers with membranes have been linked to diseases including Alzheimer’s.48 Label-free mapping of the dielectric and conducting properties of cellular processes using electrochemical impedance microscopy has been reported recently.49 We are interested in targeted polarity mapping of living cells using spectrally resolved and time-resolved fluorescence imaging of polarity-sensitive dyes that exhibit variations in their fluorescence spectrum and lifetime with varying polarity of their environment. Fluorescence lifetime imaging microscopy (FLIM) generates images where the contrast is solely due to the fluorescence lifetime.50–53 Spectrally resolved FLIM,54–57 or hyperspectral FLIM,58 where fluorescence lifetime images are recorded at several wavelengths across the emission spectrum of the fluorophore, has also been used to report on samples labeled with multiple fluorophores, unstained tissue using endogenous fluorophores,58 and multispectral imaging of FRET.54 The Nile red spectroscopy literature contains within it data sets showing that for a homologous family of polar protic solvents, e.g., linear alcohols, an increase in the dielectric constant leads to a decrease in the measured fluorescence lifetime.31,59,60 Recently, a bimodal probe comprising Nile red linked to boron-dipyrromethene has been used to measure the polarity and viscosity of the ER.61 However, the explicit use of FLIM of Nile red to report on intracellular polarity has, to our knowledge, not been presented. FLIM is an attractive alternative to ratiometric intensity imaging, as the fluorescence lifetime is independent of the fluorophore concentration and the particular spectral sensitivity of the detection system. In this paper, we present steady-state and time-resolved spectral data from Nile red stained lipid-rich regions, including LD in living HeLa cells. We demonstrate that these measurements reveal spatial heterogeneity in polarity within the cells. Nile red offers an advantage over other polarity-sensitive dyes like Laurdan, for example, as it does not require UV excitation, and single photon excitation using wavelengths above 460 nm can be used, yielding emission in the red region of the visible spectrum. We show that spectral fluorescence imaging can be used to distinguish between regions with different polarities based on emission peak wavelengths. Furthermore, we show that spectrally resolved FLIM of Nile red is an excellent technique for measuring variations in intracellular polarity with the concentration-independent fluorescence decay kinetics varying markedly as a function of emission wavelength. Using phasor plots of our FLIM data, we show that it is possible to use fluorescence lifetime to map heterogeneity in intracellular polarity and to specifically identify LDs. Finally, we discuss the implications of our FLIM data for simultaneous viscosity and polarity mapping using Nile red fluorescence lifetimes based on the excited state photophysics of the dye. 2.Experimental Methods2.1.Preparation of Nile Red SolutionsNile red (Invitrogen, United Kingdom) and all solvents were used as received with no additional purification. A stock solution of 1.5 mM Nile red was prepared by dissolving 2.5 mg of the powder in 5 ml methanol (Sigma-Aldrich, United Kingdom). Solutions of Nile red were then prepared in methanol, ethanol, propanol, butanol, and hexanol (Sigma-Aldrich) by addition of of the stock solution to 10 ml each of the solvent. A mixture of 60% V/V glycerol/propanol with a Nile red concentration of was prepared to measure the time-resolved fluorescence response of a more viscous environment. 2.2.Absorption and Emission SpectroscopyAbsorption spectra of the solutions were measured in the range from 400 to 650 nm using a Hitachi U-4100 spectrometer, and emission spectra were measured between 510 and 800 nm using a FluoroMax spectrometer (Horiba Jobin Yvon Ltd., United Kingdom) or a Perkin-Elmer LS5 spectrometer with excitation at 500 nm. Solutions were measured in 10-mm pathlength quartz cuvettes (Starna Scientific Ltd., United Kingdom). 2.3.Time-Resolved Fluorescence SpectroscopyThe fluorescence decays of solutions of Nile red in methanol, ethanol, propanol, butanol, and hexanol at 23°C were recorded at an emission wavelength of 640 nm by time-correlated single photon counting (TCSPC) using a FluoroCube system (Horiba Jobin Yvon Ltd.). Spectrally resolved fluorescence decays of the Nile red in 60% V/V glycerol/propanol mixture were measured in 10 nm intervals between 580 and 650 nm. Samples were measured in 10-mm pathlength quartz cuvettes, with excitation from a NanoLED source at 482 nm with a repetition rate of 1 MHz and an optical pulse duration of . The fluorescence passed through a monochromator before detection at the magic angle using a time-resolved detection module (TBX-04, Horiba Jobin Yvon Ltd.). Decays were recorded in a 50 ns window with a time resolution of 6.9 ps per channel. Fluorescence lifetimes were calculated by fitting the data to an exponential decay model in DAS6 software (Horiba Jobin Yvon Ltd.). 2.4.Cell Culture and StainingHeLa cells (ATCC) were cultured in Dulbecco’s modified Eagle’s medium (Sigma-Aldrich) supplemented with pen/strep (1%) and 10% fetal bovine serum (Biosera Ltd., United Kingdom) in an incubator at 37°C with a 5% atmosphere. For staining, cells were transferred with the complete medium to a six-well plate as part of a micro-incubation system (SmartSlide 50, Wafergen) and with of a 1.5 mM stock solution of Nile red in methanol giving a Nile red concentration of in the well. The cells were stained in the incubator for 30 min and then washed three times with indicator-free medium (OptiMEM, Invitrogen) to remove excess dye before imaging. The six-well plate was transferred to the microscope stage and the cells were heated to 37°C with a continuous flow of 5% for the duration of the experiment. All imaging experiments were typically completed within 4 h. 2.5.Fluorescence Microscopy and Spectral ImagingAll experiments were performed using a confocal laser scanning microscope (Leica TCS SP2). Confocal fluorescence and transmitted light images were recorded by exciting the samples with a continuous wave laser at 488 nm with an average power of through a water immersion objective lens (NA 1.2, Leica). Emission spectra were recorded using the microscope by selecting a bandpass of 10 nm and measuring 100 images with the emission wavelength increasing in increments of 2.5 nm between 500 and 750 nm. Regions of interest (ROIs) for an LD-rich region, LD-absent region, and a whole cell were then selected and the corresponding spectra were constructed by using ImageJ to measure the fluorescence intensity in each ROI. 2.6.Spectrally Resolved Fluorescence Lifetime ImagingFLIM was performed by exciting the sample using a pulsed laser diode (Hamamatsu PLP-10 470, Hamamatsu) with an optical pulse duration of 90 ps, a repetition rate of 20 MHz, and a wavelength of 467 nm, through a , NA 1.2 water immersion objective lens (Leica). Fluorescence from the sample was collected back through the same objective lens onto a GaAsP hybrid detector (HPM-100-40, Becker & Hickl based on an R10467-40 GaAsP hybrid photomultiplier)62 with the signal fed into a TCSPC card (SPC830, Becker & Hickl) in a PC. Images of were recorded with 256 time channels and a 50 ns window giving a time resolution of per channel. Spectral ranges were selected by varying the emission filter in front of the hybrid detector. The wavelength ranges of interest measured in this study were selected using filters for (Comar), (Comar), and (Thorlabs). Acquisition times were 300 s and the count rate was kept to of the laser repetition rate to avoid photon pile-up effects. 2.7.Data ProcessingImage processing and time-resolved analysis was performed using ImageJ for the spectral imaging and TRI263 for time-resolved microscopy data. Phasor plots64 were generated using TRI2 for the fluorescence lifetime imaging data. These plots gave a scatter plot spread representation of the fluorescence lifetimes in selected ROIs within the images. 3.Results and Discussion3.1.Absorption and Emission Spectra and Fluorescence Lifetimes of Nile Red in SolutionIn an attempt to provide a quantitative description of the polarity of the medium, we examined the variation in emission peak wavelength and fluorescence lifetime, , of Nile red in various organic solvents as a function of the dielectric constant, . We present plots of emission peak wavelength versus [Fig. 1(a)] and versus [Figs. 1(b) and 1(c)] in a range of organic solvents. Our data from linear alcohols are plotted along with data points from several other authors compiled from the literature.7,31,59,60,65–67 Literature values for emission peak wavelengths and fluorescence lifetimes are presented in Tables 2 and 3, respectively, of the Appendix. The emission peak position shifts to longer wavelengths nonlinearly with increasing between with a range of between 530 and 665 nm [Fig. 1(a)]. We use this plot to estimate the intracellular polarity from our spectrally resolved confocal fluorescence imaging data. Fig. 1Plots of our data with collated literature data for (a) Nile red emission peak wavelength versus dielectric constant in organic solvents and (b) fluorescence lifetime versus dielectric constant in protic (+) and aprotic (×) solvents. (c) shows the data points from (b) corresponding to alcohols only. (d) Fluorescence decays are shown with fits to the data (dashed black lines) for Nile red in methanol (red), ethanol (green), propanol (blue), butanol (magenta), and hexanol (cyan) along with (e) the residuals of the fits and (f) the corresponding phasor plot.  The variation of the fluorescence lifetime as a function of in protic and aprotic solvents [Fig. 1(b)] is slightly more complex to interpret than the emission peak data, but yields more information, including that relating to solvation dynamics. Our time-resolved data along with those of Dutt et al.59 were recorded at an emission wavelength of 640 nm [Fig. 1(c)], and in our measurements of n-alcohols, the fluorescence decays are well described by a monoexponential decay function for methanol, ethanol, propanol, and butanol. However, the value for the monoexponential fit to the hexanol sample is high and a biexponential fit is appreciably better. In the fit, the second decay component is negative, indicating a grow-in as has also been measured for Nile red in octanol and discussed in terms of a viscosity dependence of the excited state kinetics.68 The measured lifetimes for our samples in methanol, ethanol, propanol, butanol, and hexanol are given in Table 1. The measured fluorescence decays from the five alcohol samples with corresponding fits [Fig. 1(d)] and the residuals for the fitting [Fig. 1(e)] are shown along with a phasor plot64 for the data [Fig. 1(f)]. The phasor plot of the data from the five alcohols yields data points that lie on or are very close to the universal circle. We find a decrease in the decay component of the fluorescence lifetime of Nile red from at (hexanol) to at (methanol) in the alcohols we measured. However, plotting our data along with data from other groups [Fig. 1(b)] reveals that dielectric constant values do not necessarily have unique fluorescence lifetime values, and this appears to be dependent on whether the solvents are protic or aprotic. Table 1Dielectric constant, emission peak wavelength, and fluorescence lifetimes [from Fig. 1(d)] of Nile red in alcohols measured in this study. Standard deviations (s.d.) are given in brackets and relative contributions of each decay component for the biexponential fit to the hexanol data are given in square brackets.
For protic solvents, the fluorescence lifetime decreases with increasing dielectric constant, while for aprotic solvents, the lifetime remains largely invariant as a function of dielectric constant. Thus, for a homologous family of protic solvents, such as linear alcohols measured on the red edge of their emission spectrum, it is possible to quantify the dielectric constant from the fluorescence lifetime, but this is not the case for all solvents and care must be taken if attempting to correlate fluorescence lifetimes with dielectric constants. The model we use to describe our data is one in which there are two excited state emissive pathways (Fig. 2). Upon excitation, a locally excited (LE) state is populated. Following charge transfer, an intramolecular charge transfer (ICT) state, stabilized by solvent reorientation around the dye, is populated from the LE state. This is in accordance with the model proposed by Krishna68 and is consistent with those of other organic polarity probes.8,9 The emission energy from the ICT state decreases as the polarity of the environment increases, which explains the redshift in emission wavelength in polar environments. Both the LE and ICT states are emissive, and the fluorescence decay profile is dependent on (1) the solvent reorientation rate [, Fig. 2(a)], which determines the rate of population of the stabilized ICT state, and (2) the wavelength at which the decay is measured. It is primarily the emission from the ICT state that can be used to report on the polarity of the microenvironment. The chemical structure of Nile red is shown in Fig. 2(b). Fig. 2(a) Energy level diagram for Nile red with emission from both locally excited (LE) and intramolecular charge transfer (ICT) states. The solvent reorientation rate, , determines the rate of stabilization of the ICT state. (b) Structure of Nile red.  The measured monoexponential decay at 640 nm, which is on the red edge of the emission spectrum for Nile red in alcohols, is due to emission from the ICT state with little or no contribution from the LE state. We show data for spectrally resolved fluorescence lifetime measurements between 580 and 650 nm for Nile red in a 60% V/V solution of glycerol/1-propanol (Fig. 3), where measurement on the blue edge of the emission spectrum yields multiexponential decays [Figs. 3(a) and 3(b)] due to contributions from both the LE state, with a short fluorescence lifetime, and the ICT state, with a longer fluorescence lifetime. As the emission wavelength increases, the contribution from the short lifetime LE state decreases, and on the red edge, the decays are due to emission from the polarity-sensitive ICT state. Fig. 3(a) Spectrally resolved fluorescence decays for Nile red in 60% V/V glycerol/propanol mixtures. (b) Decays from (a) showing only the first 3 ns after excitation and (c) reconstructed emission spectra as a function of time from the spectrally resolved decays in (a). (d) Phasor plot of the time-resolved data in (a).  The 60% V/V glycerol/propanol sample also allows us to explore the effects of viscosity on the fluorescence decay properties, and we find that the fluorescence decay properties are dependent not only on the emission wavelength in a given solvent, but also on the viscosity of the microenvironment. The contribution of the ICT state to the total emission at a given wavelength is dependent on the rate of population of the ICT state from the LE state, and stabilization of the ICT is dependent on solvent reorientation around the ICT state. In higher viscosity environments, solvent reorientation occurs more slowly, and hence, the rate of population of the ICT state is reduced. This is most evident in our data at longer emission wavelengths where there is no contribution from the LE state and there is a negative amplitude grow-in component to the decay, which is due to population of the ICT state from the LE state after excitation [Fig. 3(b)]. If the rate of population of the ICT state is more rapid than the decay of the LE state, then there is a smaller contribution to the total emission from the LE state. Conversely, if the rate of population of the ICT state is slower than the emission from the LE state, then the LE state will dominate the total emission. We can select which of these states we measure by their emission wavelengths. Normalized time-resolved emission spectra from integrating the spectrally resolved decays show a clear shift in the emission peak toward the red as a function of time after photoexcitation [Fig. 3(c)]. A phasor plot of the data shows that the grow-in evident at longer wavelengths leads to data points outside of the universal circle [Fig. 3(d)], while the majority of the data points lie inside the universal circle, and all of them can be described using multiexponential decay models. Multiexponential decay fit parameters for the decays in Fig. 3(a) are given in Table 4 of the Appendix. Thus, due to the complex photophysics, care has to be taken when interpreting Nile red spectral and lifetime images in cells, taking into account at which emission wavelength the FLIM images were acquired. 3.2.Confocal Imaging Emission SpectraTransmitted light [Fig. 4(a)] and confocal fluorescence images [Figs. 4(b)–4(d)] of living HeLa cells stained with Nile red show that the distribution of the fluorescence is characterized by a bright punctate distribution of the dye and a more diffuse distribution, which is most intense in the perinuclear region. The puncta correspond to staining of LD while the diffuse internal membrane staining most likely includes the ER,61 from which the LD are believed to bud.69 This is consistent with Nile red staining reported in the literature.30 The contrast between the LD and the rest of the cell is most pronounced at [Fig. 4(b)]. In this case, fluorescence from the LD is significantly more intense than from other regions. As the measured emission wavelength gets longer, from 550 to 600 nm [Fig. 4(c)] to 650 nm [Fig. 4(d)], the fluorescence from the LD remains intense, but the intensity of the emission from the other lipid-rich regions increases, leading to lower contrast between the two regions in the images. Fig. 4(a) Transmitted light and confocal fluorescence images measured at (b) 550 nm, (c) 600 nm, and (d) 650 nm of a living HeLa cell stained with Nile red. (e) Emission spectra from the whole cell (top panel, black data points) with Gaussian fits to the data (dashed gray lines), a lipid droplet-rich area corresponding to region (i) in (b) (middle panel, red data points), and a region of diffuse staining corresponding to region (ii) in (b) (bottom panel, blue data points). Scale bar . 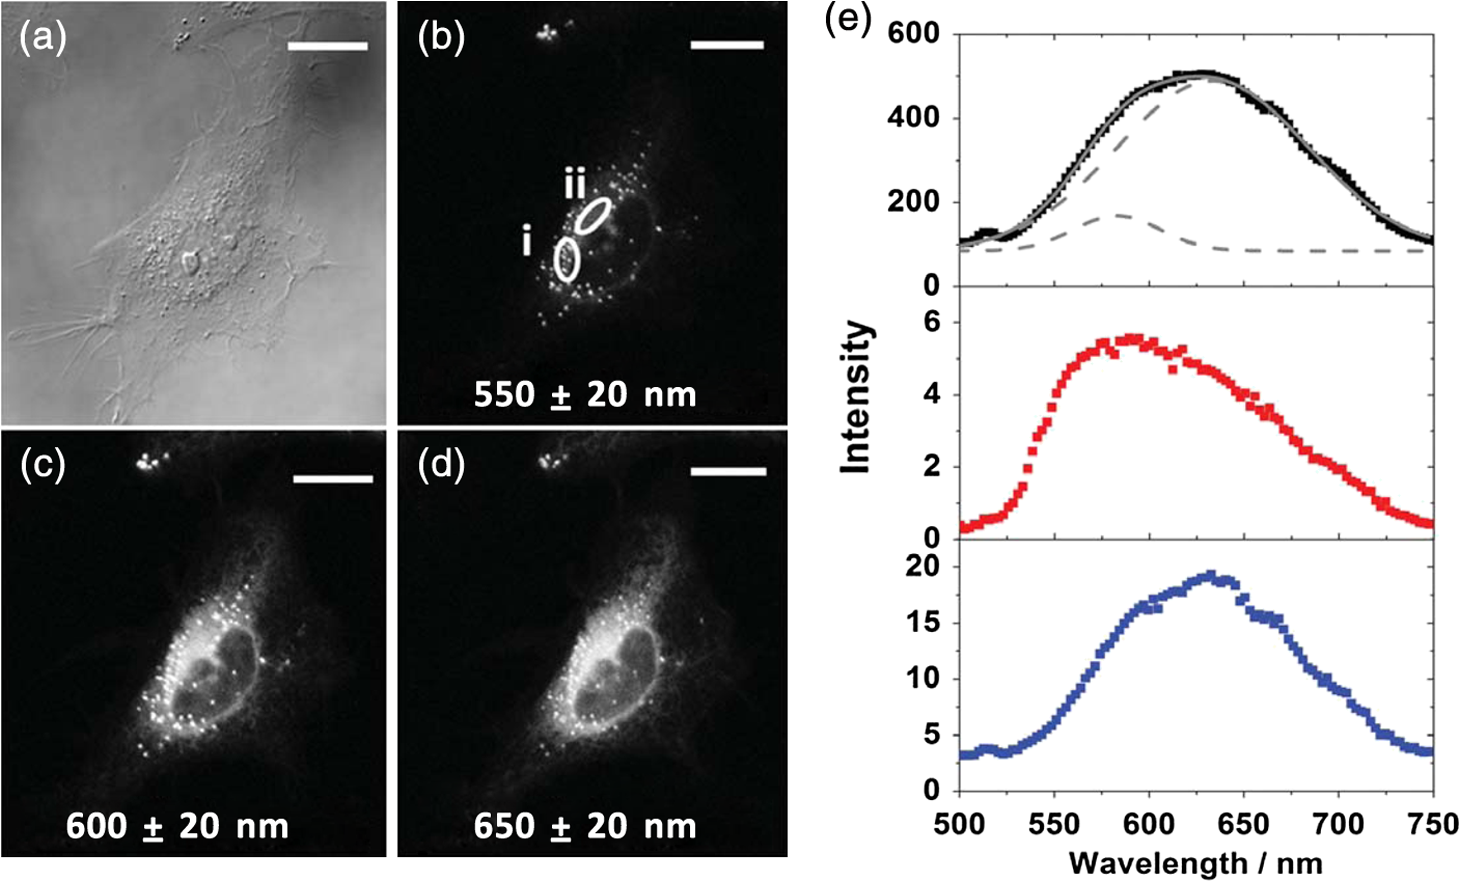 Fluorescence spectra of the ROIs outlined in Fig. 4(b) (i and ii) are shown in Fig. 4(e). The spectrum measured using all pixels in the image (top panel, black data points) is broad, with a single peak centered at 635 nm. The emission spectra from ROI-i [Fig. 4(e), middle panel, red data points] and ROI-ii [Fig. 4(e), bottom panel, blue data points] show that the peak position of the diffuse staining emission (635 nm) is redshifted relative to the peak position of the LD emission (600 nm). All spectra can be adequately fitted using two Gaussian functions centered at 585 and 640 nm, corresponding to contributions from the LD () and other internal membranes (), respectively, with the values of found from the spectral calibration plot, Fig. 1(a). The value of the lower bound for the other membranes is close to the value found by other authors for the endoplasmic reticulum, .61 3.3.Spectrally Resolved Fluorescence Lifetime ImagingOur FLIM data are presented as phasor plots (Fig. 5), for which no exponential fitting model is required, and no prior assumptions regarding decay models need be made.64 Each data point on the phasor corresponds to the fluorescence lifetime of a single pixel in the image. Monoexponential decays yield data points that lie on the universal circle. Fig. 5Phasor plots of spectrally resolved fluorescence lifetime imaging microscopy (FLIM) data from living HeLa cells stained with Nile red measured at (a) 550 nm, (b) 600 nm, and (c) 650 nm. (d) Overlay of the phasor plots [(a) to (c)] including data points from Fig. 1(f) (shown in expanded red box region). 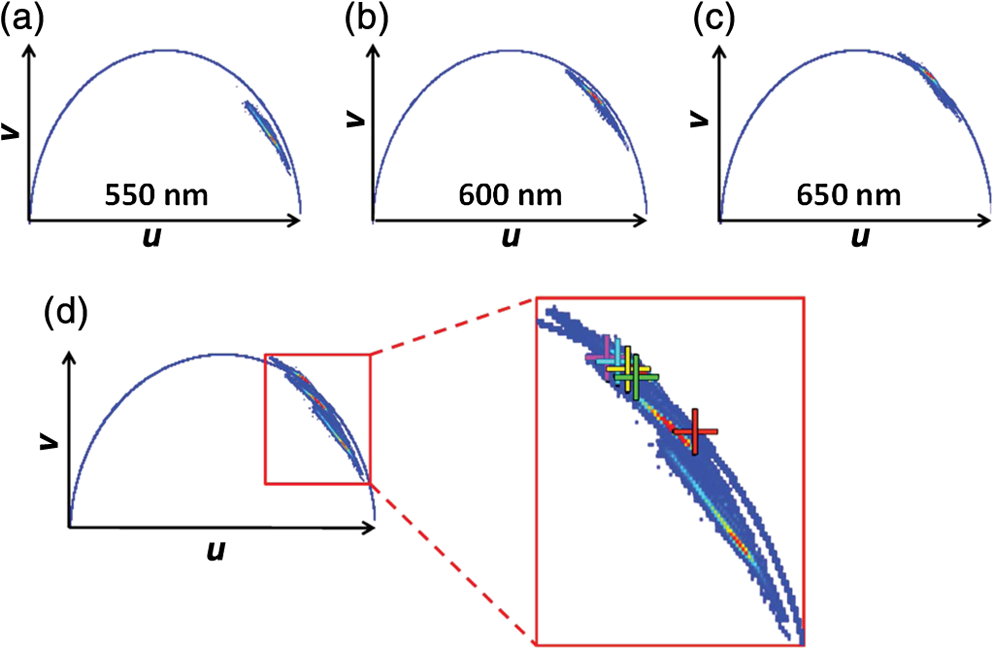 The phasor plots for the spectrally resolved FLIM data show striking differences as a function of emission wavelength. Looking first at the data from living cells at 550 nm emission [Fig. 5(a)], the data lie within the universal circle, indicative of a mulitexponential decay. At 600 nm [Fig. 5(b)], the data lie closer to the universal circle but still inside. At 650 nm [Fig. 5(c)], some of the data points lie inside the universal circle, some outside of the circle, and some on the circle. The presence of data points outside the circle can be explained by the presence of a negative amplitude decay component, a grow-in, in the fluorescence decays at this wavelength. This is due to delayed fluorescence from the ICT state. This phenomenon has also been seen for Laurdan, a dye that also undergoes an excited state reaction, and has been used to measure variations in dipolar relaxation in membranes.70 At every wavelength in our phasor plots, there is an almost straight line distribution of data points and the average lifetime increased as the emission wavelength increased, as shown by the data points shifting counterclockwise around the universal circle. Plotting the data from all three emission wavelengths on the same phasor [Fig. 5(d)] along with the corresponding data points for Nile red in five alcohols [from Fig. 1(d)], we see that there is a small amount of overlap in the phasor data between 550 and 600 nm, and also between 600 and 650 nm. Interestingly, the data for all wavelengths cannot be considered to fall upon a common cord on the plot (as would be the case for a biexponential decay). Thus, we conclude that while emission may only occur from the LE and ICT states, the absolute emissive LE and ICT energies arising from the distribution of polarities within each intracellular microenvironment are variable. This yields more complex kinetics than can be described by simple biexponential decays globally across all emission wavelengths. This may be due to the relatively high intracellular viscosity, evidenced by the data points outside the universal circle, leading to time-dependent excited state kinetics, with spectral relaxation occurring in the ICT state. Such kinetics have been observed previously for other charge-transfer dyes.71 This is a potentially interesting facet of the Nile red photophysics. The counterclockwise shift of the data points is indicative of the additional decay component that is related to the solvent reorientation and leads to delayed fluorescence from the ICT state. The rotation of phasor plots as a result of dipolar relaxation has also been reported recently.70 However, we do not find that rotation of the phasor plot leads to overlap of the data points at each emission wavelength. We have plotted the five data points from our alcohol solution measurements made at 640 nm [Fig. 1(f)] on the same phasor plot as the intracellular data [Fig. 5(d)]. In the region where the data points from the cell measurements made at 650 nm lie on the universal circle, we can estimate values of the dielectric constant by comparison of the data points on the universal circle from the solution measurements. For the cell measurements, the data points on the universal circle are assumed to arise primarily from the lipid-rich regions of the cell, which are not LDs, and these points lie between the methanol and ethanol data points. We can, therefore, estimate a value for the dielectric constant of in the corresponding microenvironments. This is in good agreement with the range we found using the spectral plot in Fig. 1(a). In order to investigate the influence of the position of the dye within the cell (i.e., within LDs and in other internal lipid-rich regions), we examined the phasor plots for the whole image [Figs. 6(a)–6(c)], then spatially masked out the LDs from the intensity images and calculated the phasor plots [Figs. 6(e)–6(g)], and finally calculated the phasor of the LDs only [Figs. 6(i)–6(k)]. Fig. 6Spectrally resolved FLIM phasor plots from living HeLa cells stained with Nile red looking at [(a) to (c)] emission from whole cells, [(e) to (g)] the whole cells minus the lipid droplet contributions, and [(i) to (k)] the lipid droplet contributions only. (d), (h), and (l) correspond to the regions of interest in the phasors defined by the red squares in (a), (e), and (i), respectively, and show the contributions of the lipid droplets. Fluorescence intensity images are shown in (m), (n), and (o).  By zooming-in on the resulting phasor plots using the data recorded at 550 nm [Figs. 6(d), 6(h), and 6(l)] corresponding to the regions in the red boxes in Figs. 6(a), 6(e), and 6(i), it is clear that an asymmetric distribution of data points extending toward the shorter lifetime region (right hand side) of the universal circle originates exclusively from the LDs. This is the case for all wavelengths. Furthermore, the tail of the distribution, which extends toward longer lifetime contributions (counterclockwise around the universal circle), is absent for the LDs. From these data, it is clear that Nile red in LDs has more dominant short lifetime components than the dye in other regions of the cell, indicative of a greater contribution from the shorter lifetime LE state, as expected from the emission spectra [Fig. 4(e)]. The fluorescence intensity images corresponding to the three emission wavelength regions at 550 nm, 600 nm, and 650 nm are shown in Fig. 6 m, n, and o. Using this knowledge of the lifetime characteristics of the dye in the cell, we can select regions of the phasor for which the data points correspond to short lifetimes and thus the LDs. In this way, the lipid droplets are identified purely by their fluorescence lifetime. We are able to identify LDs in living cells by thresholding our phasor plot, selecting only data points for which at 550 nm [Fig. 7(a)], where is the horizontal vector component of the phasor. The threshold value is shown by the red solid lines. The intensity image at 550 nm [Fig. 7(b)] is used to demonstrate the specificity of the phasor plot thresholding, which yields the green data points shown as an overlay with the intensity images for short emission wavelengths (550 nm) [Fig. 7(c)]. It is clear that even without using a fitting model, we can identify LDs simply from the time-resolved fluorescence response. This is particularly valuable in instances where contrast in intensity images is limited. Fig. 7(a) Phasor plot and (b) confocal fluorescence intensity image measured at 550 nm and from living HeLa cells stained with Nile red. (c) shows the intensity image with overlay (green) of the pixels corresponding to the data points in (a) with horizontal vector component values above that indicated by the red solid line.  In order to explore differences in lipid-rich region fluorescence lifetimes further, we examined the fluorescence decays in our spectrally resolved live cell images with spatial masking to either explicitly include or exclude LDs. For each emission wavelength measured, the decay from the LDs is clearly faster than the decay from the other stained regions [Figs. 8(a)–8(c)], in agreement with the phasor analysis. In each case, the decay profiles are complex, and it is clear from the distribution of data points in the phasor plots that there is a distribution of fluorescence lifetimes. The contribution of the short lifetime decay components evident at 550 nm is increasingly less significant as the emission wavelength increases to 600 and 650 nm. From the energy level diagram (Fig. 2), we assert that the short lifetime component is due to emission from the LE state and that we spectrally filter out this component as we measure at longer emission wavelengths. Fig. 8Fluorescence decays for Nile red in lipid droplets (solid black line) and all other stained regions (gray dashed line) measured at (a) 550 nm, (b) 600 nm, and (c) 650 nm. Spectrally resolved decays in (d) lipid droplets and (e) all other stained regions with (f) showing the first 5 ns after excitation for the decays in (e) (indicated by the rectangle). 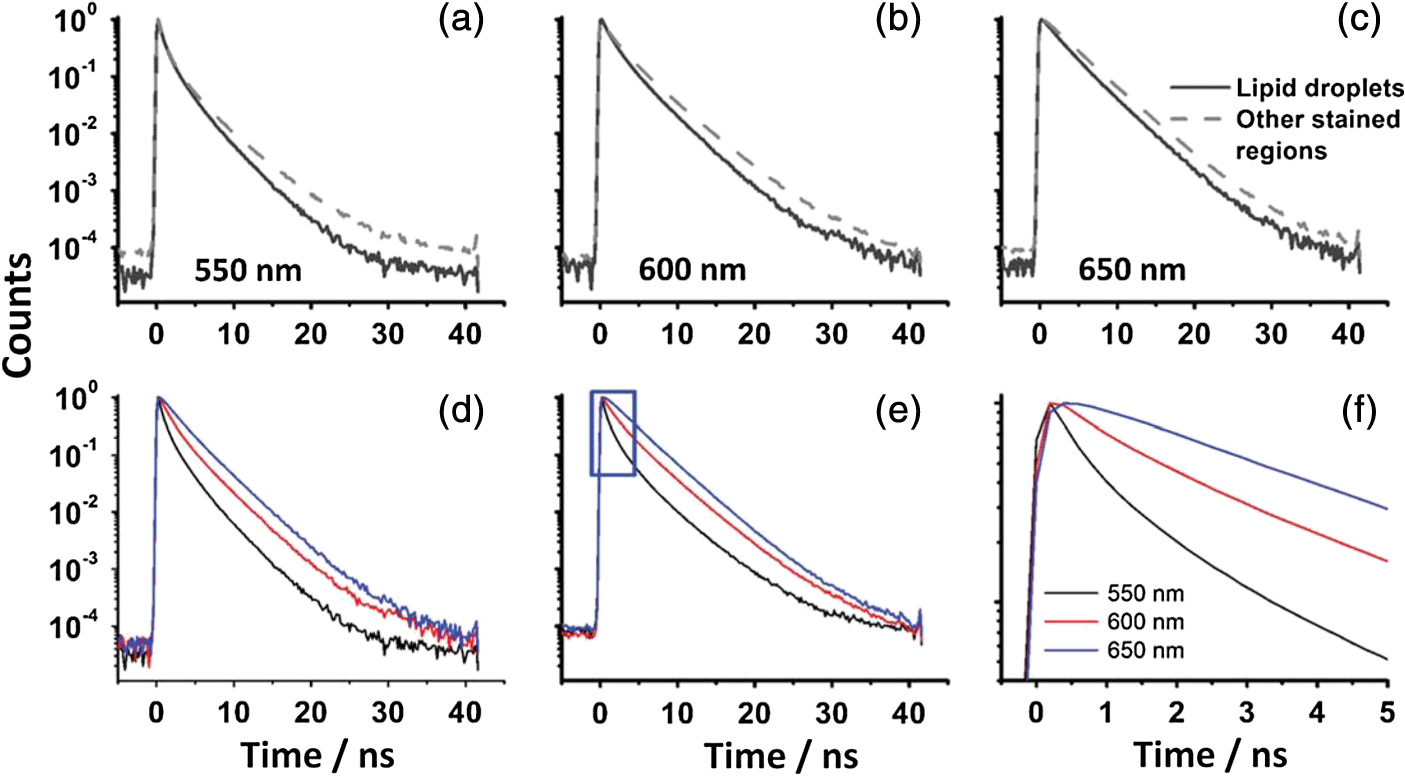 We also see that in the decays from both the LDs [Fig. 8(d)] and the other lipid-rich regions [Fig. 8(e)], the average fluorescence lifetime increases with increasing emission wavelength. Perhaps most importantly, by looking only at the early decay points [Fig. 8(f) defined by the blue rectangle in Fig. 8(e)], we see that there is evidence for the grow-in component in the decay at 650 nm. The peak of the transient in the blue curve for the 650 nm data occurs at a later time than the peaks at shorter wavelengths. From our data of Nile red in glycerol/1-propanol shown in Fig. 3, we can interpret this as an indication that the microenvironment in the lipid-rich regions is viscous and also that it appears to be more viscous than in the LDs where the effect of the grow-in is not readily apparent. The grow-in is indicative of a negative amplitude fluorescence decay component corresponding to population of the ICT state. A more viscous environment would lead to slower relaxation of the solvent molecules stabilizing the ICT state and a lower rate constant for population of the ICT state, resulting in a longer lifetime for the grow-in component. The more prominent grow-in for the diffuse stained region is indicative of a more viscous microenvironment. 4.ConclusionIn this work, we have shown the feasibility of mapping intracellular polarity using spectrally resolved confocal fluorescence imaging and spectrally resolved fluorescence lifetime imaging microscopy. LDs can be distinguished from other lipid-rich intracellular regions by virtue of the shorter wavelength peak position of Nile red emission. Our data show that the complex excited state photophysics of Nile red means that care must be taken when interpreting fluorescence lifetimes of the dye. We find that in contrast to low viscosity solvents, a monoexponential fit of the Nile red fluorescence decay in cells is not possible. From data available in the literature, a reduction in the fluorescence lifetime in LDs could be interpreted as an increase in the polarity, in contrast to the lower polarity shown from the emission spectrum. However, the data were measured on the red side of the emission spectrum in each case. We have measured shorter average fluorescence lifetimes in intracellular LDs compared to other stained regions, likely including the ER. We note here that due to the structure of the dye, we are most likely sampling a range of lipid-rich environments within each of the stained regions. The spread of points in our phasor plots is indicative of a range of values associated with a range of local environments being probed by the dye. We propose that the shorter average lifetime of the dye in LDs, which have a lower polarity as shown by the emission spectrum, is likely due to a higher relative population of the LE state. By using a plot of emission wavelength peak versus dielectric constant in various solvents, we can estimate the intracellular dielectric constants to be in LDs and in other lipid-rich regions. The dye also exhibits a shorter fluorescence lifetime component in LDs. The latter has allowed us to simply map LDs from phasor plots of FLIM data. In biexponential fits to the decays, we have also observed the presence of negative amplitude decay components, which are characteristic of a viscous microenvironment. From our data, we conclude that LDs have a lower viscosity than the other stained lipid-rich regions in our images. The ability to probe the intracellular microenvironment using FLIM could allow us to distinguish between LD and the membrane regions from which they are formed, which may help in the understanding of LD biogenesis. AppendicesAppendixLiterature values for emission maxima wavelengths and fluorescence lifetimes for Nile red in various solvents corresponding to the plots in Fig. 1 are given in Tables 2 and 3, respectively. Table 2Emission maxima for Nile red in various solvents collated from the literature.
Table 3Fluorescence lifetimes of Nile red in various solvents collated from the literature.
Fluorescence decay fit parameters for corresponding to the time- and spectrally resolved data in Fig. 3 are shown in Table 4. Table 4Fluorescence lifetime fit parameters for spectrally-resolved data recorded from Nile red in 60% V/V glycerol/1-propanol mixture. The data was fitted to either a 2- or a 3-exponential decay model using DAS6 software (Horiba, United Kingdom). Relative amplitudes for the decay components are shown in square brackets.
AcknowledgmentsWe are grateful to Dr. Andrew Beavil of the Randall Division of Cell and Molecular Biophysics, King’s College London for the use of the Fluoromax emission spectrometer and FluoroCube time-correlated single photon counting fluorescence spectroscopy system. This research was funded by the UK’s Medical Research Council (MRC). ReferencesG. M. Fischer et al.,
“Asymmetric PPCys: strongly fluorescing NIR labels,”
Chem. Commun., 46
(29), 5289
–5291
(2010). http://dx.doi.org/10.1039/c0cc00359j Google Scholar
G. M. Fischer et al.,
“Pyrrolopyrrole cyanine dyes: a new class of near-infrared dyes and fluorophores,”
Chem. Eur. J., 15
(19), 4857
–4864
(2009). http://dx.doi.org/10.1002/chem.200801996 Google Scholar
M. Y. Berezin et al.,
“Long fluorescence lifetime molecular probes based on near infrared pyrrolopyrrole cyanine fluorophores for in vivo imaging,”
Biophys. J., 97
(9), L22
–L24
(2009). http://dx.doi.org/10.1016/j.bpj.2009.08.022 Google Scholar
T. P. Gustafson et al.,
“Defining a polymethine dye for fluorescence anisotropy applications in the near-infrared spectral range,”
ChemPhysChem, 13
(3), 716
–723
(2012). http://dx.doi.org/10.1002/cphc.201100916 CPCHFT 1439-4235 Google Scholar
R. C. Scaduto and L. W. Grotyohann,
“Measurement of mitochondrial membrane potential using fluorescent rhodamine derivatives,”
Biophys. J., 76
(1), 469
–477
(1999). http://dx.doi.org/10.1016/S0006-3495(99)77214-0 Google Scholar
P. Yan et al.,
“Palette of fluorinated voltage-sensitive hemicyanine dyes,”
Proc. Nat. Acad. Sci. USA, 109
(50), 20443
–20448
(2012). http://dx.doi.org/10.1073/pnas.1214850109 Google Scholar
D. L. Sackett and J. Wolff,
“Nile Red as a polarity-sensitive fluorescent-probe of hydrophobic protein surfaces,”
Anal. Biochem., 167
(2), 228
–234
(1987). http://dx.doi.org/10.1016/0003-2697(87)90157-6 Google Scholar
T. Parasassi et al.,
“Laurdan and Prodan as polarity-sensitive fluorescent membrane probes,”
J. Fluores., 8
(4), 365
–373
(1998). http://dx.doi.org/10.1023/A:1020528716621 Google Scholar
D. M. Owen and K. Gaus,
“Optimized time-gated generalized polarization imaging of Laurdan and di-4-ANEPPDHQ for membrane order image contrast enhancement,”
Microsc. Res. Tech., 73
(6), 618
–622
(2010). http://dx.doi.org/10.1002/jemt.20801 Google Scholar
S. A. Sanchez, M. A. Tricerri and E. Gratton,
“Laurdan generalized polarization fluctuations measures membrane packing micro-heterogeneity in vivo,”
Proc. Nat. Acad. Sci. USA, 109
(19), 7314
–7319
(2012). http://dx.doi.org/10.1073/pnas.1118288109 Google Scholar
M. Haidekker et al.,
“A ratiometric fluorescent viscosity sensor,”
J. Am. Chem. Soc., 128 398
–399
(2006). http://dx.doi.org/10.1021/ja056370a Google Scholar
M. K. Kuimova et al.,
“Molecular rotor measures viscosity of live cells via fluorescence lifetime imaging,”
J. Am. Chem. Soc., 130
(21), 6672
–6673
(2008). http://dx.doi.org/10.1021/ja800570d Google Scholar
J. A. Levitt et al.,
“Membrane-bound molecular rotors measure viscosity in live cells via fluorescence lifetime imaging,”
J. Phys. Chem. C, 113
(27), 11634
–11642
(2009). http://dx.doi.org/10.1021/jp9013493 Google Scholar
K. Luby-Phelps et al.,
“A novel fluorescence ratiometric method confirms the low solvent viscosity of the cytoplasma,”
Biophys. J., 65
(1), 236
(1993). http://dx.doi.org/10.1016/S0006-3495(93)81075-0 Google Scholar
J. A. Levitt et al.,
“Simultaneous measurements of fluorescence lifetimes, anisotropy and FRAP recovery curves,”
Proc. SPIE, 7902 79020Y
(2011). http://dx.doi.org/10.1117/12.875151 Google Scholar
L. L. Zhu et al.,
“Dual-mode tunable viscosity sensitivity of a rotor-based fluorescent dye,”
Tetrahedron, 66
(6), 1254
–1260
(2010). http://dx.doi.org/10.1016/j.tet.2009.12.014 TETRAB 0040-4020 Google Scholar
B. Wandelt et al.,
“Single cell measurement of micro-viscosity by ratio imaging of fluorescence of styrylpyridinium probe,”
Biosens. Bioelectron., 20
(9), 1728
–1736
(2005). http://dx.doi.org/10.1016/j.bios.2004.06.045 Google Scholar
B. Wandelt et al.,
“Substituted 4-[4-(dimethylamino)styryl]pyridinium salt as a fluorescent probe for cell microviscosity,”
Biosens. Bioelectron., 18
(4), 465
–471
(2003). http://dx.doi.org/10.1016/S0956-5663(02)00156-2 Google Scholar
M. A. H. Alamiry et al.,
“A molecular rotor based on an unhindered boron dipyrromethene (Bodipy) dye,”
Chem. Mater., 20
(12), 4024
–4032
(2008). http://dx.doi.org/10.1021/cm800702c Google Scholar
A. Battisti et al.,
“Imaging intracellular viscosity by a new molecular rotor suitable for phasor analysis of fluorescence lifetime,”
Anal. Bioanal. Chem., 405
(19), 6223
–6233
(2013). http://dx.doi.org/10.1007/s00216-013-7084-x Google Scholar
X. Peng et al.,
“Fluorescence ratiometry and fluorescence lifetime imaging: using a single molecular sensor for dual mode imaging of cellular viscosity,”
J. Am. Chem. Soc., 133
(17), 6626
–6635
(2011). http://dx.doi.org/10.1021/ja1104014 Google Scholar
B. Hötzer et al.,
“Determination of copper(II) ion concentration by lifetime measurements of green fluorescent protein,”
J. Fluoresc., 21
(6), 2143
–2153
(2011). http://dx.doi.org/10.1007/s10895-011-0916-1 Google Scholar
D. W. Domaille, E. L. Que and C. J. Chang,
“Synthetic fluorescent sensors for studying the cell biology of metals,”
Nat. Chem. Biol., 4
(3), 168
–175
(2008). http://dx.doi.org/10.1038/nchembio0808-507 1552-4450 Google Scholar
R. Sanders et al.,
“Quantitative pH imaging in cells using confocal fluorescence lifetime imaging microscopy,”
Anal. Biochem., 227
(2), 302
–308
(1995). http://dx.doi.org/10.1006/abio.1995.1285 Google Scholar
M. Y. Berezin et al.,
“Near-infrared fluorescence lifetime pH-sensitive probes,”
Biophys. J., 100
(8), 2063
–2072
(2011). http://dx.doi.org/10.1016/j.bpj.2011.02.050 Google Scholar
J. Hendriks et al.,
“Transient exposure of hydrophobic surface in the photoactive yellow protein monitored with Nile red,”
Biophys. J., 82
(3), 1632
–1643
(2002). http://dx.doi.org/10.1016/S0006-3495(02)75514-8 Google Scholar
A. K. Kenworthy,
“Imaging protein-protein interactions using fluorescence resonance energy transfer microscopy,”
Methods, 24
(3), 289
–296
(2001). http://dx.doi.org/10.1006/meth.2001.1189 MTHDE9 1046-2023 Google Scholar
T. Ng et al.,
“Imaging protein kinase C alpha activation in cells,”
Science, 283
(5410), 2085
–2089
(1999). http://dx.doi.org/10.1126/science.283.5410.2085 SCIEAS 0036-8075 Google Scholar
A. P. Demchenko et al.,
“Monitoring biophysical properties of lipid membranes by environment-sensitive fluorescent probes,”
Biophys. J., 96
(9), 3461
–3470
(2009). http://dx.doi.org/10.1016/j.bpj.2009.02.012 Google Scholar
P. Greenspan, E. P. Mayer and S. D. Fowler,
“Nile red—a selective fluorescent stain for intracellular lipid droplets,”
J. Cell Biol., 100
(3), 965
–973
(1985). http://dx.doi.org/10.1083/jcb.100.3.965 Google Scholar
A. K. Dutta, K. Kamada and K. Ohta,
“Spectroscopic studies of Nile red in organic solvents and polymers,”
J. Photochem. Photobiol. A Chem., 93
(1), 57
–64
(1996). http://dx.doi.org/10.1016/1010-6030(95)04140-0 Google Scholar
J. Benesch et al.,
“Fluorescence probe techniques to monitor protein adsorption-induced conformation changes on biodegradable polymers,”
J. Colloid Interface Sci., 312
(2), 193
–200
(2007). http://dx.doi.org/10.1016/j.jcis.2007.03.016 JCISA5 0021-9797 Google Scholar
M. Sutter et al.,
“Sensitive spectroscopic detection of large and denatured protein aggregates in solution by use of the fluorescent dye Nile red,”
J. Fluoresc., 17
(2), 181
–192
(2007). http://dx.doi.org/10.1007/s10895-007-0156-6 Google Scholar
G. Hungerford et al.,
“Interaction of DODAB with neutral phospholipids and cholesterol studied using fluorescence anisotropy,”
J. Photochem. Photobiol. Chem., 181
(1), 99
–105
(2006). http://dx.doi.org/10.1016/j.jphotochem.2005.11.007 Google Scholar
N. C. Maiti et al.,
“Fluorescence dynamics of dye probes in micelles,”
J. Phys. Chem. B, 101
(51), 11051
–11060
(1997). http://dx.doi.org/10.1021/jp9723123 Google Scholar
M. A. Welte,
“Fat on the move: intracellular motion of lipid droplets,”
Biochem. Soc. Trans., 37 991
–996
(2009). http://dx.doi.org/10.1042/BST0370991 Google Scholar
Y. Guo et al.,
“Functional genomic screen reveals genes involved in lipid-droplet formation and utilization,”
Nature, 453
(7195), 657
–661
(2008). http://dx.doi.org/10.1038/nature06928 Google Scholar
N. B. Cole et al.,
“Lipid droplet binding and oligomerization properties of the Parkinson’s disease protein alpha-synuclein,”
J. Biol. Chem., 277
(8), 6344
–6352
(2002). http://dx.doi.org/10.1074/jbc.M108414200 Google Scholar
Y. Guo et al.,
“Lipid droplets at a glance,”
J. Cell Sci., 122
(6), 749
–752
(2009). http://dx.doi.org/10.1242/jcs.037630 Google Scholar
A. R. Thiam, Jr. R. V. Farese and T. C. Walther,
“The biophysics and cell biology of lipid droplets,”
Nat. Rev. Mol. Cell Biol., 14
(12), 775
–786
(2013). http://dx.doi.org/10.1038/nrm3699 Google Scholar
N. Krahmer, Jr. R. V. Farese and T. C. Walther,
“Balancing the fat: lipid droplets and human disease,”
EMBO Mol. Med., 5
(7), 973
–983
(2013). http://dx.doi.org/10.1002/emmm.201100671 Google Scholar
H. A. Saka and R. Valdivia,
“Emerging roles for lipid droplets in immunity and host-pathogen interactions,”
Annu. Rev. Cell Dev. Biol., 28 411
–437
(2012). http://dx.doi.org/10.1146/annurev-cellbio-092910-153958 ARDBF8 1081-0706 Google Scholar
L. S. Moreira et al.,
“Cytosolic phospholipase A(2)-driven PGE(2) synthesis within unsaturated fatty acids-induced lipid bodies of epithelial cells,”
Biochim. Biophys. Acta, 1791
(3), 156
–165
(2009). http://dx.doi.org/10.1016/j.bbalip.2009.01.003 Google Scholar
L. L. Listenberger and D. A. Brown,
“Lipid droplets,”
Curr. Biol., 18
(6), R237
–R238
(2008). http://dx.doi.org/10.1016/j.cub.2008.01.010 Google Scholar
C. Reichardt,
“Solvatochromic dyes as solvent polarity indicators,”
Chem. Rev., 94
(8), 2319
–2358
(1994). http://dx.doi.org/10.1021/cr00032a005 Google Scholar
C. A. Guido et al.,
“Planar vs. twisted intramolecular charge transfer mechanism in Nile red: new hints from theory,”
Phys. Chem. Chem. Phys., 12
(28), 8016
–8023
(2010). http://dx.doi.org/10.1039/b927489h Google Scholar
M. Y. Berezin et al.,
“Near infrared dyes as lifetime solvatochromic probes for micropolarity measurements of biological systems,”
Biophys. J., 93
(8), 2892
–2899
(2007). http://dx.doi.org/10.1529/biophysj.107.111609 Google Scholar
G. Valincius et al.,
“Soluble amyloid beta-oligomers affect dielectric membrane properties by bilayer insertion and domain formation: implications for cell toxicity,”
Biophys. J., 95
(10), 4845
–4861
(2008). http://dx.doi.org/10.1529/biophysj.108.130997 Google Scholar
W. Wang et al.,
“Single cells and intracellular processes studied by a plasmonic-based electrochemical impedance microscopy,”
Nat. Chem., 3
(3), 249
–255
(2011). http://dx.doi.org/10.1038/nchem.961 Google Scholar
K. Suhling, P. M. W. French and D. Phillips,
“Time-resolved fluorescence microscopy,”
Photochem. Photobiol. Sci., 4
(1), 13
–22
(2005). http://dx.doi.org/10.1039/b412924p Google Scholar
J. W. Borst and A. J. W. G. Visser,
“Fluorescence lifetime imaging microscopy in life sciences,”
Meas. Sci. Technol., 21
(10), 102002
(2010). http://dx.doi.org/10.1088/0957-0233/21/10/102002 Google Scholar
F. Festy et al.,
“Imaging proteins in vivo using fluorescence lifetime microscopy,”
Mol. Biosyst., 3
(6), 381
–391
(2007). http://dx.doi.org/10.1039/b617204k Google Scholar
W. Becker,
“Fluorescence lifetime imaging—techniques and applications,”
J. Microsc., 247
(2), 119
–136
(2012). http://dx.doi.org/10.1111/j.1365-2818.2012.03618.x Google Scholar
A. Rück et al.,
“SLIM: a new method for molecular imaging,”
Microsc. Res. Tech., 70
(5), 485
–492
(2007). http://dx.doi.org/10.1002/jemt.20433 Google Scholar
P. Tinnefeld, D. P. Herten and M. Sauer,
“Photophysical dynamics of single molecules studied by spectrally-resolved fluorescence lifetime imaging microscopy (SFLIM),”
J. Phys. Chem. A, 105
(34), 7989
–8003
(2001). http://dx.doi.org/10.1021/jp010365l Google Scholar
Q. S. Hanley, D. J. Arndt-Jovin and T. M. Jovin,
“Spectrally resolved fluorescence lifetime imaging microscopy,”
Appl. Spectrosc., 56
(2), 155
–166
(2002). http://dx.doi.org/10.1366/0003702021954610 Google Scholar
D. K. Bird et al.,
“Simultaneous two-photon spectral and lifetime fluorescence microscopy,”
Appl. Opt., 43
(27), 5173
–5182
(2004). http://dx.doi.org/10.1364/AO.43.005173 Google Scholar
P. De Beule et al.,
“Rapid hyperspectral fluorescence lifetime imaging,”
Microsc. Res. Tech., 70
(5), 481
–484
(2007). http://dx.doi.org/10.1002/jemt.20434 Google Scholar
G. B. Dutt et al.,
“Rotational reorientation dynamics of polar dye molecular probes by picosecond laser spectroscopic technique,”
J. Chem. Phys., 93
(12), 8498
–8513
(1990). http://dx.doi.org/10.1063/1.459288 Google Scholar
A. Cser, K. Nagy and L. Biczok,
“Fluorescence lifetime of Nile red as a probe for the hydrogen bonding strength with its microenvironment,”
Chem. Phys. Lett., 360
(5–6), 473
–478
(2002). http://dx.doi.org/10.1016/S0009-2614(02)00784-4 Google Scholar
Z. Yang et al.,
“A Nile red/BODIPY-based bimodal probe sensitive to changes in the micropolarity and microviscosity of the endoplasmic reticulum,”
Chem. Commun., 50
(79), 11672
–11675
(2014). http://dx.doi.org/10.1039/C4CC04915B Google Scholar
W. Becker et al.,
“FLIM and FCS detection in laser-scanning microscopes: increased efficiency by GaAsP hybrid detectors,”
Microsc. Res. Tech., 74
(9), 804
–811
(2011). http://dx.doi.org/10.1002/jemt.20959 Google Scholar
P. R. Barber et al.,
“Multiphoton time-domain fluorescence lifetime imaging microscopy: practical application to protein-protein interactions using global analysis,”
J. R. Soc., 6 S93
–S105
(2009). http://dx.doi.org/10.1098/rsif.2008.0451.focus Google Scholar
M. A. Digman et al.,
“The phasor approach to fluorescence lifetime imaging analysis,”
Biophys. J., 94
(2), L14
–L16
(2008). http://dx.doi.org/10.1529/biophysj.107.120154 Google Scholar
H. Tajalli et al.,
“The photophysical properties of Nile red and Nile blue in ordered anisotropic media,”
Dyes Pigments, 78
(1), 15
–24
(2008). http://dx.doi.org/10.1016/j.dyepig.2007.10.002 Google Scholar
N. Sarkar et al.,
“Twisted charge-transfer process of Nile red in homogeneous solution and in faujasite zeolite,”
Langmuir, 10
(1), 326
–329
(1994). http://dx.doi.org/10.1021/la00013a048 LANGD5 0743-7463 Google Scholar
P. Greenspan and S. D. Fowler,
“Spectrofluorometric studies of the lipid probe, Nile red,”
J. Lipid Res., 26
(7), 781
–789
(1985). JLPRAW 0022-2275 Google Scholar
M. M. G. Krishna,
“Excited-state kinetics of the hydrophobic probe Nile red in membranes and micelles,”
J. Phys. Chem. A, 103
(19), 3589
–3595
(1999). http://dx.doi.org/10.1021/jp984620m Google Scholar
C.-L. E. Yen et al.,
“DGAT enzymes and triacylglycerol biosynthesis,”
J. Lipid Res., 49
(11), 2283
–2301
(2008). http://dx.doi.org/10.1194/jlr.R800018-JLR200 JLPRAW 0022-2275 Google Scholar
O. Golfetto, E. Hinde and E. Gratton,
“Laurdan fluorescence lifetime discriminates cholesterol content from changes in fluidity in living cell membranes,”
Biophys. J., 104
(6), 1238
–1247
(2013). http://dx.doi.org/10.1016/j.bpj.2012.12.057 Google Scholar
K. Dahl et al.,
“Solvent dependence of the spectra and kinetics of excited-state charge transfer in three (alkylamino)benzonitriles,”
J. Phys. Chem. B, 109
(4), 1563
–1585
(2005). http://dx.doi.org/10.1021/jp046605p Google Scholar
BiographyJames A. Levitt studied for his PhD in the Department of Chemistry at Imperial College London. He moved to the Department of Physics at Durham University as a postdoctoral researcher to work on terahertz spectroscopy. He then moved to King’s College London as a postdoctoral research associate to work on development and application of advanced fluorescence microscopy techniques, primarily for biological applications. Pei-Hua Chung received her BSc and MSc degrees in physics from National Dong Hwa University in Taiwan and her PhD from King’s College London in 2012. She worked for two years as a research associate at the Faculty of Life Sciences in the University of Manchester and one year at the Department of Physics, National Dong Hwa University. Her research is focused on molecular and nanoparticle interactions in biological samples studied via fluorescence techniques. Klaus Suhling develops and uses advanced multidimensional fluorescence imaging techniques, such as fluorescence lifetime imaging, to understand the properties and interactions of macromolecules in life sciences. After obtaining his PhD in the field of fluorescence spectroscopy from the University of Strathclyde, Scotland, he held several postdoctoral positions in biology, chemistry, and physics departments, working mainly on fluorescence microscopy and the development of photon counting techniques. He joined King’s College London in 2003 and was a lecturer and a reader before being promoted to professor of physics in 2014. |
|||||||||||||||||||||||||||||||||||||||||||||||||||||||||||||||||||||||||||||||||||||||||||||||||||||||||||||||||||||||||||||||||||||||||||||||||||||||||||||||||||||||||||||||||||||||||||||||||||||||||||||||||||||||||||||||||||||||||||||||||||||||||||||||||||||||||||||||||||||||||||||||||||||||||||||||||||||||||||||||||||||||||||||||||||||||||||||||||||||||||||||||||||||||||||||||||||||||||||||||||||||||||||||||||||||||||||||||||||||||


