
|
|
1.IntroductionIn the 1930s, Zernike developed an extremely powerful microscopy technique, phase contrast microscopy, which has made an enormous impact in biomedicine. In a phase contrast microscope, the sample is illuminated by spatially filtered white light. The component of light that passes through cellular structures undeviated is retarded in phase by making transparent objects visible in the final image.1 In the 1940s, Gabor developed holography which enabled the recording of both the amplitude and phase information.2 The combination of qualitative phase contrast imaging and quantitative recording from holography led to the development of quantitative phase imaging (QPI).3 QPI techniques image transparent structures and quantify the change in the path length of light as it passes through these structures. In constant thickness samples such as tissue sections, the phase value is only dependent on the refractive index. QPI techniques4–14 are sensitive to path length changes at the nanoscale level. Previously, the QPI technique spatial light interference microscopy (SLIM) has been used for a variety of applications, such as measurement of cell growth,15,16 testing blood,17 characterization of intracellular movement18 and diagnosis as well as prognosis of disease in tissue.19,20 However, QPI has not yet been applied to whole organism imaging. Structural imaging of arthropods is important for their classification and studying their evolution. In addition, the push to expand the availability to the wider public of information contained in biological collections has been focused on the digitization of collections records and high-quality imaging of specimens. High-quality imaging of collection holdings would allow systematists or ecologists to query a database from remote locations for specific taxa. Instead of relying on collections managers and curators unfamiliar with the groups of interest to make correct identifications, the investigator at a remote location would be able to identify and pinpoint specific individuals to borrow. Several systems have been developed and implemented in the imaging of pinned insects and other arthropods (e.g., Invertnet21), but imaging of slide mounted specimens lags behind. Problems related to the resolution of diagnostically important characters, speed of scanning and proper stitching of individual images, and lack of image contrast have slowed down the progress in the field. Fixation of arthropod tissue can be challenging since the process of killing or fixation often alters the structure of the exoskeleton and tissue, which makes a detailed study of the organism difficult.22 It is, therefore, critical to have an imaging technique that enables the study of an entire arthropod as opposed to serial sections. In the past, different groups have used transmission electron microscopy (TEM), staining-based histology, confocal laser scanning microscopy (CLSM), and synchrotron-based tomography to study arthropods. TEM has been used to study chitin crystals in arthropod cuticles, surface, and ultrastructure of crustacean larvae and drosophila testes.23–25 While TEM has high spatial resolution, the sample has to be thinly sectioned and coated with compounds of heavy metals to enhance contrast, making the technique invasive. Stain-based histology provides high contrast images of tissue at the expense of invasive staining and sectioning of samples. CLSM, which uses autofluorescence from different structures, has been used to study various parts of Drosophila and cuticles of crustaceans.25–27 The disadvantage of CLSM is the long scanning time and reliance on autofluorescent structures. Synchotron-based x-ray microtomography tomography uses a phase contrast principle to obtain three-dimensional images of unstained arthropods.28,29 However, the process of obtaining quantitative information using this method is extremely tedious.28,30 Multicellular organisms have been previously studied using optical techniques, but have been limited to studying the superficial structure and motion of the organism due to limited resolution, or have required physical sectioning of the sample for improved resolution of smaller structures.31–34 We propose using QPI as a label-free method for studying the arthropod external morphology and subcuticular structures. In this study, using both SLIM and the Hamamatsu Nanozoomer, we imaged a whole unstained springtail (Arthropod, Collembola) Ceratophysella denticulata mounted on a slide. The images that were obtained using SLIM have better contrast and provide information about the orientation of hair and cells on the arthropod and have levels of morphological character resolution that allow the identification of individuals to genus or subfamily. To our knowledge, this is the first time QPI has been used to image an entire multicellular organism with submicron resolution. We also imaged whole unstained springtails representing the genera Willowsia and Dicranocentrus to evaluate the utility of QPI to provide fast, quality images with adequate resolution of morphological traits that can be incorporated in next generation natural history collection. 2.Materials and Methods2.1.SampleIndividuals of C. denticulata, Willowsia, and Dicranocentrus marias were collected in the field directly into 95% ethanol. The specimen preparation for slide mounting follows Mutt.35 After 7 days in ethanol, the specimens were cleared in Nesbitt’s solution (20 g chloral hydrate, 1.25 ml concentrated HCl, 18.5 ml distilled water) until pigment, gut content, muscle mass, and other soft internal tissues were digested and cleared (i.e., the tip of a needle placed behind specimen was clearly visible), and mounted on glass slide using Marc André II (50 g chloral hydrate, 5 g gum Arabic, 7.5 ml glycerin, 12.5 ml water). The slides were placed on a slide warmer at 50°C for 3 days to allow the mounting medium to harden before observation under the microscope. The sample was not stained. 2.2.SLIM SetupSLIM uses the phase contrast microscopy principle where the scattered and unscattered components of light are separated by a phase shift, and adds three additional phase shifts to obtain four intensity images from which the final phase is calculated.36 SLIM is sensitive to path length fluctuations of 0.3 nm. SLIM is an add-on module to a commercial phase contrast microscope (Zeiss Axio Observer Z1). The SLIM module projects the back focal plane of the objective to the liquid crystal phase modulator, which introduces three additional phase shifts. The four recorded intensity images are used to calculate the final phase image. The arthropod slide was imaged using the objective on the SLIM setup. The imaging features are illustrated in Fig. 1. We used the mosaic feature on the microscope, such that 294 () images were stitched together using a plug-in built in-house. The arthropods in this study were imaged with prerecorded manual focusing of different points in the mosaic. The focus point was set every 5 frames, resulting in approximately 10 focal points per sample. The imaging system has an autofocusing feature, but due to the relatively small sample size, the computational cost of autofocusing was not justified. Thus, we rendered a final quantitative phase image of the arthropod of dimensions . It took 10 min to align the microscope, set up the imaging mosaic, and focus the sample. The actual imaging time was 7 min for each sample. Fig. 1An unstained slide with the whole arthropod mounted on it is imaged using the mosaic feature and objective of the spatial light interference microscopy (SLIM) system. Four intensity images corresponding to each phase shift is recorded and the final phase image is calculated from these four images. In postprocessing, with the use of ImageJ, the individual frames are stitched together to obtain the final quantitative phase image of the arthropod. 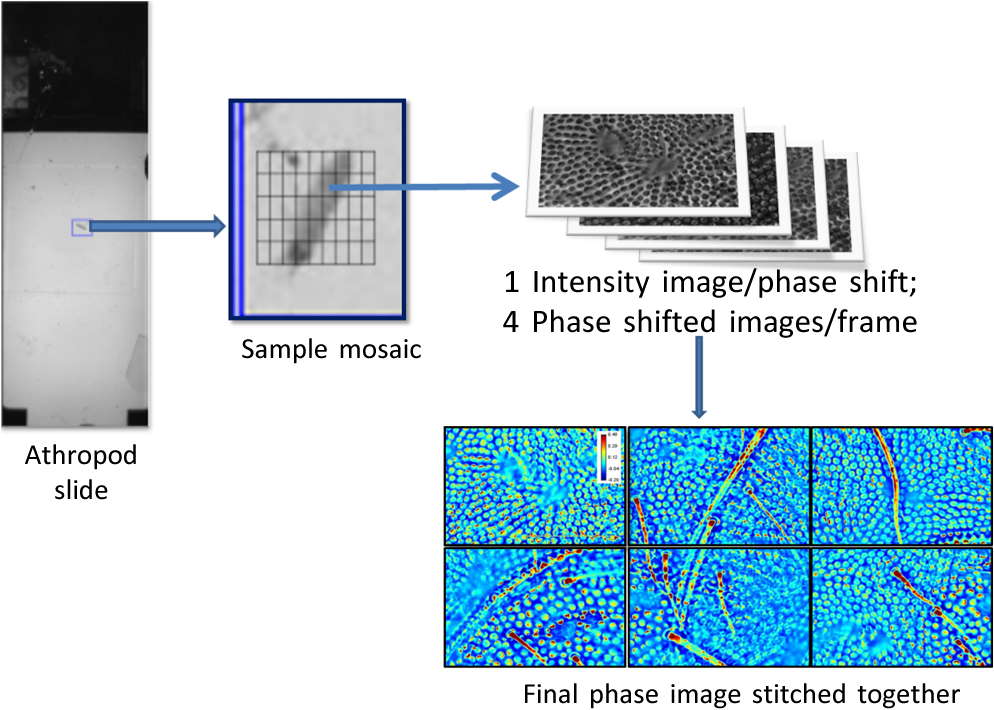 2.3.NanozoomerFor comparison, we imaged the C. denticulata sample using the Hamamatsu Nanozoomer. The NanoZoomer Digital Pathology (NDP) system (Hamamatsu Photonics, Japan) is a bright field microscope which requires the sample to have a high intrinsic contrast, which is typically achieved through staining of the sample. The Nanozoomer autofocuses the sample and images it using three color channels. It has a transverse resolution of 460 nm. It took us approximately 15 min to finish the setup, focus, and image the slide. While the imaging time on both setups is comparable, there is an additional postprocessing step involved in SLIM imaging. The SLIM image presents significantly higher contrast than the bright field image rendered by the tissue scanner. 3.ResultsThe images of C. denticulata that we obtained using the Nanozoomer and SLIM are shown side-by-side in Fig. 2. The Nanozoomer is only able to detect the highly absorbing structures such as the eye of the arthropod and the hard exoskeleton. On the SLIM image, in the highly absorbing regions, we see the transparent structures such as setae and cuticular ornamentation in the same region. Fig. 2(a) The unstained sample imaged using the Nanozoomer bright field microscope. While the Nanozoomer provides the advantage of speed, it can only capture highly absorbing structures such as the eye and the exoskeleton. (b) The SLIM image, which effectively captures the hair and cuticles on the external surface of the arthropod.  Figure 3 zooms in on a region of the arthropod. Clearly, in the SLIM image, we see individual hair (setae) and other cuticular structures on the body and limbs of the arthropod. On the bright field image, the setae and cuticular structures are transparent and not clearly visible. This is because the absorption in these structures versus the background and, as a result, the amplitude modulation is insignificant. The structure of the scales is clearly visible in SLIM images. The details in scale structure and shape are used to separate springtails into different genera. Figure 4 shows the ability of SLIM to differentiate between the scales characteristics of the genera Willowsia and Dicranocentrus. Fig. 3When we zoom into the bright field image of the arthropod (a), the structure of the cuticle and setae is not clearly visible. In (b), both are clearly visible. 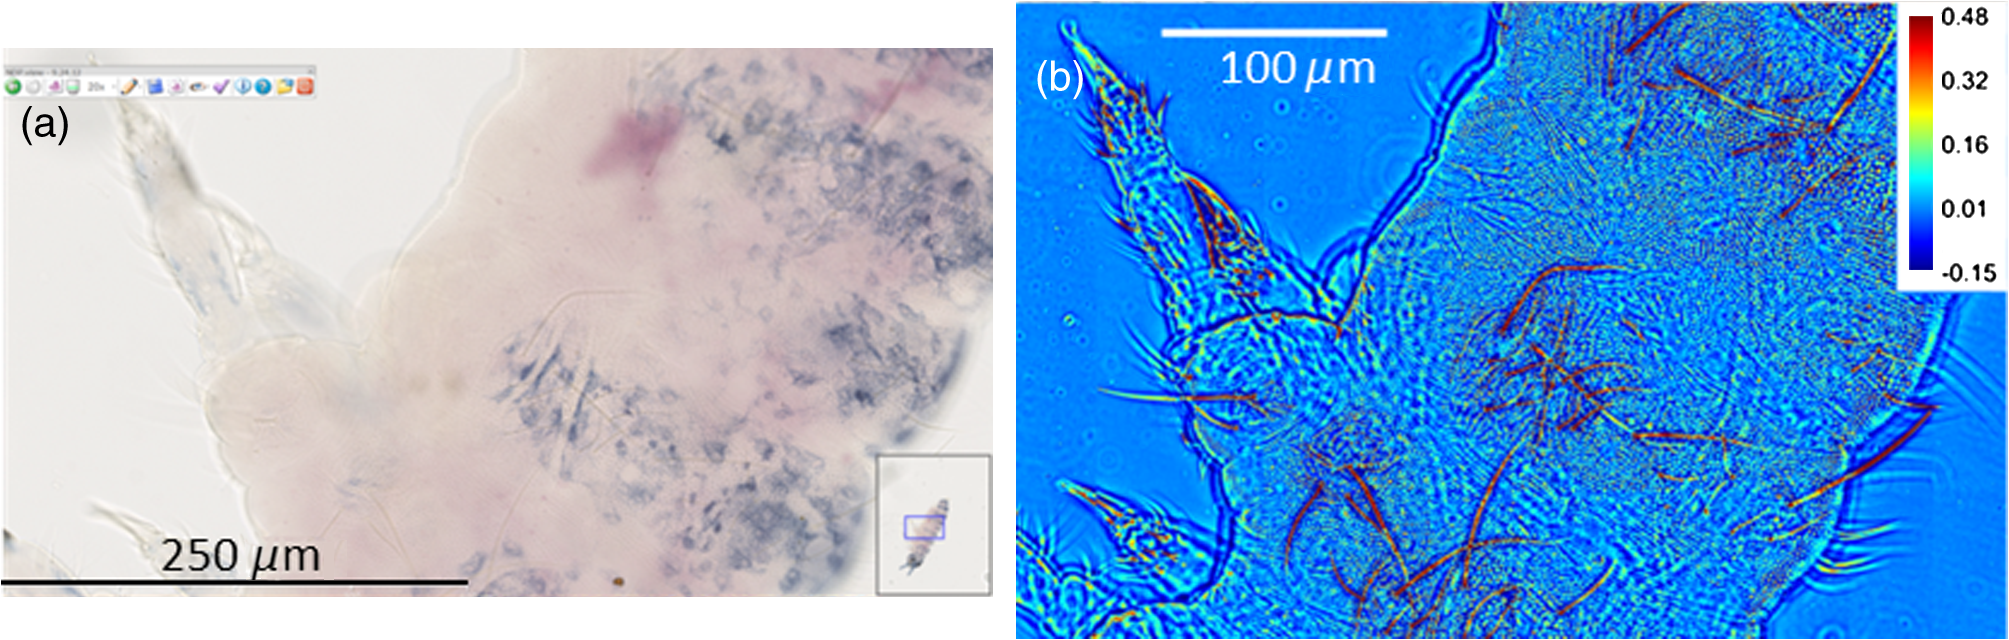 Fig. 4The physical properties of scales are used to categorize arthropods into various genera: (a) scale from a species of Willowsia which has a uniform phase pattern; and (b) scale from Dicranocentrus marias which shows greater discontinuity in fine structure, as seen in the phase distribution. 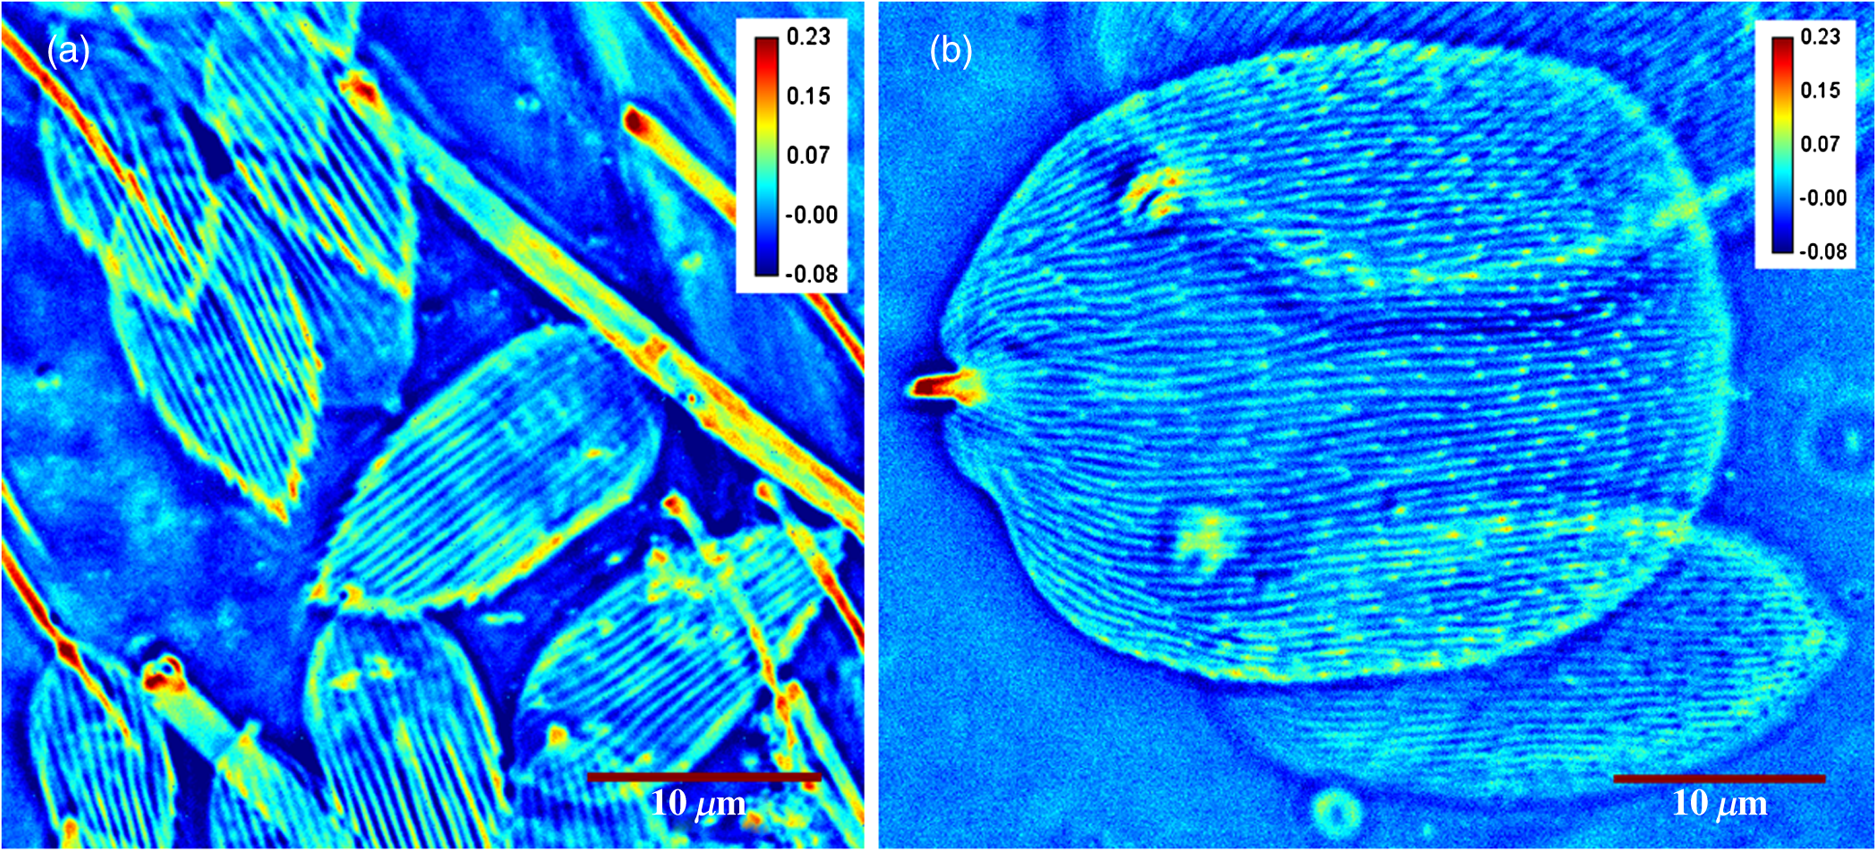 Figures 5 compares the ability of SLIM to image setae with greater contrast as compared with that of the Nanozoomer. In Fig. 6, we show the SLIM images of the different kinds of seta seen in Willowsia. The feathered seta is easily accessible in the quantitative phase image. Interestingly, on the microseta, the phase value appears relatively uniform; however, there is a nonuniformity in phase values along the length of the macroseta. In arthropods, setae serve as tactile receptors that can also detect vibrations in air or as chemosensory organs to detect smells and flavors.37 Seta length has been shown to be an indicator of mechanical sensitivity in water and air, whereas the diameter is correlated with sensitivity in water.38 Studies have also showed that arthropod setae can be categorized into different regions with specific mechanical properties based on diameter, wall thickness, and curvature.39 Due to the clear visibility of individual setae strands, the length, diameter, and curvature of seta can be easily determined. In addition to the potential use as a tool to study seta function and their adaptive significance, SLIM provides information and long-term preservation of graphic comparative morphological data that may be analyzed in new and creative ways. Fig. 5The cuticle of springtail Ceratophysella denticulata is imaged with SLIM (a) and Nanozoomer (b). The contrast between the images produced by the two instruments is significant and the SLIM image allows a detailed study of the setae. In the bright field image, the contrast presented is the best to view the setae. The absorption in the exoskeletal region obscures the bright field image of the arthropod. 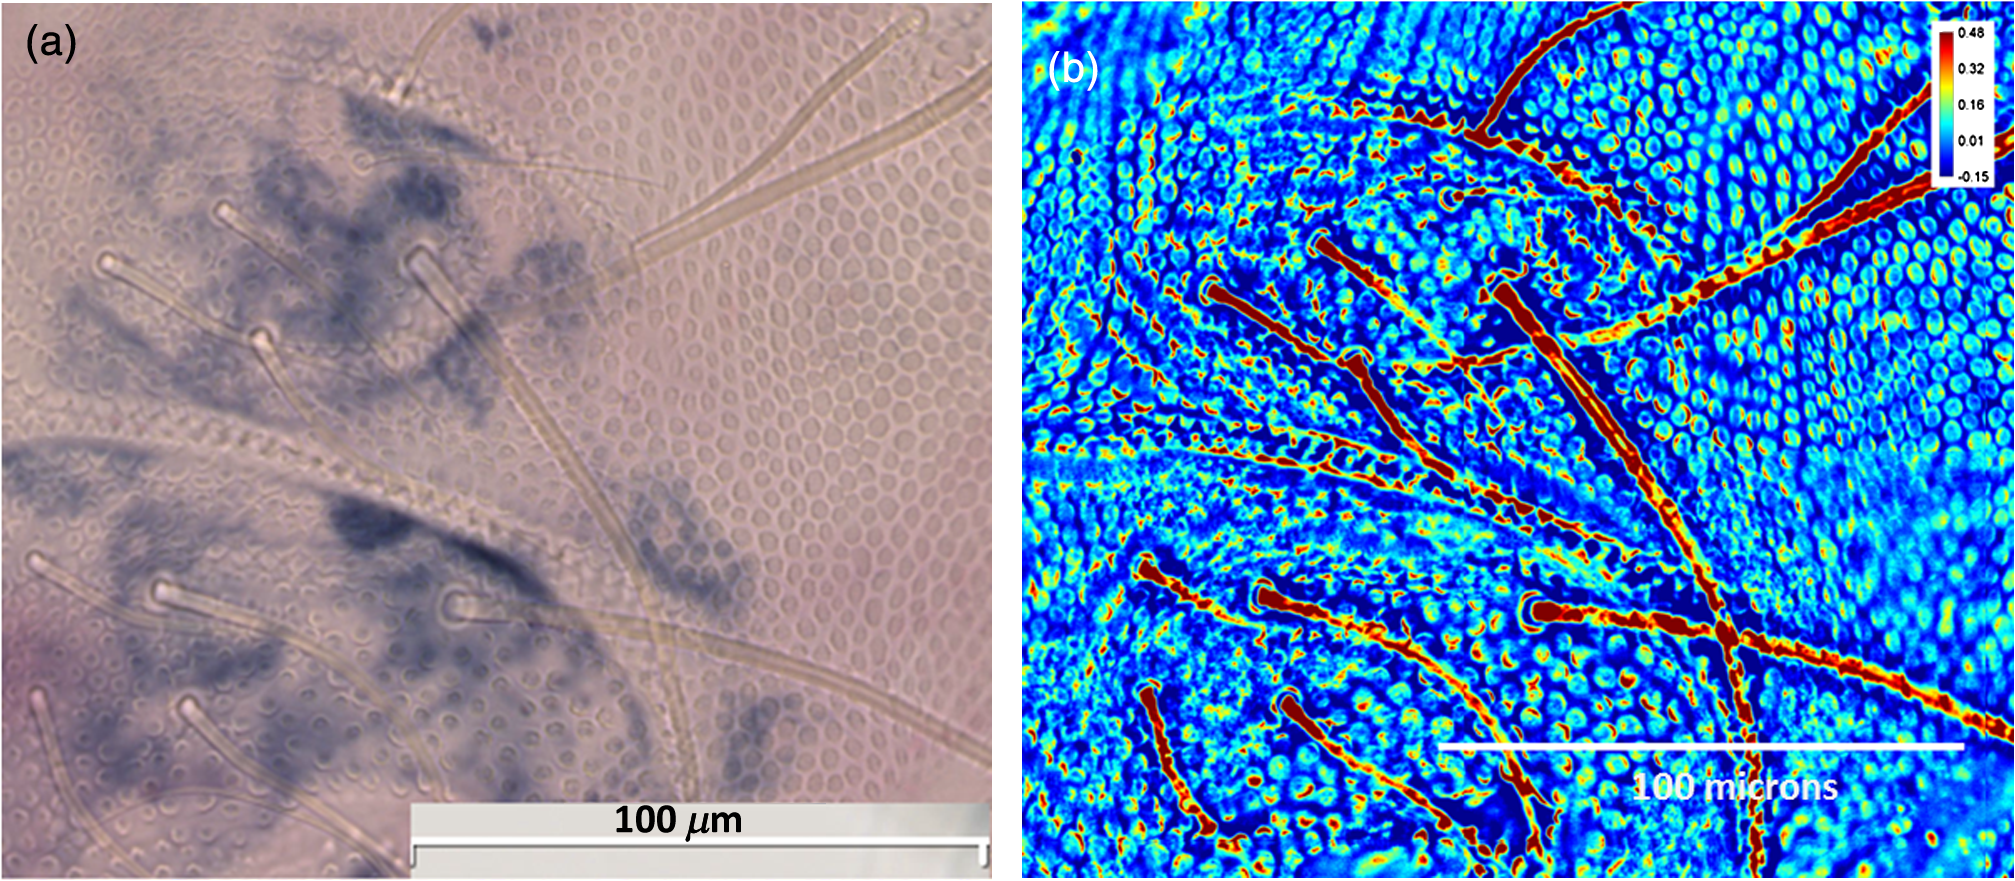 Fig. 6The direction and thickness of individual seta are important in the categorization of arthropods. On SLIM images, this information is easily accessible along with the physical properties of the setae: (a) feathery setae (scales) from Willowsia; (b) macrosetae on Willowsia showing a nonuniform phase distribution; and (c) microsetae in Willowsia showing a more uniform phase distribution. 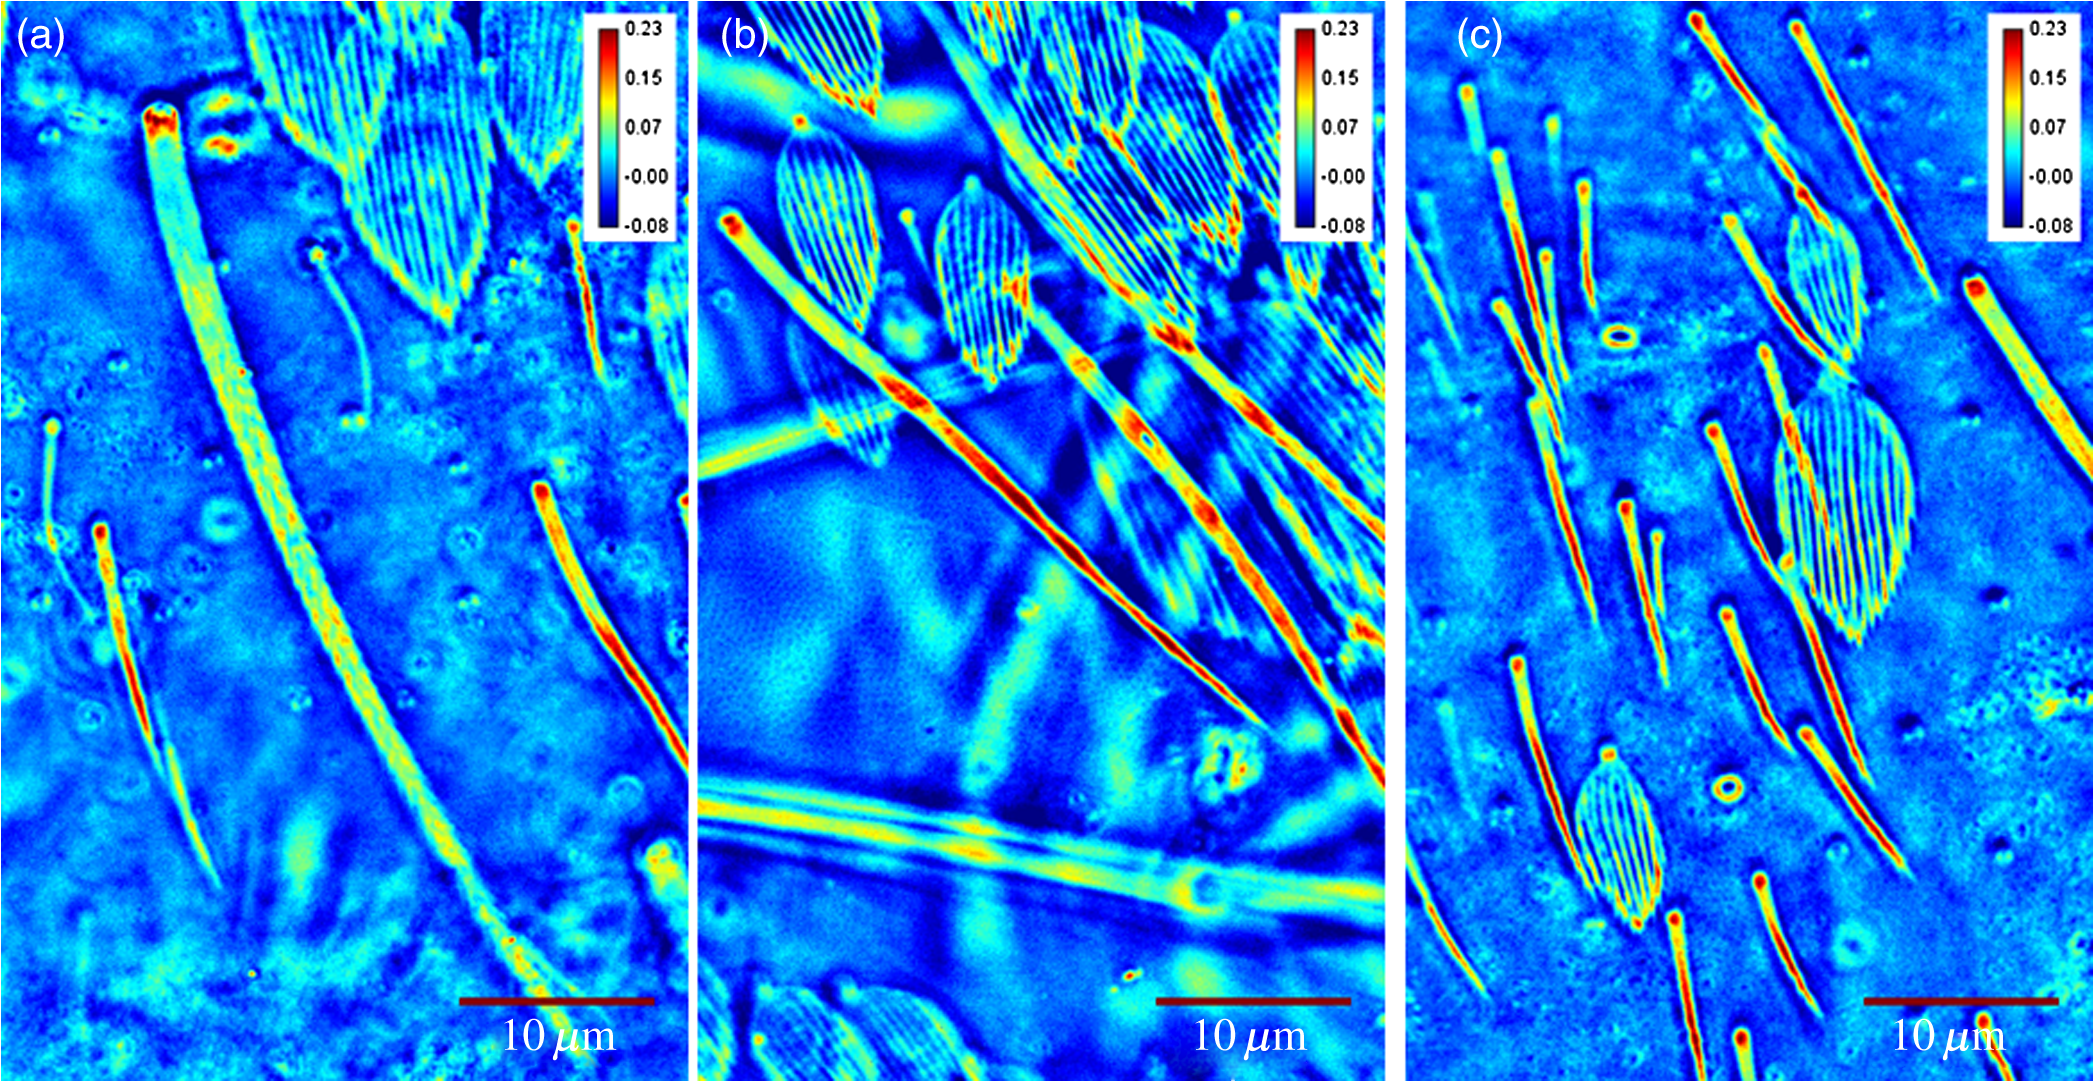 4.SummaryThis is the first time, to our knowledge, that QPI has been used to image a whole organism. QPI can be used to image arthropods that were fixed on slides many years ago without the need for invasive restoration or staining. With SLIM, one can quantitatively study the structure of setae and cuticular structures that are not visible with conventional bright field microscopy. In addition, the SLIM system provides levels of character resolution that allow the identification of individuals to genus in the case of Dicranocentrus and Willowsia. In qualitative phase contrast images or dark field images, the intensity depends on various external factors such as illumination intensity and the microscope used; therefore, the images are not replicable. The quantitative phase images are self-calibrated, so one would get the same phase values for the sample that is interrogated, irrespective of the illumination and microscope that were used. This makes SLIM a very valuable tool in the study of arthropods and would be an important addition to the natural history collections digitization effort. AcknowledgmentsThis research was supported by the National Cancer Institute (R21 CA147967-01) and National Science Foundation (CBET-1040462 MRI). We also thank Dr. Nahil Sobh and Dr. C. H. Dietrich for stimulating discussions. For more information, visit http://light.ece.illinois.edu/. Disclosure Gabriel Popescu has financial interest in Phi Optics, Inc., a company developing quantitative phase imaging technology for materials and life science applications. ReferencesF. Zernike,
“How I discovered phase contrast,”
Science, 121 345
(1955). http://dx.doi.org/10.1126/science.121.3141.345 SCIEAS 0036-8075 Google Scholar
D. Gabor,
“A new microscopic principle,”
Nature, 161 777
(1948). http://dx.doi.org/10.1038/161777a0 Google Scholar
G. Popescu, Quantitative Phase Imaging of Cells and Tissues, McGraw Hill(2011). Google Scholar
C. Depeursinge,
“Digital Holography Applied to Microscopy,”
Digital Holography and Three-Dimensional Display, 98 Springer, New York
(2006). Google Scholar
Y. Park et al.,
“Measurement of red blood cell mechanics during morphological changes,”
Proc. Natl. Acad. Sci. U. S. A., 107
(15), 6731
–6736
(2010). http://dx.doi.org/10.1073/pnas.0909533107 Google Scholar
G. Popescu et al.,
“Optical measurement of cell membrane tension,”
Phys. Rev. Lett., 97 218101
(2006). http://dx.doi.org/10.1103/PhysRevLett.97.218101 PRLTAO 0031-9007 Google Scholar
W. M. Ash, L. Krzewina and M. K. Kim,
“Quantitative imaging of cellular adhesion by total internal reflection holographic microscopy,”
Appl. Opt., 48
(34), H144
–H152
(2009). http://dx.doi.org/10.1364/AO.48.00H144 APOPAI 0003-6935 Google Scholar
A. Barty et al.,
“Quantitative optical phase microscopy,”
Opt. Lett., 23
(11), 817
–819
(1998). http://dx.doi.org/10.1364/OL.23.000817 OPLEDP 0146-9592 Google Scholar
C. J. Bellair et al.,
“Quantitative phase amplitude microscopy IV: imaging thick specimens,”
J. Microsc., 214 62
–69
(2004). http://dx.doi.org/10.1111/j.0022-2720.2004.01302.x Google Scholar
K. J. Chalut, W. J. Brown and A. Wax,
“Quantitative phase microscopy with asynchronous digital holography,”
Opt. Express, 15
(6), 3047
–3052
(2007). http://dx.doi.org/10.1364/OE.15.003047 OPEXFF 1094-4087 Google Scholar
P. Ferraro et al.,
“Quantitative phase microscopy of microstructures with extended measurement range and correction of chromatic aberrations by multiwavelength digital holography,”
Opt. Express, 15
(22), 14591
–14600
(2007). http://dx.doi.org/10.1364/OE.15.014591 OPEXFF 1094-4087 Google Scholar
C. Joo et al.,
“Spectral-domain optical coherence phase microscopy for quantitative phase-contrast imaging,”
Opt. Lett., 30
(16), 2131
–2133
(2005). http://dx.doi.org/10.1364/OL.30.002131 OPLEDP 0146-9592 Google Scholar
T. E. Gureyev, A. Roberts and K. A. Nugent,
“Phase retrieval with the transport-of-intensity equation—matrix solution with use of Zernike polynomials,”
J. Opt. Soc. Am. A, 12
(9), 1932
–1941
(1995). http://dx.doi.org/10.1364/JOSAA.12.001932 Google Scholar
S. S. Kou et al.,
“Quantitative phase restoration by direct inversion using the optical transfer function,”
Opt. Lett., 36
(14), 2671
–2673
(2011). http://dx.doi.org/10.1364/OL.36.002671 OPLEDP 0146-9592 Google Scholar
M. Mir et al.,
“Measuring cell cycle-dependent mass growth,”
Proc. Natl. Acad. Sci. U. S. A., 108
(32), 13124
(2011). http://dx.doi.org/10.1073/pnas.1100506108 Google Scholar
S. Sridharan, M. Mir and G. Popescu,
“Simultaneous optical measurements of cell motility and growth,”
Biomed. Opt. Express, 2
(10), 2815
–2820
(2011). http://dx.doi.org/10.1364/BOE.2.002815 Google Scholar
M. Mir, K. Tangella and G. Popescu,
“Blood testing at the single cell level using quantitative phase and amplitude microscopy,”
Biomed. Opt. Express, 2
(12), 3259
–3266
(2011). http://dx.doi.org/10.1364/BOE.2.003259 BOEICL 2156-7085 Google Scholar
R. Wang et al.,
“Dispersion-relation phase spectroscopy of intracellular transport,”
Opt. Express, 19
(21), 20571
–20579
(2011). http://dx.doi.org/10.1364/OE.19.020571 OPEXFF 1094-4087 Google Scholar
S. Sridharan et al.,
“Prediction of prostate cancer recurrence using quantitative phase imaging,”
Sci. Rep., 5 9976
(2015). http://dx.doi.org/10.1038/srep09976 SRCEC3 2045-2322 Google Scholar
Z. Wang et al.,
“Tissue refractive index as marker of disease,”
J. Biomed. Opt., 16
(11), 116017
(2011). http://dx.doi.org/10.1117/1.3656732 Google Scholar
D. L. DeGiusti and E. Leon,
“Two methods for serial sectioning of arthropods and insects,”
Trans. Am. Microsc. Soc., 74
(2), 197
–201
(1955). http://dx.doi.org/10.2307/3223885 TAMSAJ 0003-0023 Google Scholar
M.-M. Giraud-Guille, H. Chanzy and R. Vuong,
“Chitin crystals in arthropod cuticles revealed by diffraction contrast transmission electron microscopy,”
J. Struct. Biol., 103
(3), 232
–240
(1990). http://dx.doi.org/10.1016/1047-8477(90)90041-A JSBIEM 1047-8477 Google Scholar
G. Walker and V. E. Lee,
“Surface structures and sense organs of the cypris larva of Balanus balanoides as seen by scanning and transmission electron microscopy,”
J. Zool., 178
(2), 161
–172
(1976). http://dx.doi.org/10.1111/j.1469-7998.1976.tb06005.x Google Scholar
A. V. Klaus and V. Schawaroch,
“Novel methodology utilizing confocal laser scanning microscopy for systematic analysis in arthropods (Insecta),”
Integr. Comp. Biol., 46
(2), 207
–214
(2006). http://dx.doi.org/10.1093/icb/icj015 Google Scholar
J. Michels,
“Confocal laser scanning microscopy: using cuticular autofluorescence for high resolution morphological imaging in small crustaceans,”
J. Microsc., 227
(1), 1
–7
(2007). http://dx.doi.org/10.1111/j.1365-2818.2007.01787.x JMICAR 0022-2720 Google Scholar
A. V. Klaus, V. L. Kulasekera and V. Schawaroch,
“Three-dimensional visualization of insect morphology using confocal laser scanning microscopy,”
J. Microsc., 212
(2), 107
–121
(2003). http://dx.doi.org/10.1046/j.1365-2818.2003.01235.x JMICAR 0022-2720 Google Scholar
O. Betz et al.,
“Imaging applications of synchrotron X-ray phase-contrast microtomography in biological morphology and biomaterials science. I. General aspects of the technique and its advantages in the analysis of millimetre-sized arthropod structure,”
J. Microsc., 227
(1), 51
–71
(2007). http://dx.doi.org/10.1111/j.1365-2818.2007.01785.x JMICAR 0022-2720 Google Scholar
J. J. Socha et al.,
“Real-time phase-contrast x-ray imaging: a new technique for the study of animal form and function,”
BMC Biol., 5 6
(2007). http://dx.doi.org/10.1186/1741-7007-5-6 1741-7007 Google Scholar
K. A. Nugent et al.,
“Quantitative phase imaging using hard X rays,”
Phys. Rev. Lett., 77
(14), 2961
–2964
(1996). http://dx.doi.org/10.1103/PhysRevLett.77.2961 PRLTAO 0031-9007 Google Scholar
K. Creath and G. Goldstein,
“Dynamic phase imaging and processing of moving biological organisms,”
Proc. SPIE, 8227 82270M
(2012). http://dx.doi.org/10.1117/12.908859 Google Scholar
H. Sun et al.,
“Underwater digital holography for studies of marine plankton,”
Philos. Trans. R. Soc. A, 366 1789
–1806
(2008). http://dx.doi.org/10.1098/rsta.2007.2187 Google Scholar
E.-M. Zetsche et al.,
“Imaging-in-flow: digital holographic microscopy as a novel tool to detect and classify nanoplanktonic organisms,”
Limnol. Oceanogr.: Methods, 12
(11), 757
–775
(2014). http://dx.doi.org/10.4319/lom.2014.12.757 Google Scholar
A. Doblas et al.,
“Accurate single-shot quantitative phase imaging of biological specimens with telecentric digital holographic microscopy,”
J. Biomed. Opt., 19
(4), 046022
(2014). http://dx.doi.org/10.1117/1.JBO.19.4.046022 JBOPFO 1083-3668 Google Scholar
J. A. M. Mutt, A Revision of the Genus Dicranocentrus Schött (Insecta: Collembola: Entomobryidae), 2
–79 Agricultural Experiment Station, Bulletin
(1979). Google Scholar
Z. Wang et al.,
“Spatial light interference microscopy (SLIM),”
Opt. Express, 19
(2), 1016
(2011). http://dx.doi.org/10.1364/OE.19.001016 OPEXFF 1094-4087 Google Scholar
S. B. McIver,
“Structure of cuticular mechanoreceptors of arthropods,”
Annu. Rev. Entomol., 20 381
–397
(1975). http://dx.doi.org/10.1146/annurev.en.20.010175.002121 Google Scholar
R. Devarakonda, F. G. Barth and J. A. C. Humphrey,
“Dynamics of arthropod filiform hairs. IV. hair motion in air and water,”
Philos. Trans. R. Soc. B, 351
(1342), 933
–946
(1996). http://dx.doi.org/10.1098/rstb.1996.0086 PTRBAE 0962-8436 Google Scholar
H. E. Dechant, F. Rammerstorfer and F. Barth,
“Arthropod touch reception: stimulus transformation and finite element model of spider tactile hairs,”
J. Comp. Physiol. A, 187
(4), 313
–322
(2001). http://dx.doi.org/10.1007/s003590100203 JCPADN 0340-7594 Google Scholar
BiographyShamira Sridharan received her PhD in bioengineering from the University of Illinois at Urbana-Champaign in August, 2015. Her graduate research focused on the application of quantitative phase imaging for pathology to improve disease diagnosis and prognosis. Her research interests include clinical applications of optics and studying the effect of microenvironment on cellular proliferation. Aron Katz is an entomology PhD student at the University of Illinois Urbana-Champaign and is currently working on projects related to the biodiversity and systematics of Collembola. He is also interested in using Collembola to understand the evolutionary mechanisms driving high levels of cryptic diversity in soil organisms. He hopes a greater understanding of these enigmatic insect-like hexapods will promote their use in ecological and evolutionary research programs. Felipe N. Soto-Adames received his BS and MS from the University of Puerto Rico, Mayaguez and PhD in entomology from the University of Illinois, Urbana-Champaign. Currently he is an investigator in the Department of Entomology, University of Illinois at Urbana-Champaign. He research interests include taxonomy, phylogeny and morphological evolution in soil, marine and cave-adapted mircro-arthropods, as well as the evolution of muscle proteins. Gabriel Popescu is an associate professor in electrical and computer engineering at University of Illinois at Urbana-Champaign. His research is focused in biomedical optics, with special emphasis on interferometric label-free imaging. He has published a book on QPI, authored 110 journal publications, 120 conference presentations, 24 patents, and gave 120 invited/keynote/plenary talks. He founded Phi Optics, Inc., a startup company that commercializes quantitative phase imaging technology. He is a fellow of OSA and SPIE. |


