|
|
1.IntroductionSynergetic use of multiple imaging modalities—be it, e.g., for recording complementary diagnostic information, to enable the use of image reconstruction strategies incorporating multimodal priors, or to reduce total imaging costs—has gained a major focus in biomedical research over the last few years. Particularly, combining functional and anatomical information might improve the diagnostic value as it allows quantification of biological processes.1 The most sensitive imaging method for the visualization of metabolism and molecular processes in vivo, particularly in humans, is, at present, the positron emission tomography (PET).2,3 However, there is a more valuable alternative especially in small animal imaging: optical imaging (OI), comprising the detection of bioluminescent and fluorescent light distributions in vivo. In fact, it has been shown that OI can be more sensitive than PET in certain molecular imaging scenarios.4 Further, integrating two or more imaging modalities has become a major trend and is driven by diagnostic, technical, and/or economic aspects. At the time of writing, manufacturing integrated PET-MRI instruments has become just feasible for both clinical5 as well as preclinical6 imaging systems. However, the integration of OI systems into magnetic resonance imaging (MRI) scanners—a fusion instrumentation concept specifically of interest in preclinical research—trails somewhat behind because of technical reasons. Due to its design, an OI system might introduce susceptibility and zipper-like artifacts onto the MR images as there is an incompatibility of conventional optical cameras with the strong magnetic field of an MRI system. Moreover, the concomitance and interference of electromagnetic radiation of either system—posed onto the other—renders the integration of conventional optical cameras into the bore of MRI scanners difficult. For this reason, early approaches for simultaneous MR-OI were based on the use of optical fibers to guide emission light outside the imaged object for external detection.7–12 As fibers proved to be disadvantageous because of restricted geometric efficiency as well as their requirement to be in contact with the surface of the imaged object, investigators soon looked for alternative approaches. A feasible approach might be the use of mirrors encircling the imaged object in order to deflect the optical light field out of the MR’s magnetic field. Such a concept was described for a combined optical-PET system.1 Here, another integration concept is presented in which a purposely designed plenoptical detector is employed that was initially found to be compatible with PET, as well as being conceptionally compatible with MRI.13 Hence, this paper describes its technological development toward MRI compatibility particularly by means of introducing an integration assembly of optical detectors with a radio frequency (RF) volume resonator coil. Within the scope of this proof-of-concept project, constructive work will be tailored for integration employing a patient-sized MRI system. 2.MaterialsAs mentioned in the previous section, a conceptionally multimodal OI system has been especially developed in our lab to simultaneously acquire radioactive and optical data. A key feature of that system is the (multiple) use of very thin microlens-based optical detectors (MLODs) which are concentrically aligned around the imaged object such as to fit as a whole into the bore opening of a dedicated microPET imaging system. Here, we start our research with a similar MLOD detector layout. However, light detectors were further investigated and redeveloped with regard to optimizing material and shielding properties in order to fulfill MRI compatibility. Beyond that, in the context of simultaneous acquisition of experimental MRI and OI data, it was necessary to design and to integrate a custom-built RF resonator (six-leg birdcage design) that can be fully coupled with the MLOD tomography device. An overview illustration of the device setup is presented in Fig. 1. Fig. 1Exploded view of the complete optical imaging (OI) insert. (a) Shielding enclosure for the OI insert. (b) Housing for the signal gaining circuit board (PCB). The six microlens-based optical detectors (MLODs) (on the right side) are directly attached to this housing. (c) Six-leg birdcage RF resonator. (d) Front view of the whole assembly.  2.1.Overall SetupSix MLOD sensors were concentrically arranged around the imaged subject, coaligned with an integrated bespoke MRI coil, as shown in Fig. 1(c). A cylindrical housing which contains a signal amplification printed circuit board (PCB) was directly attached to the MLODs. The whole assembly was RF shielded against the RF field of the custom-built resonator with a thin copper layer. Particular emphasis was laid on the use of as low an amount of paramagnetic material as possible. To enable tomographic imaging, the whole optical system can be continuously rotated by 180 deg allowing data acquisition around 360 deg. Although the experiments were carried out in a patient-sized MRI scanner, the system was designed to also fit into a smaller-sized animal MRI scanner. The total length of the system is 40 cm and its outer diameter is 19 cm. The maximum diameter for the object is 4 cm and the maximum length is 5 cm. 2.2.Microlens-Based Optical Detector DesignEach MLOD consists of three major parts: a microlens array (MLA), a septum mask, and a photon sensor. With lenses and a lens diameter of , the MLA has an overall size of . The principal scheme of the detector setup and an exploded view of a complete MLOD is shown in Fig. 2. Fig. 2(a) Principle drawing of an MLOD setup: the top layer (colored in blue) illustrates the microlens grid. The bottom layer (colored in green) depicts the photon sensor. An opaque septum mask (colored in gray) between the microlens array (MLA) and the photon sensor avoids crosstalk between different lenses. (b) Principle design of an MLOD detector. The photon sensor (CMOS) fits into a copper-coated plastics housing, whereas the septum mask seals the copper-coated housing and ensures electromagnetic shielding. 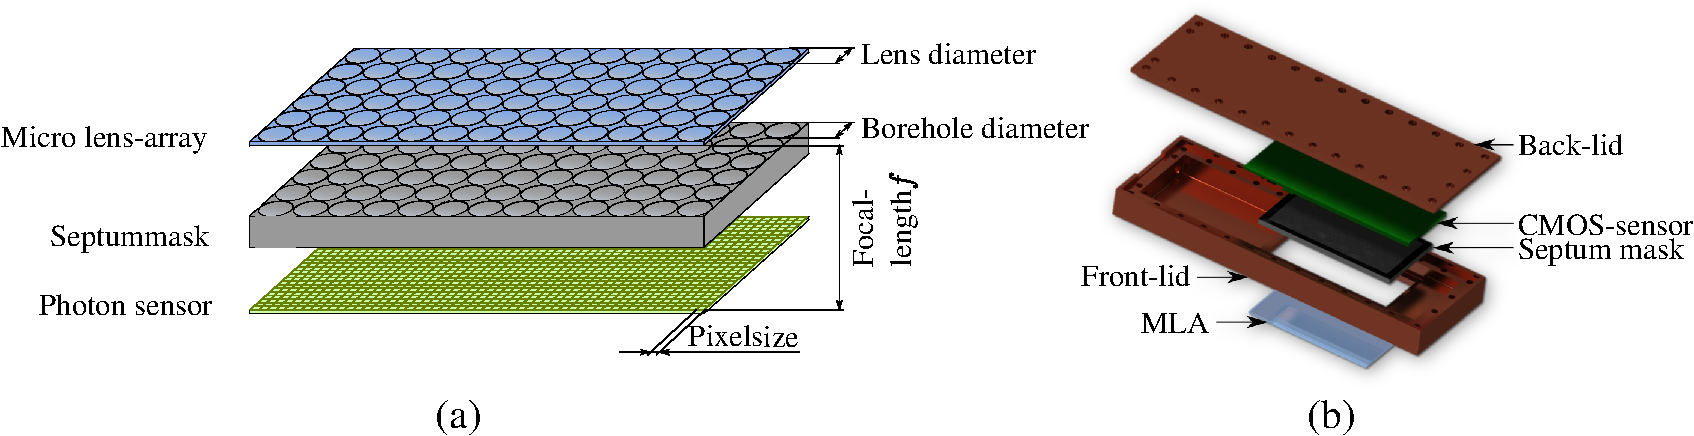 The septum mask, intended foremost for interlens light field separation, was made of anodized, sand-blasted aluminum. Senkbeil et al.14 showed that a sand-blasted surface reduces reflection, and thus increases spatial resolution of the optical data. However, the septum mask plays another crucial role in the OI/MRI concept: due to its 5:1 borehole length-to-diameter ratio, the septum mask shields the photon sensor against RF interference, and enables simultaneous acquisition of OI and MRI data.15 The thickness of the septum mask correlates with the focal length of the microlenses (2.2 mm). The diameter of the boreholes is set to . For the photon sensor, a CMOS (RadEye 1, Teledyne RAD-ICON Imaging, Ontario, Canada) was employed and mounted on the converse side of the septum mask. at a pixel size of create an active detection area of approximately ( mask size). The entire housing of the MLOD was made of acrylonitrile butadiene styrene thermoplastic. It was further galvanized with copper in order to ensure shielding of the whole sensor and of the signal amplifying PCB from the RF transmitting/receiving environment. To prevent severe eddy current formation and to minimize artifacts in the MRI, the thickness of the copper layer is kept as thin as possible at . Due to its plenoptic nature, an MLOD requires a postprocessing step.16 A reconstruction algorithm has been developed17 which maps the pixel data onto a predefined focal plane. This algorithm was applied for all MLOD measurements in this paper. 2.3.Radio Frequency Volume ResonatorAs the MLOD shielding inhibits image acquisition with standard RF coils, a custom-built RF resonator was purposely designed to fit inside the OI system. The resonator (Fig. 3) represents a low-pass birdcage design with six rectangular legs and is operated in linear mode. It is tuned to the resonance frequency of the 1.5 T MRI at hand () and was matched to the impedance of the scanner (). To avoid crosstalk between the coil and the MLODs, the legs were mounted between the detector’s field of view. Notice that the copper shielding of the detector housing acts as an RF shield for the resonator. 3.MethodsExperimental studies were carried out inside a 1.5 T patient-size MRI scanner (MAGNETOM Symphony 1.5 T, Siemens Healthcare, Erlangen, Germany). Imaging characteristics of both subsystems were examined, as well as their mutual influence on each other. For this reason, measurements were performed twice with only one active modality, respectively, and then compared to simultaneous data acquisition with both imaging systems turned on. Two phantoms were designed and used:
Fig. 4(a) Silicone cylinder fitted with multiple boreholes following a Derenzo pattern. The borehole diameter ranges from 1 to 2 mm (), respectively. (b) The phantom is placed inside a glass cylinder filled with 0.9% sodium chloride. (c) The silicone phantom contains four tritium-based light sources (seen as bright circles) in a computed tomography cross section. (d) Spectrum of one light source. Right corner: picture of the light source.  3.1.Microlens-Based Optical Detector PerformanceImage quality was evaluated by measuring spatial resolution employing a Siemens star with 16 segments mounted on a flat light source. The distance between the Siemens star and the detector was set to 40 mm. The acquired and subsequently reconstructed images were Fourier transformed with a two-dimensional fast Fourier transform and the spatial frequency was determined by the minimum relative contrast. For sensitivity evaluation, the emitted light of the tritium light sources was measured for 100 s. The relative sensitivity of the MLOD system was then determined by evaluating the measured intensity (an ROI is drawn over the whole detection area). 3.2.Magnetic Resonance Imaging/Birdcage Resonator PerformanceA total of three MRI protocols were employed for the measurements:
Standard prescan calibration (frequency and reference voltage) and shimming were performed. Resonator performance was evaluated by means of signal-to-noise ratio (SNR), uniformity, and quality factor in a loaded () and unloaded state (), as well as the filling factor. SNR and uniformity were determined in transverse, coronal, and sagittal planes. The spatial resolution in MRI is expressed by the voxel size and depends on the installed gradient system as well as on the protocol parameters. For the used protocols, the pixel size was set to . The birdcage coil and the OI insert itself had no direct influence on spatial resolution. To determine the SNR, the same procedure as described in NEMA MS 1-2008 standard was applied. In addition, the quality factor () and the filling factor were calculated. The influences of eddy current formation and magnetic field (-field) distortions were evaluated by measuring the image homogeneity or uniformity, respectively. Homogeneity was measured in two different ways: first, by using the peak deviation nonuniformity method as described in NEMA MS 3-2008 standard. Second, the homogeneity over the signal producing area is expressed additionally by SNR maps. For these maps, the SNR was calculated for each voxel by dividing its signal intensity by the standard deviation of the background noise. In addition, flip angle maps were created using the double-angle method.18 3.3.Ex Vivo MeasurementsTwo tritium-based light sources were implanted in the back of a dead nude mouse, about 5 mm to the right and left, respectively, of the spine. MR measurements were performed by applying a T1-weighted spin echo protocol (, , , ). For the simultaneous optical acquisition, the exposure time was set to 40 s. MR images were used for an automatic three-dimensional (3-D) volume reconstruction. As OI represents a surface-weighted imaging modality, a surface extraction for the fusion of OI and MR data from this volume was an indispensable step. 4.ResultsFirst, the results of the performance evaluation of the MRI/birdcage resonator without the influence of the optical detectors (electronics tuned off) are presented. In Sec. 4.2, the MLOD performance with and without RF pulses as well as the influence of the optical system on the birdcage resonantor is presented. Section 4.3 presents the results of the animal experiment. 4.1.Magnetic Resonance Imaging/Birdcage Resonator Performance4.1.1.Tuning and matchingThe birdcage coil was tuned to a 1.5 T MRI scanner () and matched to its impedance. In the unloaded state, the scattering parameter at the network analyzer channel reached at a frequency of 63.74 MHz. When loaded with the 0.9% NaCl-filled cylinder, the magnitude dropped to . However, the difference of was negligible as enough power for an adequate MR signal was available. 4.1.2.Quality factorWhen loaded with the 0.9% NaCl solution glass cylinder, was measured at 98, whereas in the unloaded state was 135. Hence, results in 72.59%. The filling factor of the coil is calculated at 0.69. 4.1.3.Signal-to-noise ratioLarge differences in the SNR for the different protocols (SE T1w, TSE T2w, and SE Nema) with the birdcage resonator were clearly visible (Fig. 5), which was a result of the used parameter adjustments. Fig. 5NR comparison between MLODs tuned off and on. (a) The OI insert is placed in the MR isocenter at an initial position (). (b) Signal-to-noise ratio (SNR) after a rotation around the -axis (-plane) by 30 deg. The results showed no statistical difference within the calculated error between MLODs tuned off and on. The error bars represent the standard deviation from 10 measurements.  Furthermore, fluctuations between the different views were evident. This was primarily due to a changing background noise, which strongly influences the SNR. Additionally, inhomogeneities over the larger area in the sagittal and coronal planes yield a lower SNR. In Fig. 5(a), the MLOD insert was placed in the MR isocenter at the reference position at 0 deg (in -direction). The tuning and matching process on the workbench and the scanner prescan calibration procedure were performed in this position. After the SNR was examined, the insert was rotated around the -axis by 30 deg and the measurements were repeated [Fig. 5(b)]. As the scanner was shimmed to measurements at the reference position at 0 deg, a decreasing SNR was an inevitable consequence. The asymmetric geometry of the OI insert influenced the formation of eddy currents, and increased the image inhomogeneities, which lowered the SNR. 4.1.4.Image homogeneityResults of the uniformity measurements are visualized in Fig. 6 and are also compiled in Table 1. It is worth mentioning that the copper shielding of the detectors disturbed the homogeneity of the -field which, in turn, reduced the homogeneity of all images. At the same time, fluctuations between different views were also large. In particular, the sagittal (-plane) and coronal (-plane) planes showed high inhomogeneities as the detector setup had some irregularities along the -axis (e.g., the transition from detector housing to septum mask). This effect was further increased as the OI insert was rotated by 30 deg around the -axis. Due to the asymmetric geometry of the insert, the prescan calibration and shimming procedure were mostly neutralized, and the inhomogeneities in general increased. Large fluctuations in the SNR maps were clearly visible, which arose from the aforementioned effects of the irregular and asymmetric detector design. The flip angle maps confirm these observations. In the transverse slice, the flip angle dropped, especially at the edge of the phantom. A similar situation appeared in the sagittal and coronal planes. Again, large irregularities of the angle in the boundary areas appear. Fig. 6MR images of a cylindrical phantom filled with 0.9% NaCl in three different orientations: the upper row (gray images) shows one exemplary slice of the phantom. The lower rows (colored images) show the corresponding SNR maps. The images in transverse and sagittal views represent image sections, which are adapted to the field of view of the MLODs. The last row represents the flip angle maps: a large difference of the angle is clearly visible (especially in the edges). 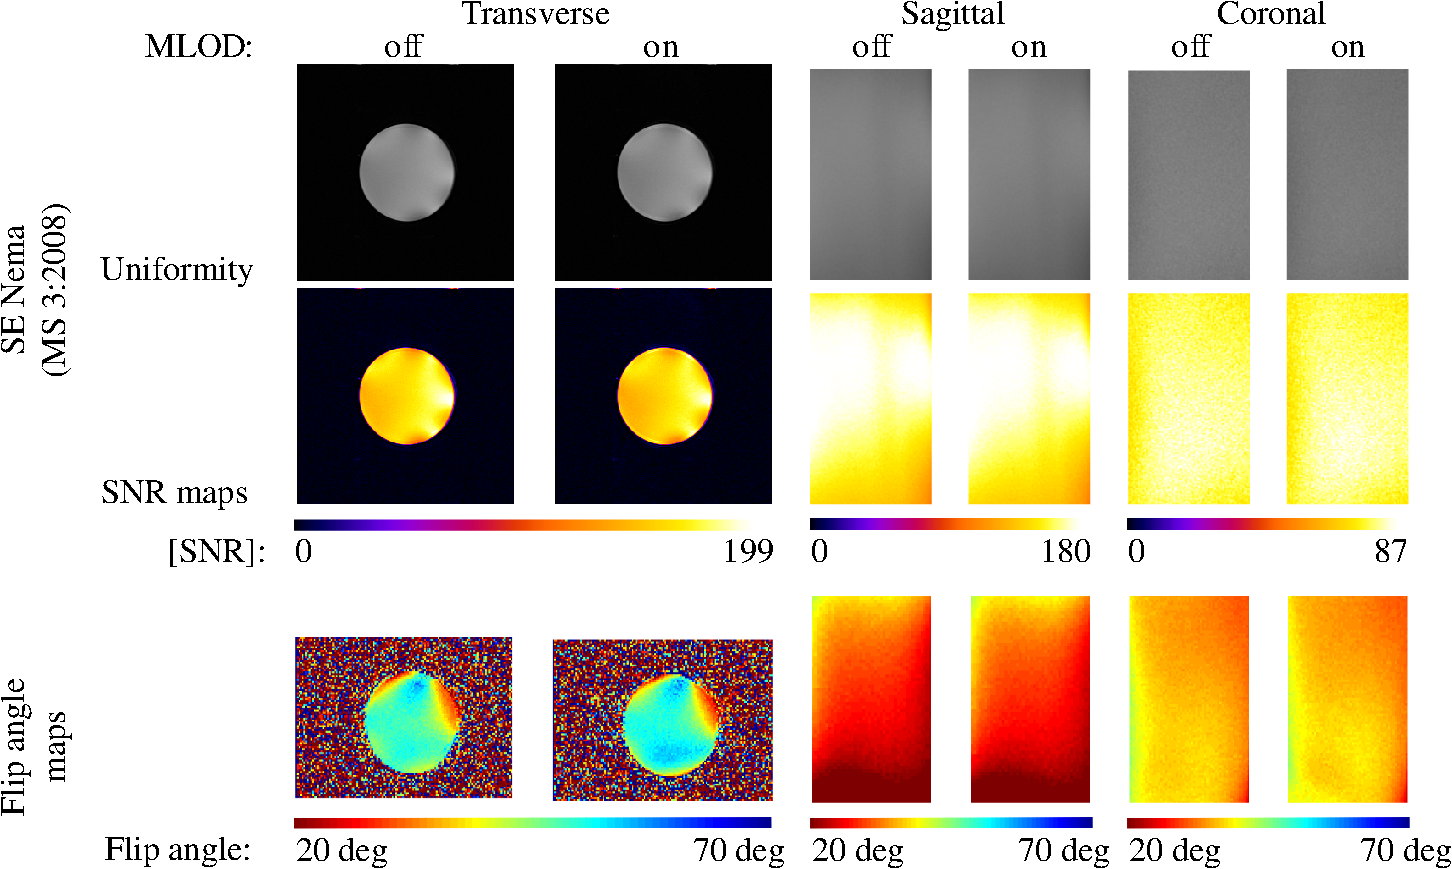 Table 1MR image uniformity under various magnetic imaging resonance (MRI) protocols. The measurements were performed by using the peak deviation nonuniformity method as described in NEMA MS 3-2008. The reported variances represent the standard deviation from 10 measurements.
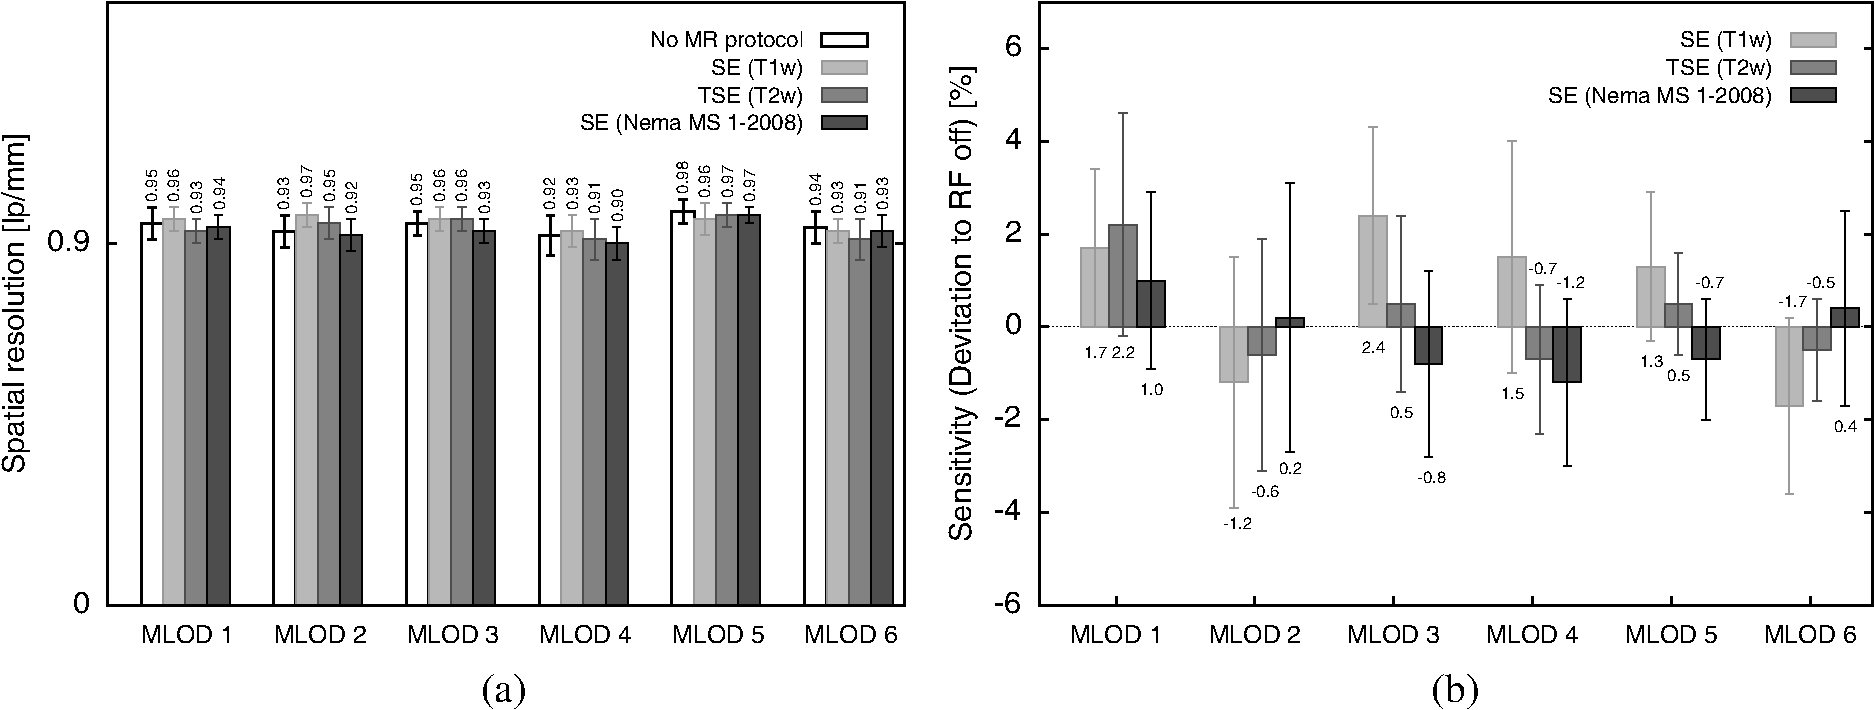
4.2.Crosstalk between Magnetic Resonance Imaging and Microlens-Based Optical Detector InsertFigure 7 shows a comparison of the tritium-based light sources (implanted in a nude mouse) with and without MR measurements. The bioluminescent images were matched with gray images from the mouse. Fig. 7Images of the tritium-based light source in a nude mouse: (a) image was acquired without RF pulses and (b) during a simultaneous OI/MR measurement. There were no mentionable differences in the OI data detected. 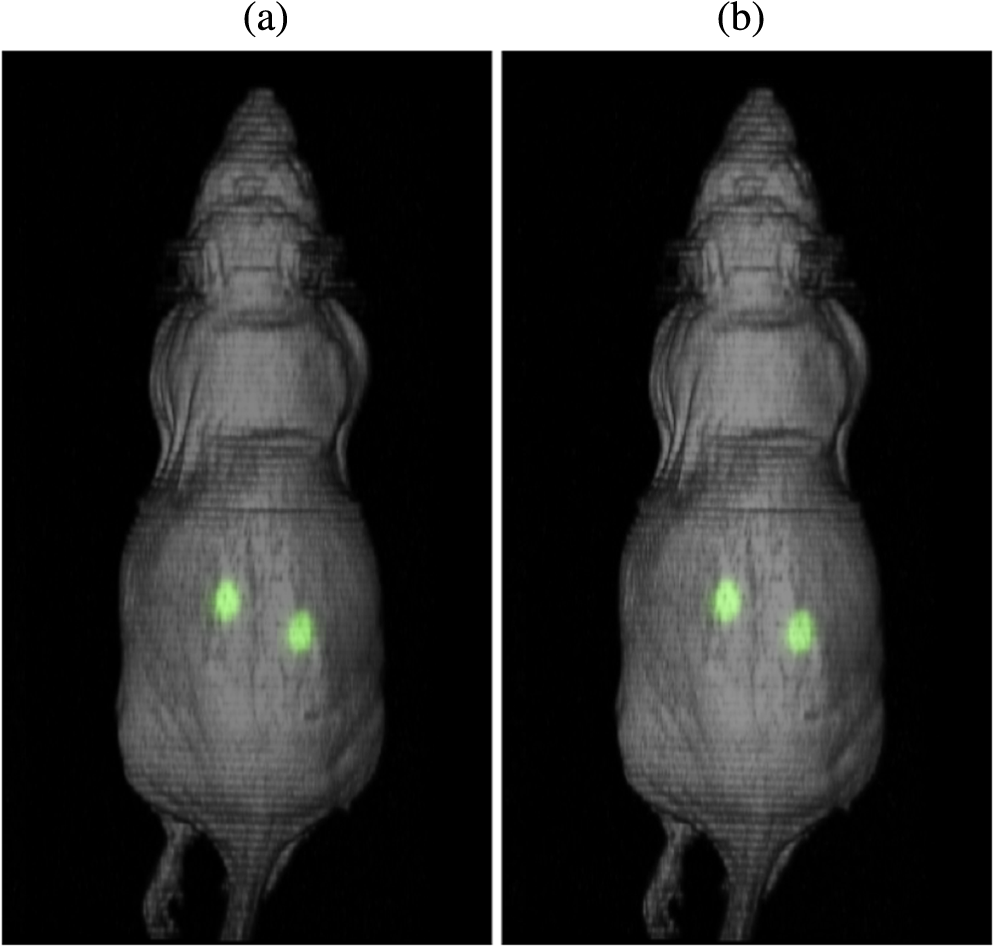 4.2.1.Spatial resolutionMeasurements with the Siemens star pointed out that there was almost no change in spatial resolution during different MR protocols compared to a measurement when no RF pulses were applied. Without RF pulses for the six MLODs, the spatial resolution was within a range of [see Fig. 8(a)]. When RF pulses were applied, MLOD 1 deviated from the reference measurement “RF off” by about , MLOD 2 about , MLOD 3 by , MLOD 4 by around , MLOD 5 by , and MLOD 6 by . These small deviations were an indicator for the lack of any influence of the RF pulses on the spatial resolution of the OI insert. The uncertainties that emerged from the method were used to determine the “gray spot” of the Siemens star and are negligible. 4.2.2.SensitivityThe situation was similar for the sensitivity measurements as the deviation of the sensitivity to the reference measurement (“RF off”) was less than [Fig. 8(b)]. Further analysis revealed that these deviations were primarily related to a temperature fluctuation (of about 4 K) of the CMOS sensors during operation. Thus, they were not caused by the MR scanner. The effect of an increasing temperature on the sensitivity will be discussed in detail in Sec. 5. Even though there were some deviations, all measurements enclosed zero within two standard deviations. Regarding the MRI, the direct comparison of the SNR, whether the MLODs were tuned off and on, showed no noteworthy differences in the images as well. At the reference position at 0 deg [Fig. 5(a)], small fluctuations between the two states were present, which were increased by rotating the OI insert by 30 deg. This effect was due to the compensation of the prescan calibration and shimming procedure. However, in both cases, the deviations of the SNR were still below the determined errors. Differences in uniformity showed a similar behavior: only small deviations between MLOD on and off were present. 4.3.Ex Vivo ResultsEven though the uniformity results of the birdcage coil yield, in partly, large inhomogeneities, the MR data of the nude mouse were hardly influenced by them (see Fig. 9). This is because the large drop of signal only appeared on the edge of the phantom. The diameter of the mouse torso, however, is smaller than the above used phantom. The presented transverse slices show the location of the implanted light sources. As the sources did not generate an MR signal, they appeared in the images as dark bulges of the skin (marked in red). Fig. 9MR images of a nude mouse. (a) Top view from the three-dimensional (3-D) volume reconstruction (gray images). (b) Corresponding optical image from top view. (c) and (d) Transverse slices through the mouse. The red circle marks the position of the two light sources. As the sources do not generate an MR signal, they appear as dark bulges.  A total of 97 transverse slices were acquired over the whole mouse body. The images were used for a 3-D volume reconstruction [see Fig. 10(b)]. This reconstruction was followed by the extraction of the mouse surface. Subsequently, the 2-D images from the OT detectors are projected on the mouse surface. 5.DiscussionAn MLOD-based OI system was successfully integrated into a patient-sized MRI scanner. Simultaneous data acquisition studies showed no major influences from the magnetic field and RF pulses onto the MLOD performance. The evaluation of the system yielded a spatial frequency of an average of for the six detectors. It is worth mentioning that each lens forms a macropixel, therefore, the spatial resolution depends on the size of this pixel. In this particular case, the used CMOS-sensor has a maximum resolution of , each lens covers , and the resolution is theoretically decreased by a factor of 10 (). The difference of is attributable to an inadequate alignment of the MLA as the lenses were aligned under a light microscope and fixed with an instant adhesive. A more preferable method would be a variable fixation with adjustable screws (which is used in Senkbeil et al.14), where the lenses can be arbitrarily positioned and a misalignment can be corrected at any time. Compared to state-of-the-art fiber-based OI-MRI or OI-PET systems,19,10 both spatial resolution as well as geometric efficiency are much more improved. Due to a missing excitation light source for fluorescence imaging, the presented system is restricted to bioluminescent imaging only; future work will focus on embedding an MR-compatible excitation light source for fluorescence imaging. Because of MR compatibility, the most obvious solution is a fiber-coupled light source, whereas the light source is placed outside of the MR cabin. Depending on the study and the used fluorescent tracer, this also allows an easy and fast replacement of the light sources. Particularly difficult was the examination of the MLOD’s sensitivity: the used CMOS sensors do not allow the quantification of the sensitivity/luminance. We further observed a temperature problem with the used CMOS sensors. With an increasing measurement time, the temperature increased about 4 K. As a consequence, the dark noise and the sensitivity were decreasing. However, in this proof-of-concept study, this was of rather low concern because in this work we want to demonstrate that it is possible to integrate an optical detector with its electronics in an MRI, and perform simultaneous OI/MR without any influence from the different systems on each other. The measurements with the used tritium-based light sources proved that there is no influence from MRI on this parameter and gave a first expression about future prospects with this system. To overcome the missing quantification of the sensitivity and the observed temperature shift, future work will focus on an improved detector concept with a cooling system which is able to quantify the sensitivity/luminance. Even though the sensitivity was not quantified, experiments in Ref. 20, which used the same CMOS sensor presented here, showed that the sensor’s sensitivity is good enough for bioluminescent imaging. Concerning the MRI, the complete MLOD imaging system (including its electronics and cabling) did not significantly degrade the MRI performance during our initial measurement studies. The MR images were free of zipper-like artifacts, which would appear if the electronic shielding was insufficient. Also, the SNR comparison showed no noticeable influence from the MLOD. Beyond that a higher SNR is preferable and might be realized with appropriate protocol settings. This would, however, in most cases, increase the measurement time, which was avoided in this work to keep the MR protocol time similar to the MLOD acquisition time (). Note that the used RF resonator is operated in linear mode as a six-leg design was used in order to match the OI system. However, a -leg design enables the use of quadrature mode and would theoretically increase the SNR by a factor of .21 The high degree of inhomogeneity in the MR images was disadvantageous. Here, two factors were crucial: first, imperfections in the custom-made birdcage coil created an inhomogeneous -field, thus the transmit/receive characteristic of a homogeneous field was restricted. Second, the design of the OI insert played an essential role for the uniformity. The MR gradient systems created eddy currents in the copper shielding, and hence, distorted the -field. The strength of the eddy currents depends on the size of the conductive area and their arrangements. For instance, the larger the area of the copper shielding, the larger the eddy currents. The z-gradient especially created large eddy currents in the cylindrical objects arranged like the OI system. This effect could not fully be compensated by the shimming procedure. The presented experiments were performed after shimming the MR system to the reference position of the OI system (0 deg). After a rotation of the system of about 30 deg, the MR homogeneity decreased by about 10%. After shimming the MR system to a new OI position, the performance was still lowered (about 9%) than before the rotation. The reason for this is the asymmetric setup of the optical system. The tuning and matching process on the workbench are performed for the reference position. When rotating the system, the resonance peak of the RF-resonator is slightly shifted, therefore, the performance decreases. To overcome this problem, the resonator needs to be tuned and matched again after the rotation. However, in practice, this is nearly impossible as the tuning and matching process is performed on the workbench outside the MRI. For this reason, the presented system is restricted for use in the reference position. The nude mouse experiment yielded a successful experimental data acquisition, 3-D volume reconstruction, and the fusion of OI with MR data, even though measurements with living small animals would be preferable. These studies will be carried in the future with the aforementioned improved detector concept. 6.ConclusionAn OI device, comprising bioluminescent and potentially fluorescent imaging, was successfully integrated into a patient-sized MRI scanner. Influences of one system on the respective other one (and vice versa) were examined. The proof of principle was confirmed by a simple experiment with a dead nude mouse. In a next step, we also plan more detailed studies with living mice and bioluminescent probes. Examination of the custom-made RF resonator (birdcage coil) resulted in an acceptable SNR for the different protocols. Here, only some unfavorable inhomogeneities are worth noting. In the future, we plan to implement a new OI design, employing different photon sensors, but also based on MLAs. We seek to eliminate the aforementioned inhomogeneity problems, especially the geometrical distortions, as far as possible. However, most importantly, we will shift our focus toward the integration of the OI system into dedicated preclinical MRI systems with higher field strengths. AcknowledgmentsThe authors would like to acknowledge Heinrich Ruehle and his colleagues from the DKFZ workshop. Special thanks also go to Detlev Berndt from the Kunststoff Institut Luedenscheid and Bernhard Grokinsky from Gehr GmbH, Mannheim. Further acknowledgement goes to Barbara Dillenberger and Manuela Roesler from the DKFZ RF lab. Thanks to Dr. Manfred Jugold from the DKFZ small animal imaging core facility for the support of the ex vivo measurements. ReferencesS. R. Cherry,
“In vivo molecular and genomic imaging: new challenges for imaging physics,”
Phys. Med. Biol., 49
(9), R13
(2004). http://dx.doi.org/10.1088/0031-9155/49/3/R01 PHMBA7 0031-9155 Google Scholar
D. Rowland, J. Lewis and M. Welch,
“Molecular imaging: the application of small animal positron emission tomography,”
J. Cell. Biochem., 87 110
(2002). http://dx.doi.org/10.1002/jcb.10417 Google Scholar
G. Kelloff et al.,
“The progress and promise of molecular imaging probes in oncologic drug development,”
Clin. Cancer Res., 11 7967
–7985
(2005). http://dx.doi.org/10.1158/1078-0432.CCR-05-1302 Google Scholar
T. Massoud and S. Gambhir,
“Molecular imaging in living subjects: seeing fundamental biological processes in a new light,”
Genes Dev., 17 545
–580
(2003). http://dx.doi.org/10.1101/gad.1047403 GEDEEP 0890-9369 Google Scholar
D. W. Townsend et al.,
“PET/CT today and tomorrow,”
J. Nucl. Med., 45 4S
–14S
(2004). JNMEAQ 0161-5505 Google Scholar
B. J. Pichler et al.,
“Performance test of a LSO-APD detector in a 7 Tesla MRI scanner for simultaneous PET-MR imaging,”
J. Nucl. Med., 47
(4), 639
–647
(2006). JNMEAQ 0161-5505 Google Scholar
X. Heng et al.,
“Magnetic-resonance-imaging coupled broadband near-infrared tomography system for small animal brain studies,”
Appl. Opt., 44 2177
–2188
(2005). http://dx.doi.org/10.1364/AO.44.002177 Google Scholar
G. Gulsen et al.,
“Combined diffuse optical tomography (DOT) and MRI system for cancer imaging in small animals,”
Technol. Cancer Res. Treat., 5
(4), 351
–363
(2006). http://dx.doi.org/10.1177/153303460600500407 Google Scholar
R. L. Barbour et al.,
“MRI-guided optical tomography: prospects and computation for a new imaging method,”
IEEE Comput. Sci. Eng., 2 63
–77
(1995). http://dx.doi.org/10.1109/99.476370 ISCEE4 1070-9924 Google Scholar
S. C. Davis et al.,
“Dynamic dual-tracer MRI-guided fluorescence tomography to quantify receptor density in vivo,”
Proc. Natl. Acad. Sci., 110 9025
–9030
(2013). http://dx.doi.org/10.1073/pnas.1213490110 Google Scholar
C. Li et al.,
“Three-dimensional fluorescence optical tomography in small animal imaging using simultaneous positron emission tomography priors,”
Opt. Lett., 34
(19), 2933
–2935
(2009). http://dx.doi.org/10.1364/OL.34.002933 OPLEDP 0146-9592 Google Scholar
R. D. Hoge et al.,
“Simultaneous recording of task-induced changes in blood oxygenation, volume, and flow using diffuse optical imaging and arterial spin-labeling MRI,”
NeuroImage, 25
(9), 701
–707
(2005). http://dx.doi.org/10.1016/j.neuroimage.2004.12.032 NEIMEF 1053-8119 Google Scholar
J. Peter et al.,
“Development and initial results of a tomographic dual-modality positron/optical small animal imager,”
IEEE Trans. Nucl. Sci., 54
(5), 1553
–1560
(2007). http://dx.doi.org/10.1109/TNS.2007.902359 Google Scholar
T. Senkbeil et al.,
“Experimental evaluation of a microlens array based optical detector,”
in Proc. World Molecular Imaging Conf.,
S281
(2009). Google Scholar
V. Hansen, A. Bitz and J. R. Streckert,
“RF exposure of biological systems in radial waveguides,”
IEEE Trans. Electromagn. Compat., 41
(4), 487
–493
(1999). http://dx.doi.org/10.1109/15.809852 IEMCAE 0018-9375 Google Scholar
D. Unholtz et al.,
“Image formation with a micro-lens-based optical detector: a three-dimensional mapping approach,”
Appl. Opt., 48
(10), D273
–D279
(2009). http://dx.doi.org/10.1364/AO.48.00D273 Google Scholar
L. Cao and J. Peter,
“Iterative reconstruction of projection images from a mirco-lens-based optical detector,”
Opt. Express, 19
(13), 11932
–11943
(2011). http://dx.doi.org/10.1364/OE.19.011932 OPEXFF 1094-4087 Google Scholar
C. Collins et al.,
“A method for accurate calculation of fields in three dimensions. Effects of shield geometry on field strength and homogeneity in the birdcage coil,”
J. Magn. Reson., 125
(2), 233
–241
(1997). http://dx.doi.org/10.1006/jmre.1997.1136 Google Scholar
S. C. Davis et al.,
“Magnetic resonance-coupled fluorescence tomography scanner for molecular imaging of tissue,”
Rev. Sci. Instrum., 79 064302
(2008). http://dx.doi.org/10.1063/1.2919131 RSINAK 0034-6748 Google Scholar
J. Peter and W. Semmler,
“Simultaneous BLI-PET imaging with intrinsically fused 2D optical and 3D PET data,”
Eur. J. Nucl. Med., 38
(2011). Google Scholar
C. N. Chen, D. I. Hoult and V. J. Sank,
“Quadrature detection coils-a further improvement in sensitivity,”
J. Magn. Reson., 54
(2), 324
–327
(1983). http://dx.doi.org/10.1016/0022-2364(83)90057-4 Google Scholar
BiographySteffen Paar is a third-year PhD student at the German Cancer Research Center in Heidelberg, Germany. He received his BS and MS degrees in medical engineering in 2010 and 2012, respectively. In 2012, he was awarded a grant of the Helmholtz International Graduate School for his excellent research on plenoptic camera systems. His current research interests include optical engineering, plenoptic camera systems, and magnetic resonance imaging (MRI) technology. |
||||||||||||||||||||||||||||||||||||||||||||||||||||||||||||||||||