
|
|
1.IntroductionMultiple inter-related biophysical skin parameters such as dermal water content and mobility, skin barrier function, and scattering contribute to the overall state of skin moisture,1–4 and these are commonly measured for dermatocosmetic purposes.1,3,5 Evaluations of dermal water content, often carried out through electrical capacitance measurements,6 form an integral part of the analysis because it is the water content of the stratum corneum (SC) layer which allows it to maintain its flexibility, and facilitates the occurrence of certain enzymatic reactions responsible for driving the exfoliation process of the SC and regulating the epidermal barrier function.7 On the other hand, measurements of changes in skin barrier function, usually performed through transepidermal water loss (TEWL) measurements,6 are also essential in dermatocosmetic fields, particularly when determining the efficacy of cosmetic preparations or when investigating barrier impairments caused by certain skin disorders, irritations or dry skin.6,8 However, electrical probe-based devices measure skin hydration indirectly and their readings are susceptible to the influences of ion movement and reorientation of protein dipole moment. Similarly, TEWL measurement cannot be made directly and its relationship with skin barrier function, like that of skin capacitance, is complicated and must be conducted carefully under specific conditions to avoid erroneous results. In addition to their principal drawbacks, both techniques represent their output as a single value, so although their fast operation is beneficial in many settings, such devices are unable to provide further details on additional factors which influence the measured parameters. Alternatively, the potential of using near infrared spectroscopy (NIRS) as a means of assessing SC water content has been reported by many in the literature.9–14 These reports give details on both in vitro and in vivo experiments carried out on porcine and human skin, where acquired spectra, together with chemometric analysis, have highly correlated with reference devices. The potentiality of this technique lies in its ability to detect specific OH and HOH absorption bands related to water, whose intensities can be used to indicate the level of dermal water content.9,10,12,13,15 Skin NIR spectra can also provide information regarding CH and NH bands belonging to protein and lipid skin constituents,9,13 and on the state of various types of water present inside the skin.9–11 Furthermore, it is generally accepted that the depth of light penetration into skin is influenced by the skin’s water content and the wavelength of light.16 This is because increased water content increases the overall absorption of light, and optical properties such as absorption and scattering coefficients and anisotropy parameters are all functions of wavelength.12,16,17 Thus, for a given source of NIR radiation, the two bands of water absorption at 1450 and 1900 nm would have different optical properties, so their measurement depths would differ. More specifically, Arimoto et al.16 reported that the 1450 and 1900 nm absorption bands of water found in skin spectra have different absorption coefficients, and showed that at 1900 nm, the absorption coefficient was higher and resulted in a shorter measurement depth than at the 1450-nm band. Using this information, it can be assumed that changes to skin barrier function can be detected by monitoring differences in absorption at the two bands over time. In a previous study,18 we used principal component analysis (PCA) to demonstrate a clear link between separation and randomization of PCA scores with the frequency of moisturizer application. Additionally, in a pilot study implementing a different protocol,19 similar results were obtained, and the change in absorption intensity at the 1450 and 1900 nm bands prior to and following regular moisturizer application were taken to suggest that long-term moisturizer use had limited water uptake from deeper penetration. To build on this assumption, the latter study was extended to include more subjects and this paper details the methods and results found, which tests the hypothesis that NIRS can provide a range of information on skin changes that possibly include detection of variations in skin barrier function. 2.Materials and MethodsThis study was approved by the Senate Research Ethics committee at City University London prior to performing any measurements on individual(s) or collecting any personal details. 2.1.Experimental Design and Subject CriteriaTwenty healthy volunteers with no history of skin pathology and of various skin complexions were recruited. This group consisted of 9 males and 11 females, ranging between 21 to 42 years of age, and with a mean age of 27.5 years old. All volunteers were asked to refrain from moisturizer use on the starting day of the experiment and had not shaved, waxed, or used laser hair removal at least a week in advance. To begin with, a square area of was drawn on the interior of both forearms of each volunteer to mark the test site as shown in Fig. 1(a). Since volunteers had already refrained from using any product(s) on their forearms on the day attending the experimental session, further skin preparation was not necessary. Baseline measurements were recorded by placing the Corneometer® CM 825 probe on the marked test site of the right forearm, taking three readings from within the marked square area as shown in Fig. 1(b). This was followed by placing the same site under a fiber optic probe clamped onto a stand to allow spectroscopic measurements as illustrated by Figs. 1(c) and 1(d). Again, three spectra were recorded. Fig. 1Images of an enrolled volunteer showing (a) a test site marked with a square area of 25 mm2, (b) the Corneometer® CM 825 probe placed on the test site to acquire skin capacitance measurements, (c) a fiber optic probe clamped in place over the test site for NIR skin measurements and, (d) fiber optic connection to spectrophotometer.  Next, an untreated bandage cloth previously immersed in water was placed on the right forearm test area for 15 min. When this time elapsed, the wet cloth was removed, then the skin was immediately gently patted with paper towel to remove residues on the surface, and the same measurements of skin capacitance and NIR scans were repeated. Moreover, the same procedure was repeated for the second test site on the left forearm, then participants were each given a common moisturizer to use twice a day on one of their forearms for a period of seven days without any other product, while the second forearm was to serve as a control, and so volunteers refrained from applying any moisturizer or oils for the entire study period. Follow-up measurements were performed on the first post-treatment day, and the exact experimental protocol outlined above was repeated. The moisturizer used here was a high-lipid content cream made up of the following ingredients: aqua, paraffinum liquidum, cera microcristallina, glycerin, lanolin alcohol (Eucerit®), paraffin, panthenol, decyl oleate, octyldodecanol, aluminum stearates, citric acid, magnesium sulfate, magnesium stearate, parfum, limonene, geraniol, hydroxycitronellal, linalool, citronellol, benyzl benzoate, cinnamyl alcohol. 2.2.Instrumentation and Data CollectionSkin capacitance measurements were performed using the Corneometer® 825 (Courage-Khazaka electronic GmbH, Koln, Germany) whose output is an arbitrary number deduced by determining the change in the dielectric constant due to skin surface hydration changing the capacitance output. All values obtained were then transferred to Excel (Microsoft Office) for further processing. As for the NIR skin spectra, the same instrumental settings described in our previous publication18 were maintained in order to avoid changes relating to technical differences. NIR spectra obtained were pretreated using the UVWinlab Data Processor and Viewer software (Perkin Elmer Corp, Massachusetts), where smoothing, to absorbance conversion, and standard normal variate (SNV) scatter correction were applied. Further data analysis was finalized using the MATLAB® software (Mathworks Inc., Novi, Michigan), and partial least squares (PLS) analysis was carried out using the PLS-Toolbox (Eigenvector Research Inc, Manson, Washington) MATLAB® extension. 3.ResultsFirst, postprocessed baseline spectra recorded on the 0th and 8th day of the study were examined for changes between the treated and untreated test sites, and are shown in Fig. 2. The graphs of Figs. 2(a) and 2(b) show minor differences occurring in the treated site prior to and after regular moisturization for a period of seven days, as both spectra appear nearly identical with only small differences visible between 1650 and 1750 nm and beyond 1900 nm. The former, which is a site of CH vibrations, was slightly higher after treatment with the cream, whereas for the 1900-nm region and beyond, there was a small shift in the water combination band toward longer wavelengths. The same was true for the untreated test site, although a more considerable decrease was witnessed between 1950 and 2060 nm and a minor decrease in the 1450-nm peak. The shoulder-like character near 2000 nm, indicative of bound water, was also more prominent in the spectrum belonging to the treated site following treatment. The standard deviation of these plots, illustrated by Figs. 2(c) and 2(d), showed that the most significant variations appeared around 1450 nm, 1700 to 1800 nm, 1850 to 1950 nm, which in turn, translate to the water and CH components inside the skin, and are, therefore, the parameters responsible for the variations between the different volunteers and type of treatment. Fig. 2Mean spectra of: (a) and (b) near-infrared apparent absorption of baseline measurements taken from both the treated and untreated forearms on days 0 and 8 of the experiment; (c) and (d) standard deviation plots of the curves in (a) and (b).  To clarify these changes, interdifference spectra were calculated by subtracting each baseline spectrum recorded on day 0 from that recorded on day 8, then calculating the mean spectrum of the matrix. This was carried out on both treated and untreated spectra, and the resulting curves are shown in Fig. 3. Here, a similar trend was evident between the two spectra, but with the spectrum of the untreated site showing on the whole, increased intensity variations and reductions in absorbance. Only a single region near 2000 nm, where the moisturizer-treated difference spectrum shows an increase is contrary to the difference in the untreated site, which continues to decrease, thus confirming changes in the contents of bound water. Moreover, spectra showed a positive divergence throughout the region of 1390 to 1750 nm in the treated site, whereas the untreated site maintained a positive absorbance at around 1480 nm only. Since the 1450-nm water band is in fact influenced by adjacent protein bands at 1400 and 1500 nm resulting from the combination of CH stretching and CH bending modes, and the first overtone, and that the reduction seen for the untreated site was higher around 1770 nm and between 1530 and 1650 nm, this led to the assumption that consistent moisturization had affected the CH bands in skin more so than its water content. Fig. 3Difference in absorption spectra between treated and untreated test sites of baseline measurements.  As for readings obtained using the Corneometer®, average skin capacitance values were calculated for both treated and untreated sites during days 0 and 8, and are shown in the form of a chart in Fig. 4. A Wilcoxon signed-rank test was also performed, and the summary statistics of this test is reported in Table 1. In this case, the results simply showed an increase in skin moisture after using the moisturizer for seven days, and a decrease in skin hydration in the untreated forearm. Nevertheless, the increase in skin moisture at the treated site was more significant (, ) than the decrease in moisture at the untreated site (, ). As for the standard error of the total of measurements taken on days 0 and 8, these were calculated to be 3.14 and 3.22 corneometer values, respectively, and are signified as error bars in Fig. 4. Although their difference is minimal, the standard error of day 8 measurements was, as expected, higher as the consistent use of cream would have resulted in more considerable changes to skin moisture. Fig. 4Chart showing averaged skin capacitance values obtained from measuring the baseline of each volunteer on days 0 and 8 of the experiment.  Table 1Descriptive statistics of baseline corneomter readings.
In addition, it was suggested by Martin11 that moisturizers merely smooth the skin rather than increase its hydration levels, which can often be misinterpreted by certain measuring devices. Therefore, scatter differences in acquired spectra were examined by subtracting each SNV-scatter-corrected absorption spectrum from its respective noncorrected spectrum, then calculating the mean of the final matrix which consisted of 60 spectra so that at the end, this gave a single scatter difference graph. This process was carried out on baseline measurements collected on the 0th and 8th day of the experiment, for both treated and untreated sites, and eventually yielded four spectra (Fig. 5) which describe the residues of scatter correction, i.e., amount of scatter which was removed. The area under curve associated with these plots was also calculated for the treated and untreated sites by calculating the difference in the area under the curve between the treated site at day 0 and at day 8, then repeating this measure for data obtained from the untreated site. The calculations focused on three particular regions which reflected the bands of significance i.e., the 1450, 1700 to 1800, and 1900 nm bands, and the resulting values are shown in Table 2. Fig. 5Amount of scatter removed from absorption spectra of baseline measurements taken from both treated and untreated forearms on days 0 and 8 of the experiment.  Table 2Values of area under the curve calculations of scatter removed from skin spectra using standard normal variate correction.
According to Fig 5, abstinence from moisturizer use had doubtlessly elevated the skin’s scattering property as evident by the considerable increase in the amount of scatter removed from spectra collected off the untreated site on day 8. However, it also appears that the scattering property was nearly unchanged in the treated site, rather than decreased, and even slightly higher around the regions of water absorption bands, but lower in areas where baseline differences are usually observed (below 1400 nm). This was further confirmed by the results of Table 2, which show that the difference in areas under the curve between the scatter difference graph of the treated site at day 0 and the treated site at day 8 was notably less than the area difference between the untreated site at day 0 and the untreated site at day 8, and this was true for all the relevant regions for which the calculations were carried out. Subsequently, changes in skin water mobility in relation to regular moisturizer application were investigated using second derivative spectra. These were calculated using the Savitzky–Golay method and are illustrated by Fig. 6. It can be seen that moisturizer treatment resulted in a slight increase in the 1470-nm water minima, similar to the untreated site, but a decrease was observed around the 1950 nm for both sites, although less so in the treated site. Furthermore, peak shifts were observed in this latter region where regular moisturizer use caused this peak to shift from 1952 to 1948 nm, and from 1954 to 1948 nm for the untreated site. According to the literature,13,17 peak shifts toward shorter wavelengths at this band is characteristic of increased water mobility and a marker of increased water contents. Therefore, the results suggest that water mobility was enhanced in both examination sites, but were less in minima height in relation to spectra recorded on day 0, and whereas the untreated site expressed a slightly longer shift, water minima from the treated site remained larger still. Fig. 6Second derivative baseline spectra recorded on the 0th and 8th day of the experiment from both (a) treated and (b) untreated test sites.  The same process was repeated on spectra acquired after placing the wet patch in order to investigate whether changes in skin barrier function due to moisturization can be detected through NIR spectra. Figure 7 shows the resulting derivatized spectra of this process. The mean spectra of both sites collected on day 0 were roughly equal at the minima equivalent of the 1450-nm water absorption band (around 1460/1470-nm) and only marginally different at the 1950-nm minima equivalent of the 1940-nm water combination band. However, those representing spectra collected on day 8 showed an opposing behavior, where the untreated site from day 8 expressed higher absorbance at the 1450-nm band reciprocal and less at the 1950-nm minima, whereas the treated site contradicted this and instead, expressed less absorption at the 1460-nm minima and a higher one at the 1950-nm minima. Fig. 7Second derivative spectra recorded on the 0th and 8th day of the experiment from both (a) treated and (b) untreated test sites after placing a wet patch for 15 min.  This follows in line with previously reported results18 as the same trend was witnessed here, regardless of the differing experimental design. So once again, as it is presumed that the light beam of the spectrophotometer would have traveled deeper into the skin at the shorter wavelength, i.e., at 1450-nm, and it can be suggested now that for the untreated site, water absorbed from the wet patch had traveled deeper into the skin, whereas for the treated forearm, water absorption remained at a more superficial skin level. In support of this assumption, skin capacitance values recorded from the wet patch test were evaluated and are displayed in Fig. 8, along with the standard error bars of measurements recorded on both examination days. A Wilcoxon signed-rank test was also carried out and the resulting descriptive statistics are reported in Table 3. The average corneometer value for the treated site was 57.18 and 55.27, for days 0 and 8, respectively, and 55.87 and 53.33 for the untreated site. In both testing sites, an estimated decline of two points occurred from the initial measurement, with a divergence of two corneometer values between the treated and untreated sites on both testing occasions. These differences are noticeably small and moreover, an insignificant relationship was found between the corneometer values recorded on days 0 and 8 at the treated site (, ), as well as at the untreated site (, ). Thus, the changes in water uptake following placement of the wet patch on both sites and on both days were negligible. Since changes in corneometer readings do not relate to or indicate changes in the amount of water uptake, it can be further suspected that variations observed in NIR spectra relate to changes in the attributes of water uptake by the skin or to its composition. Fig. 8Skin capacitance readings taking after placing a wet patch on the skin for both the treated and untreated forearms on both the 0th and 8th day of the experiment. 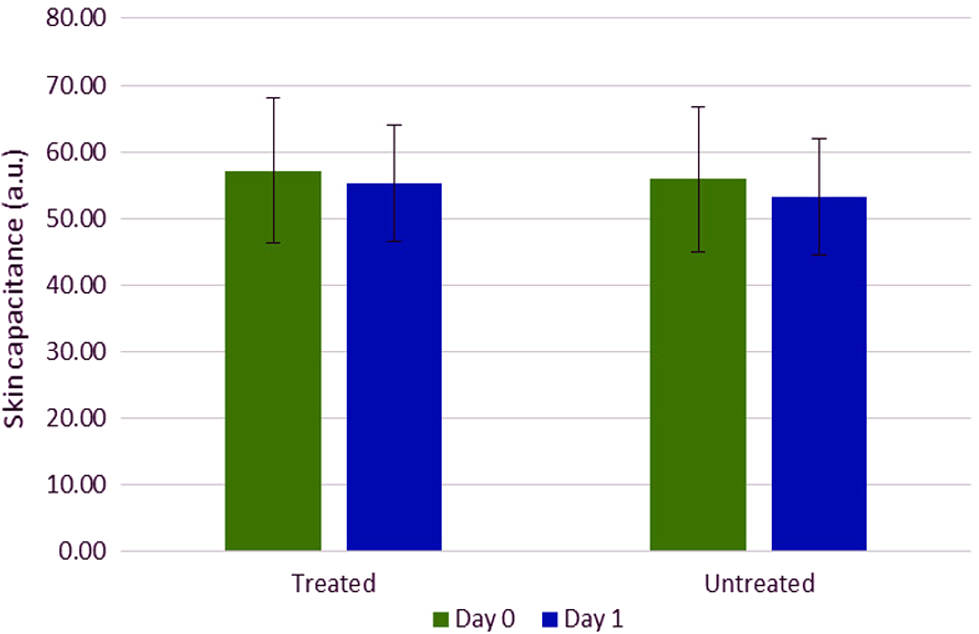 Table 3Descriptive statistics of corneometer measurements recorded after performing the wet patch test.
Furthermore, to examine the underlying relationship between skin capacitance and spectroscopic data as well as explore the possibility of predicting skin moisture, a PLS calibration model was created using all the averaged corneometer values and spectra collected. For NIR spectra, second derivatives were used in the range of 2100 to 1300 nm, after applying Savitzky–Golay filtering of the 2nd polynomial order and using a filtering width of 15 points. The resulting model, composed of two LVs, explained 77.83% of the total spectral variation and 83.56% of the total variation in skin capacitance readings. Two versions of the noncross validated calibration graph of this model have been included, one with the samples colored according to their -residual values (Fig. 9) and the second, colored by each sample’s value (Fig. 10), with a color scale to aid interpretation. The graph in Fig. 9 estimates the capability of the model to predict future values, thus in this case, it can be seen that most samples were positioned close to the calibration line and were, therefore, predicted reasonably well by the model. However, results from the treated site obtained on day 8 after the wet patch test were an exception to this, being located the furthest from the line and displaying the highest -residual value. Fig. 9Noncross validated calibration graphs colored by each sample’s -residual value. Samples are baseline measurements of treated and untreated sites on day 0 (Tr0_B and Untr0_B) and on day 8 (Tr8_B and Untr_B), and water test measurements of treated and untreated sites on day 0 (Tr0_W and Untr0_W) and on day 8 (Tr8_W and Untr_W).  Fig. 10Noncross validated calibration graphs colored by each sample’s value. Samples are baseline measurements of treated and untreated sites on day 0 (Tr0_B and Untr0_B) and on day 8 (Tr8_B and Untr_B), and water test measurements of treated and untreated sites on day 0 (Tr0_W and Untr0_W) and on day 8 (Tr8_W and Untr_W). 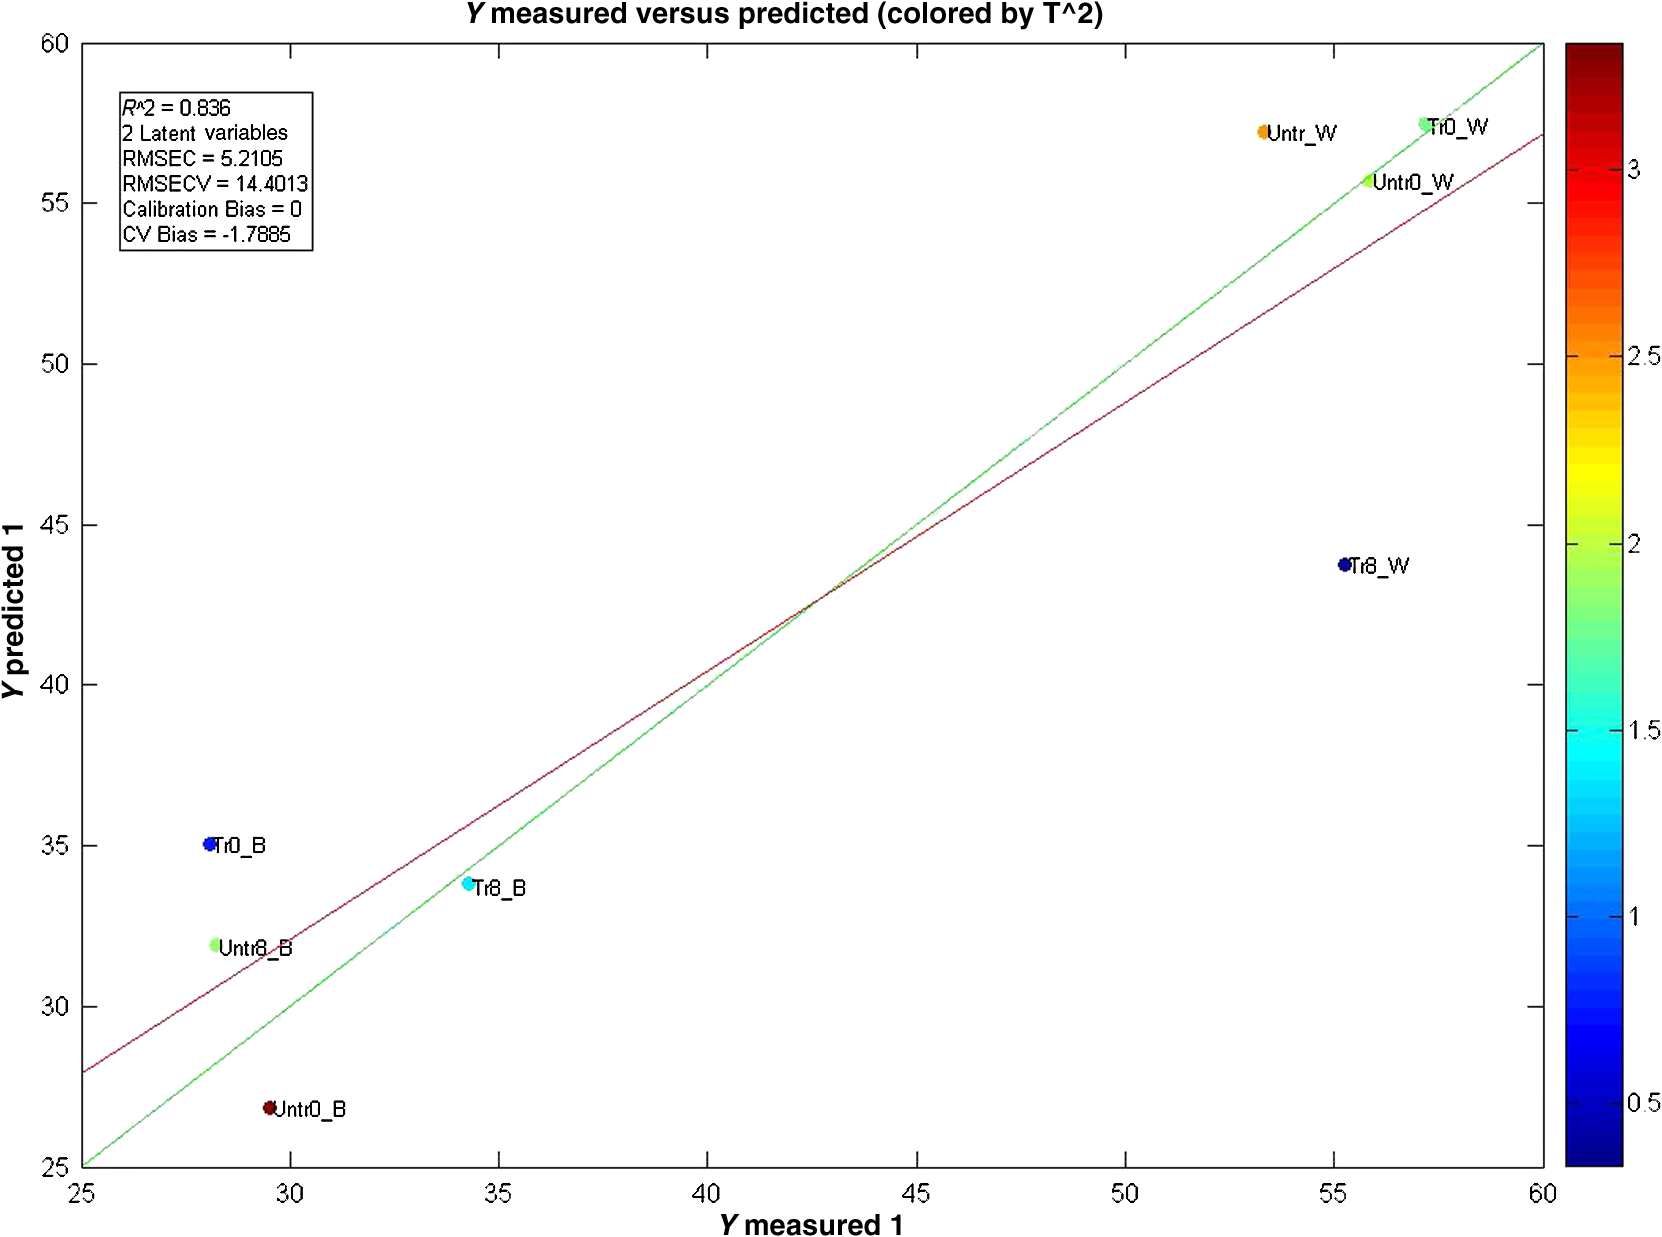 Here, the -residual describes the magnitude of the variation remaining in each sample after projection through the model, whereas the Hotelling’s represents a measure of the variation in each sample within the model. As a result, the calibration graph colored by each sample’s -residual value (Fig. 9) showed that data from the untreated site generally had lower -residuals, thus their remaining variation varied less. On the contrary, the calibration graph colored by each sample’s (Fig. 10) showed that results from the treated site had lower Hotelling distribution values, so their respective samples exhibited fewer variations within the model. As mentioned earlier, the generated model explained a total of 77.83% and 83.56% of the total spectral and capacitance variations. More specifically, the first and second latent variables (LV 1 and LV 2) explained 31.88% and 45.95% of the spectral variations, which in turn, proportionally described 56.89% and 26.67% of the variations in corneometer readings, respectively. The projection of scores for this model can be seen in Fig. 11, and the loadings plot in Fig. 12. Fig. 11Scores plot of the PLS calibration model. Samples are baseline measurements of treated and untreated sites on day 0 (Tr0_B and Untr0_B) and on day 8 (Tr8_B and Untr_B), and water test measurements of treated and untreated sites on day 0 (Tr0_W and Untr0_W) and on day 8 (Tr8_W and Untr_W). 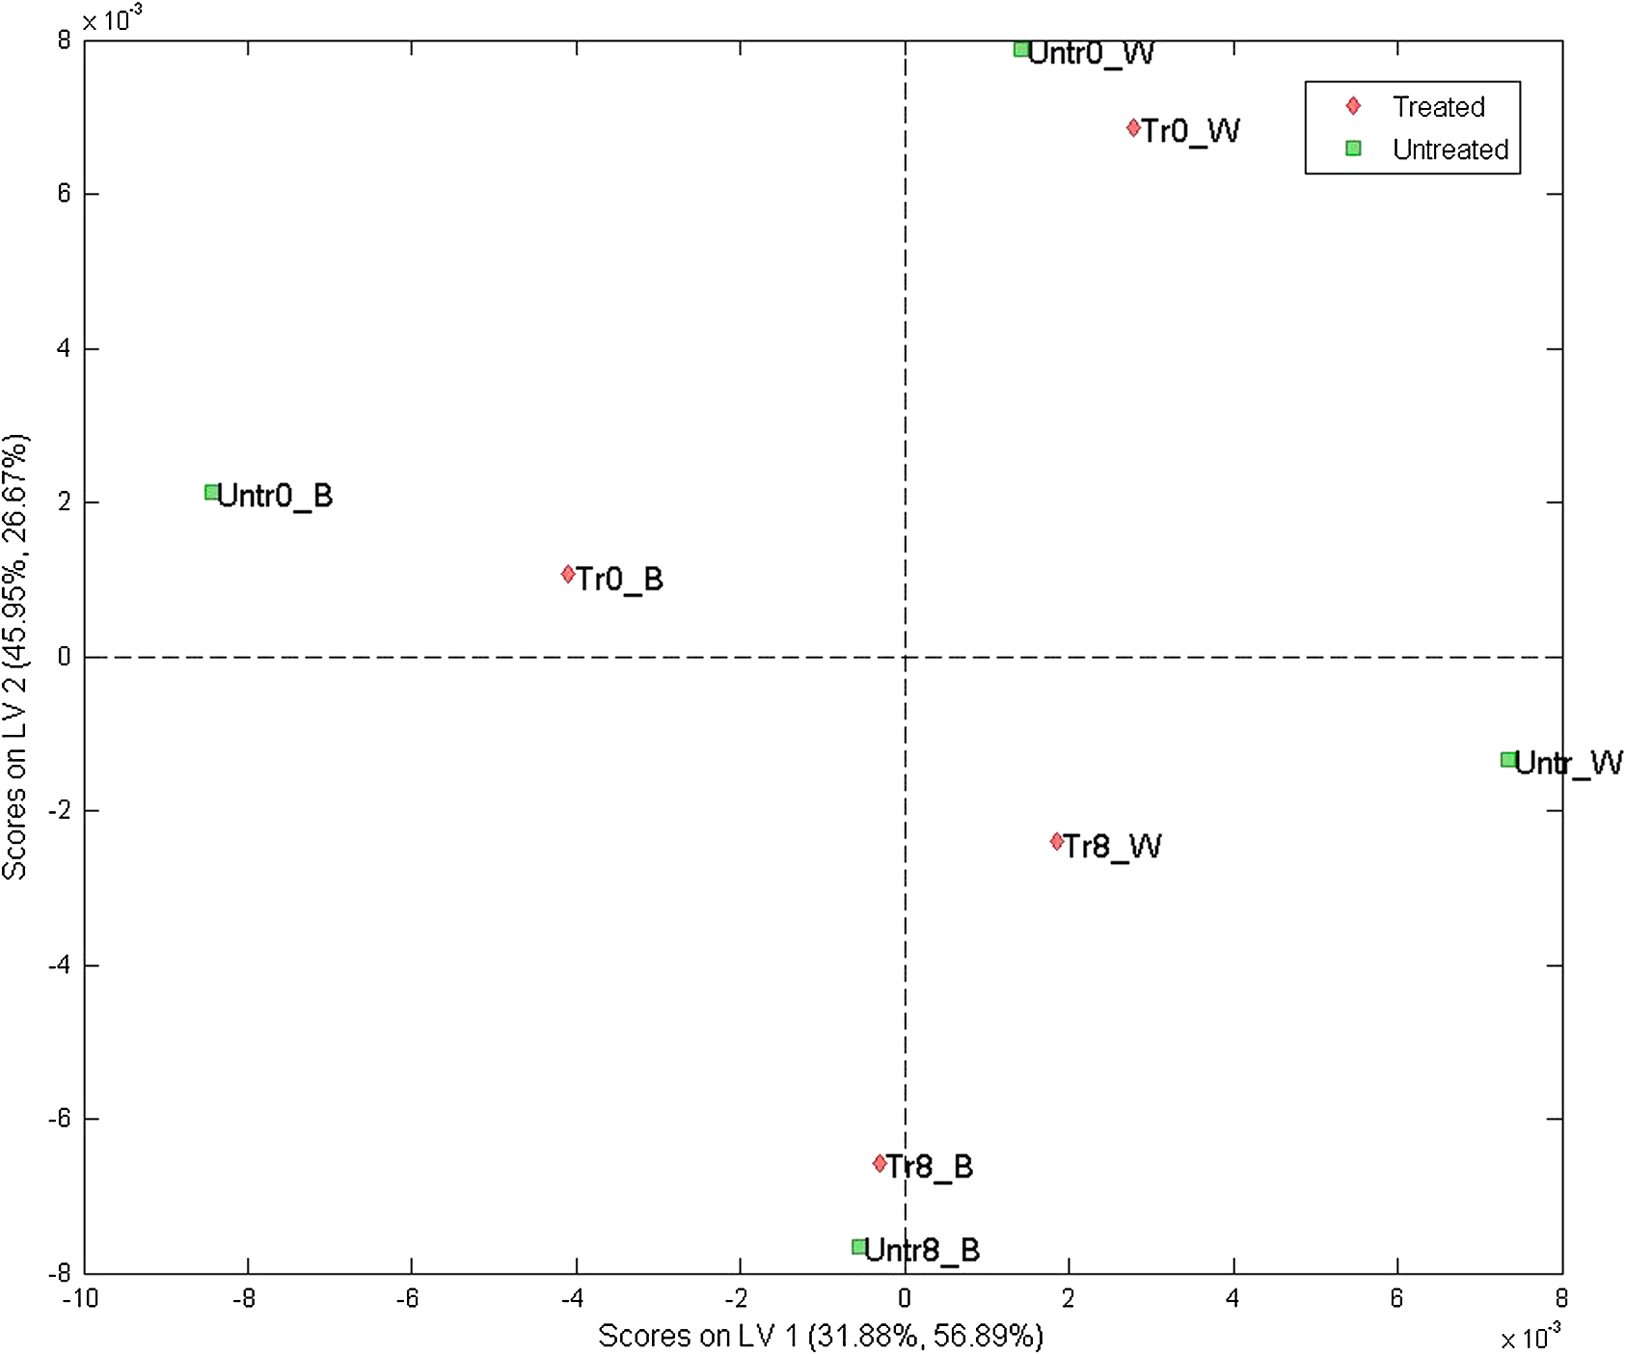 According to the scores plot, samples from the treated site displayed a closer relationship among each other in comparison to the untreated site, as these were further apart. Interestingly though, the position of each treated sample’s score was nearest to its corresponding sample from the untreated set, so that the day and test parameter performed seemed to be more influential factors. As for the loadings plot, it can be seen that most variables were located in the center of this plot, without an obvious trend distinguished with regards to the main absorption bands of water. 4.Discussion and ConclusionsA previously reported pilot study was extended in order to investigate the possibility of detecting changes in skin barrier function using NIR spectra. The study also investigated the effects of regular moisturization on healthy skin and the effects of short term direct water contact in relation to moisturizer application. The study was carried out in vivo where a group of volunteers were each given a high-lipid content cream to apply regularly for a period of seven days on one forearm whereas the other remained untreated. NIR and capacitance were then acquired prior to and after this treatment period and analyzed. Upon processing of data, corneometer baseline readings simply showed an increase in skin moisture after treatment with the cream for seven days, and decrements in the untreated site. In contrast, NIR spectra indicated more considerable differences occurring between 1650 and 1750 nm and from 1900 nm and beyond, suggesting that moisturizer use had mainly affected the CH and NH groups in skin in correlation to water bands. Considering the 1900-nm region alone, as this is a more suitable indicator of the state of water inside the skin, corneometer results simply showed a decrease in skin capacitance with abstinence of moisturizer use whereas on the other hand, NIR results also confirmed this with a lessening of the 1900-nm peak/minima height, but further implied that water mobility had increased in both sites. NIR spectra also confirmed a smoothing function as a consequence of regular moisturization, formerly proposed by Martin.11 This was evident in scatter difference graphs and area under the curve calculations, where large increases in scatter were seen in the untreated site after eight days, while the treated site expressed the least scatter in areas where skin spectra commonly show spectral baseline fluctuations. In addition, second derivative spectra displayed an intriguing pattern between abstinence and frequent use of moisturizers which was also evident in our previous report,18 where a different protocol and subject criteria were enforced. For the untreated site, a lower intensity was observed at the 1940-nm water equivalent minima, but a higher one at the 1450-nm equivalent minima, while the opposite was true for the treated site. Since previous studies12 have shown that measurement depths of NIR light are largely dependent on water absorption, and that higher water absorption led to shorter light pathlengths, the beam would have traveled deeper into the skin at the shorter wavelength. Based on this, it is assumed here that long-term moisturizer application limited the water from penetrating deeper into the skin, and that a higher concentration of the water absorbed remained at more superficial levels of the skin. In turn, the opposite was true for the untreated site or nonusers of creams, thus water was able to travel into deeper skin layers. This was verified with corneometer values confirming negligible changes in skin hydration following application of the wet patch on both testing occasions and both testing sites. In further support to our previous study where PCA scores showed that randomization and separation between individuals increased uniformly with decreased moisturizer application, PLS analysis from this study also showed regular moisturization to be an apparent influential factor as the sample scores were closest for data obtained from the treated test site, as opposed to those of the untreated site which were more remote from each other. To conclude, these results highlight the potential of NIRS in skin analysis, as such spectra can provide valuable information not only on skin water contents but perhaps on other skin parameters such as skin barrier function. ReferencesS. Verdier-Sevrain and F. Bonte,
“Skin hydration: a review on its molecular mechanisms,”
J. Cosmet. Dermatol., 6
(2), 75
–82
(2007). http://dx.doi.org/10.1111/j.1473-2165.2007.00300.x Google Scholar
C. L. Silva et al.,
“Stratum corneum hydration: phase transformations and mobility in stratum corneum, extracted lipids and isolated corneocytes,”
Biochim. Biophys. Acta Biomembr., 1768
(11), 2647
–2659
(2007). http://dx.doi.org/10.1016/j.bbamem.2007.05.028 Google Scholar
E. Proksch, J. M. Brandner and J.-M. Jensen,
“The skin: an indispensable barrier,”
Exp. Dermatol., 17
(12), 1063
–1072
(2008). http://dx.doi.org/10.1111/j.1600-0625.2008.00786.x EXDEEY 0906-6705 Google Scholar
W. Manuskiatti, D. A. Schwindt and H. I. Maibach,
“Influence of age, anatomic site and race on skin roughness and scaliness,”
Dermatol. Basel Switz., 196
(4), 401
–407
(1998). http://dx.doi.org/10.1159/000017932 Google Scholar
J. W. Fluhr et al., Bioengineering of the Skin: Water and the Stratum Corneum, 2nd ed.CRC Press, Boca Raton
(2004). Google Scholar
J. du Plessis et al.,
“International guidelines for the in vivo assessment of skin properties in non-clinical settings: part 2. Transepidermal water loss and skin hydration,”
Skin Res. Technol., 19
(3), 265
–278
(2013). http://dx.doi.org/10.1111/srt.12037 Google Scholar
A. V. Rawlings and J. J. Leyden, Skin Moisturization, 2nd ed.Informa Healthcare, New York
(2009). Google Scholar
J. Pinnagoda et al.,
“Guidelines for transepidermal water loss (TEWL) measurement. A report from the Standardization Group of the European Society of Contact Dermatitis,”
Contact Dermatitis, 22
(3), 164
–178
(1990). http://dx.doi.org/10.1111/j.1600-0536.1990.tb01553.x CODEDG 0105-1873 Google Scholar
P. L. Walling and J. M. Dabney,
“Moisture in skin by near-infrared reflectance spectroscopy,”
J. Soc. Cosmet. Chem., 40
(3), 151
–171
(1989). Google Scholar
K. A. Martin,
“Direct measurement of moisture in skin by NIR spectroscopy,”
J. Soc. Cosmet. Chem., 44 249
–261
(1993). Google Scholar
K. Martin,
“In vivo measurements of water in skin by near-infrared reflectance,”
Appl. Spectrosc., 52
(7), 1001
–1007
(1998). http://dx.doi.org/10.1366/0003702981944652 APSPA4 0003-7028 Google Scholar
H. Arimoto and M. Egawa,
“Non-contact skin moisture measurement based on near-infrared spectroscopy,”
Appl. Spectrosc., 58
(12), 1439
–1446
(2004). http://dx.doi.org/10.1366/0003702042641218 APSPA4 0003-7028 Google Scholar
M. Egawa,
“In vivo simultaneous measurement of urea and water in the human stratum corneum by diffuse-reflectance near-infrared spectroscopy,”
Skin Res. Technol., 15
(9), 195
–199
(2009). http://dx.doi.org/10.1111/j.1600-0846.2009.00353.x Google Scholar
A. F. Omar, M. Z. MatJafri,
“Optical fiber near infrared spectroscopy for skin moisture measurement,”
Selected Topics on Optical Fiber Technology, 229
–246 InTech, Rijeka, Croatia
(2012). http://dx.doi.org/10.5772/26420 Google Scholar
H. Arimoto and M. Egawa,
“Skin moisture measurement based on near-infrared spectroscopy and regression analysis,”
in Proc. 25th Annual Int. Conf. of the IEEE Engineering in Medicine and Biology Society,
3438
–3441
(2003). Google Scholar
H. Arimoto, M. Egawa and Y. Yamada,
“Depth profile of diffuse reflectance near-infrared spectroscopy for measurement of water content in skin,”
Skin Res. Technol., 11
(1), 27
–35
(2005). Google Scholar
M. Egawa et al.,
“Regional difference of water content in human skin studied by diffuse-reflectance near-infrared spectroscopy: consideration of measurement depth,”
Appl. Spectrosc., 60
(1), 24
–28
(2006). http://dx.doi.org/10.1366/000370206775382866 APSPA4 0003-7028 Google Scholar
M. Qassem and P. Kyriacou,
“Use of reflectance near-infrared spectroscopy to investigate the effects of daily moisturizer application on skin optical response and barrier function,”
J. Biomed. Opt., 19
(8), 087007
(2014). http://dx.doi.org/10.1117/1.JBO.19.8.087007 JBOPFO 1083-3668 Google Scholar
M. Qassem and P. A. Kyriacou,
“Investigating skin barrier function utilizing reflectance NIR spectroscopy,”
in 2014 36th Annual Int. Conf. of the IEEE Engineering in Medicine and Biology Society (EMBC),
3735
–3738
(2014). Google Scholar
BiographyMeha Qassem is a postdoctoral research assistant in the Biomedical Engineering Research Centre at City University London. Her main research interests are in the area of spectrophotometric and spectroscopic analysis, and in the development and application of instrumentation and sensors for diagnostic or therapeutic purposes. Panayiotis A. Kyriacou is a professor of biomedical engineering, associate dean for research and enterprise at City University London, and director of the Biomedical Engineering Research Centre. His main research activities are primarily focused upon the understanding, development and applications of instrumentation, sensors, and physiological measurement to facilitate the prognosis, diagnosis, and treatment of disease or the rehabilitation of patients. |
|||||||||||||||||||||||||||||||||||||||||||||||||||||||||||||||||||||||||||||||||||||||||||||||||||||||||||||||


