

|
|
1.IntroductionMultiphoton nonlinear imaging microscopies can perform noninvasive and three-dimensional (3-D) deep tissue imaging with subcellular resolution using tightly focused femtosecond pulses. They provide better axial resolution and improved signal-to-background ratios (SBRs) than standard laser scanning fluorescence microscopy.1–3 Specifically, two-photon microscopy (TPM) with near-infrared (NIR) excitation is advantageous for deep-tissue imaging because (1) NIR light can excite natural fluorophores in tissue, (2) intrinsic 3-D sectioning is possible with the confined fluorescence generation in the focal volume, and (3) imaging resolution is negligibly degraded from scattering because fluorescence generation in the focal volume is dominated by ballistic photons.4–6 Unfortunately, this technique still has several limitations when it comes to deep-tissue imaging, including potential in-focus cell damage and multiphoton phototoxicity due to high optical intensities.7,8 Crucially, there is a fundamental limit to the maximum imaging depth due to gradually increasing out-of-focus (background) fluorescence signal when increasing imaging depth to compensate for the losses due to scattering. Thus, the maximum imaging depth reaches a fundamental limit when the background generated close to the surface equals the signal arising from the focal volume. This maximum imaging depth was found to be dependent on the tissue optical properties as well as its homogeneity.5 Previous studies, including ours, showed that the maximum imaging depth for TPM around 800-nm excitation wavelengths is restricted to three to five scattering lengths depending on tissue types.4–6,9,10 In recent years, there have been very promising studies to enhance the maximum imaging depth for multiphoton microscopy techniques. For example, the TPM maximum imaging depth was increased 1.4 times by performing multiphoton activation of photoactivatable fluorophores (PAFs) in tissue phantoms labeled with either a synthetic caged fluorescein dye or genetically encodable PAFs.11 In this study, multiphoton activation switched on a higher percentage of PAFs at the focus than those out-of-focus, which were originally in the dark state. Then, another multiphoton activation was performed to bring these bright-state PAFs to fluorescent state, which happened at a higher probability at the focus leading to a significantly reduced background fluorescence. Another study related to reducing background fluorescence signal introduced the theoretical analysis and numerical simulations to switch the two-photon excited fluorescence on and off at the focus by using stimulated emission reduced fluorescence microscopy.12 In that study, they combined continuous wave stimulated emission (SE) beam collinearly with two-photon excitation beam and detected both fluorescence signals generated with and without SE. By subtracting the fluorescence signal without SE from that with SE, they could obtain the fluorescence signal mainly generated in the focus. The numerical simulations estimated that the imaging depth can be improved as much as 1.8 times compared to original two-photon fluorescence imaging in brain tissues; this improvement is still to be proven experimentally. More recently, by implementing longer excitation wavelengths to reduce scattering lengths and utilizing three-photon processes to reduce the probability of background signal generation, deeper imaging depths have been successfully shown. For example, applying TPM at an excitation wavelength of 1280 nm approximately doubled the imaging depth of fluorescently labeled blood vessels in a mouse brain compared to shorter excitation wavelengths of 775 nm.13 In another study, the same group has demonstrated in vivo three-photon microscopy in a mouse brain at 1675-nm wavelength to enhance the maximum imaging depth by a factor of 1.8 compared to two-photon microscopy at 775 nm,14 reaching an imaging depth of 1.3 mm. Considering their estimate of the effective attenuation length of brain (300 to ), their normalized imaging depth corresponds to 3.5 to 4.5. Improving the maximum imaging depth by using a longer excitation wavelength can also be achieved by utilizing other nonlinear imaging techniques, such as second- and third-harmonic generation (SHG and THG) microscopies. These techniques in principle deposit no energy on the tissue sample and, thus, reduce the probability of phototoxicity.15,16 SHG necessitates intense femtosecond laser pulses passing through a highly polarizable material with a noncentrosymmetric molecular organization like collagen fibers.15 THG, on the other hand, can apply to all molecules wherein three photons at the fundamental frequency are converted to a photon at the third harmonic frequency. The signal intensity in THG is very sensitive to index of refraction and third-order susceptibility () changes.17,18 Previous related research has shown different applications of THG, like imaging neurons and their processes,16,19 lipid bodies in plant seeds and Drosophila embryos,20 zebrafish embryo and larvae,21,22 cardiomyocytes,23 elastin and collagen fibers,24,25 malaria parasites,26 myelin in the vertebrate central nervous system,27 and human cornea.28 The use of endogenous THG for imaging is critical in applications where the external fluorophores may be deemed invasive and toxic. Thanks to the reduced probability of three-photon absorption in the out-of-focus volume, reduced scattering probability of longer excitation wavelengths, and no energy deposition on the sample, THG microscopy can also improve the maximum imaging depth in turbid tissues remarkably. While THG microscopy has been shown to image the whole thickness of the transparent zebrafish embryo21 and external capsule of mouse brain at the depth of ,14 highly scattering tissue samples, such as hamster cheek pouch,29 fixed human skin,30 mouse muscles,31 and mouse skin,24 could be imaged to a maximum depth of between 100 and . The corresponding normalized imaging depths in these studies reached up to 4.5, indicating that there is still room for improvement to enable imaging at the theoretically expected maximum imaging depths. The aim of this work is, therefore, to show THG imaging at the maximum imaging depth in a highly scattering tissue. Specifically, a 1552-nm excitation wavelength was used and the results showed THG images three times deeper as compared to TPM at 776-nm wavelength. To achieve the ultimate maximum imaging depths, the imaging conditions were carefully designed and a home-built system with optimized collection efficiency was used. Based on a novel ablation-based method we previously developed,10 tissue optical properties were measured and then performed analytical and Monte Carlo modeling of maximum imaging depths. More importantly, to avoid tissue heating during deep tissue imaging at 1552 nm, we analyzed the heating properties of tissue and estimated the depth-resolved temperature distribution by utilizing numerical and experimental techniques. There is a practical importance for using a high-repetition rate, high-power femtosecond fiber laser32,33 for THG imaging because they can also provide enough pulse energies and average powers for high-speed laser surgery in clinical applications as our group has previously demonstrated for the treatment of vocal fold scarring.10,34,35 Overall, this work illustrates how THG microscopy at 1552-nm excitation wavelength can be used as a new imaging modality to perform deep-tissue imaging in highly turbid tissue, like scarred vocal folds, with the capability of guiding precise laser microsurgery. 2.Methods and Materials2.1.Experimental SetupA home-built, inverted laser scanning microscope was used to perform TPM and THG microscopies [Fig. 1(a)]. The excitation laser was a femtosecond Er-doped fiber laser (Discovery, Raydiance Inc.) with 3-W average power at 1552 nm ( pulse energy) and 1 W when frequency doubled to 776 nm ( pulse energy) at 2 MHz with 600-fs pulse width. The laser beam was focused with a 0.75 NA, air objective (Nikon Plan Apo). We measured the spot size by imaging 100-nm-diameter polystyrene beads (Invitrogen, F8803) embedded in agar gel at depths varying from 50 to . The agar-bead phantom consisted of of the stock bead solution (2% solids) dispersed in 2 ml of 4% agar in water, which was then allowed to gel. This protocol resulted in a bead concentration of , which was estimated to yield an scattering length at 776 nm excitation wavelength, consistent with the effective scattering lengths expected from the lamina propria (LP) of our samples. The average lateral full-width half-maximum (FWHM) of the two-photon point spread function (PSF) was and three-photon FWHM of the PSF was . These resolutions correspond to a and diameter of the intensity distribution at 776 and 1552 nm, respectively. Fig. 1Schematic of the inverted microscope system for nonlinear imaging and ablation. (a) Femtosecond laser pulses were obtained from a compact fiber laser system at the fundamental wavelength (1552 nm) and passed through an energy attenuator consisting of a half-wave plate () and polarizing cube beam splitter (PCBS). Frequency doubled pulses (776 nm) were achieved using a beta barium borate crystal. Both beams were scanned by a pair of galvanometric scanning mirrors (SM), which was then imaged on the back aperture of a 0.75 NA, objective by a pair of a scan lens (SL) and a tube lens (TL). The samples were placed on a three-axis motorized stage (P280, Nanocube, PI) for nonlinear imaging. Emitted light was collected by a dichroic mirror (DM), collection optics (CO), laser blocking filters (Edmund Optics, 84-650 for THG imaging, or Semrock, FF01-750/SP-25 for TPM imaging), and either a THG filter (Chroma, HQ515/15M) or a TPM filter (Schott, BG38) into the photomultiplier tube (PMT) (H10770 PA-40, Hamamatsu). (b) The slopes of signal intensities versus imaging power verified the order of the nonlinear processes for both TPM and THG imaging on a log-log scale plot.  To satisfy the Nyquist criterion for both TPM and THG, a pixel size of was used corresponding to half of the resolution of TPM (). The laser beam was scanned in the and axes using a pair of galvanometric mirrors (Cambridge Technologies, Inc.) and sweeping the focal spot over a field of view for 3.3 s for both modalities to obtain an image of pixels. The resulting number of pixels corresponded to 2 and 3 pulses/pixel/raw image for TPM and THG imaging, respectively. We collected and averaged 10 images at each plane. A dichroic mirror (Semrock, FF735-Di01) was used to transmit the excitation light to the sample and reflect the emitted signal from the sample to the collection optics. A photomultiplier tube (PMT) (Hamamatsu, H10770 PA-40) collected the signal via collection optics, laser blocking filters (Edmund Optics, 84-650 for THG imaging, or Semrock, FF01-750/SP-25 for TPM imaging), and emission filters (Chroma, HQ515/15M for THG imaging and Schott, BG38 for TPM imaging). The computer software (MPScan) reconstructed these signals into pixel images at a frame rate of 3.05 Hz.36 The order of nonlinear processes was characterized by measuring the detected signal on the PMT while increasing laser power delivered to the sample. As shown in Fig. 1(b), the slope of the PMT signal versus imaging power curve yielded and on a log-log scale for THG and TPM, respectively. As expected, these results confirmed that THG and TPM imaging were second- and third-order nonlinear processes. 2.2.Ex Vivo Tissue PreparationThe LP of porcine vocal folds has been previously studied and was found to be most similar to the human LP in terms of their elastin and collagen distribution.37,38 Our previous study also showed that superior porcine vocal folds have a fiber structure similar to human vocal folds as compared to inferior porcine vocal folds at the depths we are interested in.10 Thus, it was decided to use freshly excised superior porcine vocal folds in the present experiments. Fresh porcine airway specimens were acquired from a local slaughterhouse and the larynx was isolated in a room temperature saline bath within 2 h of sacrificing the animal. After excision, the vocal folds were placed in saline solution and covered with a glass cover slip to flatten their upper surface. In a clinical application, the glass cover slip would be akin to the window of a microsurgery probe in contact with the sample, thus maintaining a constant depth of ablation. Short-lived autofluorescence of fresh tissue samples and fluorescence beads helped identifying the surface of the sample during TPM imaging. For THG imaging, high contrast at the air and glass interface allowed to identify the tissue surface easily. 3.Results and DiscussionThe clinical challenge addressed in our studies is related to vocal fold scarring. This is one of the major causes of voice disorders and may arise from overuse or postsurgical wound healing. One promising treatment uses the injection of soft biomaterials aimed at restoring viscoelasticity of the outermost vibratory layer of the vocal fold, superficial lamina propria (SLP). A common unsolved problem facing the surgical use of injectable materials is its accurate and effective placement in a superficial plane in scarred vocal folds.39 In recent experiments, we successfully achieved biomaterial localization by ablating such subepithelial voids deep in the SLP of a porcine vocal fold.40 However, the maximum imaging depth was limited to between 100 and deep in the tissue with two-photon autofluorescence and SHG microscopies. To guide such a high-precision microsurgery in different layers of SLP, there is a need for high-resolution imaging deep inside the vocal folds for both locating the scarred tissue and assessing the efficacy of ablation below the epithelium. Therefore, this paper presents the investigation of THG microscopy characteristics to image deeper in ex vivo porcine vocal folds using the fundamental wavelength (1552 nm) of the same high repetition rate fiber laser as used for microsurgery. 3.1.Extinction Properties of TissueTo determine extinction properties of fresh porcine vocal folds at both excitation wavelengths (776 and 1552 nm), a novel ablation-based method was used that we developed in recent work.10 In this method, ablations are performed at three different depths below the epithelium in the SLP (72, 90, and ) and the minimum pulse energy required to initiate ablation () is found at each depth. For these ablation measurements, the laser is used at 303-kHz repetition rate. Beer’s law can be applied for each ablation depth, , which was chosen to be below the measured epithelium thickness as where is the unknown ablation threshold fluence of SLP, is the measured pulse energy at the tissue surface, is the measured radius of the laser beam at the focal plane, is the unknown epithelium extinction length, and is the unknown SLP extinction length. By solving three equations applied for each ablation depth, the three unknowns can be determined: , , and . The effective extinction length of tissue, , at the maximum imaging depth, , can then be deduced from Eq. (2) by replacing with as follows:For 776-nm excitation wavelength, the tissue extinction length is equal to the scattering length because of the negligible tissue absorption. However, the absorption is considerable at 1552 nm. To identify the scattering and absorption components of the extinction length at 1552 nm, the scattering length is first estimated using the following empirical correlation for fibrous soft tissues:41 The resulting scattering length was at 1552-nm wavelength according to Eq. (4) and the absorption length could then be deduced as . Several studies have found that the absorption length in pure water is to at 1552-nm wavelength.42,43 To verify these numbers, the absorption length of distilled water was also measured by focusing 1552-nm laser light in different depths and measuring the minimum pulse energy that creates bubble formation at the focal plane. By applying the method described above, this study determined the absorption length at 1552-nm wavelength to be in agreement with the literature. Thus, we believe that these tissue experimental results represent relevant numbers for vocal folds, and the small difference in the values of absorption lengths between water and vocal folds can be attributed to the vocal fold constituents such as collagen, elastin, and hyaluronic acid in addition to water. These values were used in the Monte Carlo and heat transfer simulations. The summary of all extinction lengths, which were generally in agreement with the values reported in the literature41,44 for both excitation wavelengths, are tabulated in Table 1. Table 1Summary of measured tissue optical properties at 776- and 1552-nm excitation wavelengths. Extinction lengths for epithelium (ℓext,ep) and lamina propria (ℓext,LP) at the maximum imaging depths for two-photon and third-harmonic generation imaging at the corresponding wavelengths. The effective scattering (ℓsca) and absorption lengths (ℓsca,eff) at the maximum imaging depths (zm) are also presented. Standard deviations are included for each parameter as derived from the variations in the measured epithelial thickness.
3.2.Maximum Imaging DepthAn excised fresh superior porcine vocal fold was imaged using both TPM and THG imaging to compare their maximum imaging depths at 776- and 1552-nm excitation wavelengths, respectively (Fig. 2). The tissue surface was identified by the presence of externally applied fluorescent beads in TPM and by the presence of large signal contrast at the interface between the tissue surface and the glass cover in THG. The depth at which collagen fibers first appeared varied between the locations of imaging, ranging from 40 to below the surface. As the imaging depth was increased, TPM and THG signals were detected originating from different tissue components, which helped to differentiate epithelium and SLP. For instance, TPM at 776-nm excitation wavelength could detect nicotinamide adenine dinucleotide phosphate and flavins in the epithelium,3 and collagen and elastin fibers in the SLP45,46 [Fig. 2(b)]. On the other hand, THG allowed to image epithelial cells and ECM fibers in superior porcine vocal folds. The THG signal originated from the index of refraction changes, geometric shape of scatterers, and third-order susceptibility differences inside the tissue [Fig. 2(a)]. Comparison between the nonlinear images of a superior porcine vocal fold clearly showed that THG at a longer wavelength (1552 nm) qualitatively improved the maximum imaging depth substantially. At the maximal imaging depths, the applied maximum imaging power was 10 and 55 mW for TPM and THG, respectively. Fig. 2Representative nonlinear optical images of a fresh superior porcine vocal fold. (a) Images of THG showing clear collagen features beyond using imaging powers in the range of 50 mW. (b) Images of combined TPM and second-harmonic generation indicating maximum imaging depths limited to below . The scale bar represents .  To quantitatively analyze the maximum imaging depths, we analyzed how the SBR varied with imaging depth (Fig. 3). The SBR was calculated by selecting a line of pixels across resolvable features at different locations in each image using Image J software. These resolvable features were either epithelial cells in the epithelium or extracellular matrix fibers in the SLP. Then, the ratio was determined of maximum signal intensity to the average of 10 pixels on the right and left tail of the of the maximum signal intensity. The SBR for each imaging modality is presented with respect to the imaging depth on a semilog plot in Fig. 3(a). The maximum imaging depth, , was defined as the depth where the SBR fell to 1. In addition, SBR was plotted against imaging depth normalized with tissue extinction length, [Fig. 3(b)]. Fig. 3Signal-to-background ratio (SBR) values for both nonlinear imaging modalities: (a) SBR with respect to imaging depth, , and (b) SBR with respect to normalized imaging depth, .  Figure 3(a) quantitatively shows that THG imaging provided three times deeper imaging, increasing the imaging depth from (TPM at 776 nm) to (THG at 1552 nm). Figure 3(b) also shows that SBR became one at normalized imaging depths of approximately four and seven extinction lengths for the TPM and THG imaging modalities, respectively. Such improvement of nondimensional depths ( times) was a direct result of the reduced probability for out-of-focus generation in three-photon process as well as the reduced absorption of the signal generated at longer wavelengths. Overall, both longer excitation and emission wavelengths and three-photon processes had improved the maximum imaging depth for THG microscopy at 1552-nm excitation wavelength. This maximum imaging depth improvement reveals a potential application in imaging scarred human vocal folds, which have thicker epithelium compared to porcine vocal folds. 3.3.Analytical and Monte Carlo Modeling of Maximum Imaging DepthsTo model the maximum imaging depths, analytical and Monte Carlo methods used previously by our group were used for varying extinction lengths and inhomogeneities ()5. Assuming the concentration of fluorophores within focal volume is constant, , and that the out-of-focus fluorophore concentration is diffuse enough to be approximated by the average fluorophore concentration, , was defined as the ratio of to . A range of values (10, 25, 62, and 300) has been chosen in the simulations to broadly represent various tissue types. The experimental results, represented within the circles with dashed lines in Fig. 4, are based on the experimental extinction lengths and normalized imaging depths. Interestingly, the value of 32, which was extracted from the THG images in Fig. 2, is in agreement with the values of 25 to 62 present within the circle that represents the THG experimental results [Fig. 4(b)]. Fig. 4Analytical and numerical modeling of maximum imaging depths: (a) for TPM at 776-nm excitation and 515-nm emission wavelengths and (b) for THG at 1550-nm excitation and 515-nm emission wavelengths. The maximum imaging depths were calculated as a function of the effective extinction length () and for different tissue inhomogeneities (). The extinction length varied for different scattering lengths representing different tissue types and assuming a negligible absorption length at 776 nm and at . THG results were presented for extinction lengths smaller than , corresponding to a maximum scattering length of (expected values for brain tissue at 1552 nm). Cross marks represent Monte Carlo simulation results and circles with dashed lines represent the approximate range of our experimental results. 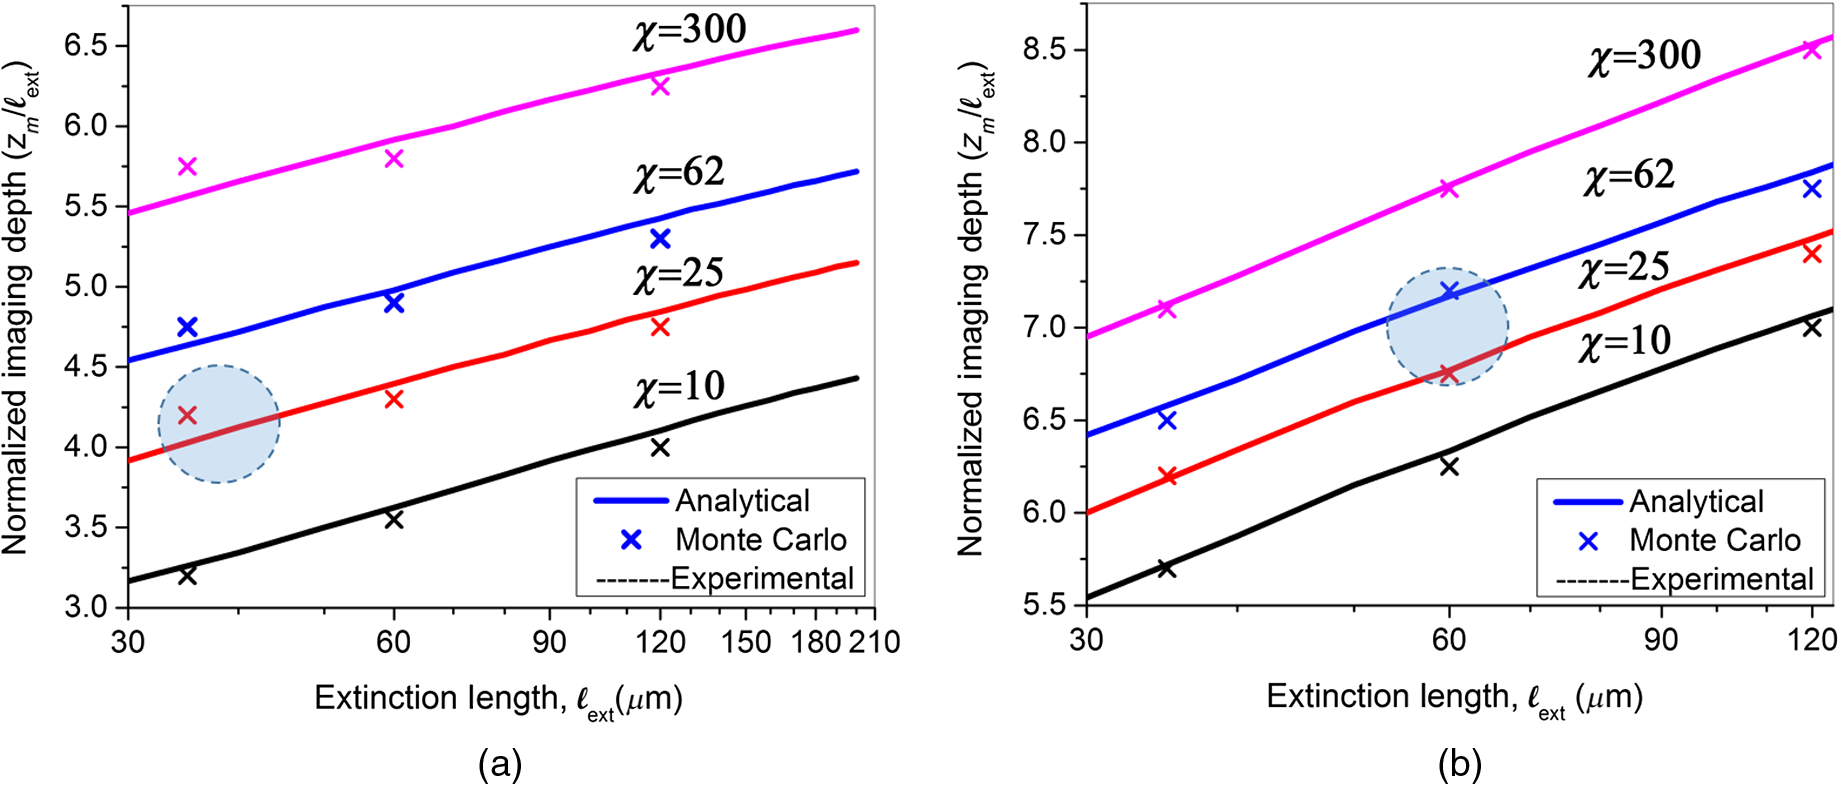 This study adapted the analytical method developed by Theer and Denk6 to calculate the ballistic and scattered light distributions in turbid media, which were then combined to obtain the total fluorescence distribution with depth. The intensity for ballistic photons was assumed to have Gaussian spatial and temporal distributions. Monte Carlo simulations were used to simulate photon transport in the tissue with an anisotropy factor of by separately modeling the excitation and emission phenomena. Simulations calculated the spatiotemporal distribution of the intensities ( and ) and the spatial dependence of collection efficiency. The image contrast could then be calculated as the ratio of the signal in the focal volume to the background. The maximum imaging depth was defined as the depth at which the image contrast fell to 1. In the case of THG, the emitted photons were directed forward, unlike the two-photon autofluorescence process where emission was assumed to be isotropic.47,48 Figure 4 presents the results from Monte Carlo simulations and analytical calculations for different extinction lengths. For TPM imaging, normalized imaging depth had a logarithmic dependence on extinction length, as expected according to the Beer-Lambert’s law [Fig. 4(a)]. Monte Carlo simulations correlated well with the analytical calculations. The normalized imaging depth was estimated to be between four and five extinction lengths for a range of 25 to 62 for the range of scattering lengths expected in tissues (which is equal to extinction since absorption is minimal at 776 nm). These calculations were consistent with the experimental results shown in dashed circular box in Fig. 4(a). Similar to the TPM case, normalized maximum imaging depth in THG microscopy also exhibited a logarithmic dependence on extinction length and increased with the increase in for all extinction lengths [Fig. 4(b)]. The measured extinction length in the experiments was and the corresponding maximum imaging depth was estimated to be in the range of 7.0 extinction lengths. This result closely matched the simulated results for a range of 25 to 62. Another important conclusion drawn from Fig. 4(b) was that THG microscopy improved maximum imaging depth approximately two times compared to TPM microscopy at the same extinction lengths for all inhomogeneity values. This conclusion could be attributed to the effect of three-photon processes on reducing background signal and thus increasing SBR value. 3.4.Tissue Heating Properties During Third-Harmonic Generation ImagingTo avoid thermal damage during THG imaging, the heating properties of tissue were investigated by measuring tissue surface temperature using an infrared thermal camera (FLIR, A325SC). Heat transfer simulations also were performed to predict the temperature distribution below the surface. To keep the field of view clear for the thermal camera’s view, the laser light was focused on tissue surface using a long working distance objective (Nikon, Plan Apo, , 0.3 NA) for surface temperature measurements. From these surface temperature measurements, the study first characterized thermal relaxation time of the tissue, , defined as the time that the temperature dropped to of its maximum value after the laser was shut down. Knowledge of this parameter enabled to perform THG imaging without causing substantial heating of tissue by blocking the laser between different imaging planes for the duration of the characteristic cooling times. The thermal relaxation time of the bulk tissue was measured for different laser excitation conditions where the tissue was juxtaposed against a cover glass, and the laser was scanned for 4 s while being focused at the maximum imaging depth of within the tissue. The measured temperature distribution for a single imaging session [Fig. 5(a)] showed a maximum temperature increase of 1 to 6°C as the imaging power was increased from 120 to 480 mW. The thermal relaxation times (), tabulated in Table 2, varied only slightly around 15 s, which were in the range of the values cited in the literature for various tissue types.44,49 The average value was also in agreement with an estimated value of 14 s that could be obtained using the simplified expression for relaxation time where is the tissue density, is the specific heat of the tissue, is the area of the spot size, is the volume of the laser spot, and is the convective heat transfer coefficient of ambient air.Fig. 5Tissue surface temperature measurement using an IR camera. (a) Measurement of tissue surface temperature to calculate tissue relaxation time for three imaging powers applied for the duration of 4 s at the maximum imaging depth of . (b) Comparison of measured surface temperature evolution with our heat transfer simulation results and the laser power used at a given depth. Experimental results correlated well with the experiments for a thermal relaxation constant of 15 s. The laser was focused inside tissue using a long working objective lens to clear the imaging path for the IR camera.  Table 2Tissue thermal relaxation times (τ) for exposure to different average powers (Pave).
Since the maximum temperature was expected to be close to the focal volume below the surface where the temperature could not be measured, heat transfer simulations were performed to estimate the depth-resolved temperature distribution. The numerical analysis first calculated the intensity distribution inside the tissue by using the transient radiative transport equation (RTE).50,51 It then calculated the temperature distribution by coupling Pennes energy equation with a non-Fourier damped heat conduction equation. 50,51 It has been previously shown that the non-Fourier hyperbolic heat conduction model was a more accurate model since it takes into account the relaxation time of the tissues. In addition, the Fourier parabolic heat conduction model is found to deviate significantly from experimental measurements while studying heat transfer phenomenon for time scales shorter than thermal relation time of the medium.44 To validate the numerical results, we measured the evolution of surface temperatures and imaging power over the duration of a depth-resolved THG imaging [Fig. 5(b)]. To avoid heating the tissue, the laser was blocked in between different imaging planes (separated by steps) for two thermal relaxation time periods (30 s). The measured surface temperature distribution correlated best with the numerical temperature distribution assuming a 15-s thermal relaxation time in agreement with the measured data. The corresponding results indicated that the maximum surface temperature did not exceed 32°C, representing only a 5.5°C increase from the initial room temperature. These results were obtained with a long working distance objective for an average excitation power ranging from 1 mW at the surface up to 100 mW at the maximum imaging depth of . This result verified both the experimental and numerical methods to determine depth-resolved tissue temperature distribution for THG imaging. After this verification, numerical analysis was applied for a typical 3-D THG imaging where the high NA objective (0.75 NA, , Nikon) was used and the excitation power was varied with depth as indicated in Fig. 2. The estimated surface temperature and imaging power over the duration of this experiment are shown in Fig. 6(a). Figure 6(b) represents estimated depth-resolved temperature distribution. A maximum temperature increase of occurred at the maximum imaging depth of , where imaging power was maximum (55 mW). This temperature increase was not deemed detrimental to the tissue constituents.52,53 This temperature model was based on linear absorption. To elucidate the effect of nonlinear absorption on the transient temperature evolution at the focus, the models of Vogel and his colleagues were used.54 This nonlinear absorption analysis resulted in temperature increase for both a single pulse and series of pulses. Thus, nonlinear absorption was safely neglected in the presented thermal model. This result showed how accurately one can control temperature increase by measuring the thermal relaxation time and manipulating the laser shuttering time in THG imaging. Fig. 6Dynamics of tissue temperature during typical THG imaging conditions. (a) The evolution of the surface temperature and imaging power as we image deeper into tissue. (b) Axial distribution of tissue temperature as modeled using a 15-s time constant. The maximum temperature increase was observed at the central line of the focal plane at the maximum imaging depth () with maximum imaging power (55 mW) and was . (c) Tissue focal plan temperature and experimental duration versus interval time between consecutive THG imaging with a 0.75-NA objective lens.  Finally, the maximum temperature was estimated inside the tissue at the focal plane for different designated periods of time between consecutive imaging planes separated by steps [Fig. 6(c)]. An interval time of 30 s (twice the thermal relaxation time) indeed provides an optimized condition from the point of view of both experimental duration and temperature increase in the focal plane. For these conditions, the experimental duration is and maximum temperature increase is . 4.DiscussionOverall, the heat transfer simulations concluded that the imaging at 1552 nm requires special attention to choosing the correct time interval between different imaging planes in order to avoid heating damage to tissue. With appropriate management of tissue heating, it is possible to image the tissue of interest down to its theoretical maximum imaging depth of . In principle, it should be possible to avoid heating during continuous imaging by using a laser with shorter pulses and/or lower repetition rates. To understand this approach, it is necessary to analyze the relationship between parameters affecting the time-averaged signal generation in three-photon-based microscopy techniques given as27 Here, represents generated nonlinear signal intensity, is the average laser power, is the pulse width, is the repetition rate of the laser, NA is the numerical aperture of the objective, and is the excitation wavelength. It is evident from this equation that can be kept low by either increasing the objective NA or/and decreasing and . Considering the experimental conditions (, , and effective ), the maximum imaging power could be reduced by about three times by decreasing to . The second parameter to consider would be the NA of the focusing objective. Since water absorption at this wavelength is high, it was not feasible to utilize a water dipping lens. Thus, air objective lens with the highest NA possible (0.75 NA) was the only option for deep imaging using 1552 nm. Increasing the NA could have provided a remarkable reduction in average powers used. The third option to avoid heating would be to reduce the repetition rate. On one hand, is required to be high enough ( levels) to provide fast imaging speeds (at least 1 fps) for realistic clinical applications; on the other hand, decreasing would reduce tissue heating. For example, reducing the repetition rate from 2 MHz, the maximum available repetition rate with our fiber laser, to 300 kHz would reduce the required by 3.5 times. Indeed, when THG imaging was tested at 300-kHz repetition rate where the pulse duration of the laser changed to 1.5 ps, about half of the average power was needed to obtain THG images, consistent with the expected relationship given in Eq. (6). However, while reduced average power reduced tissue heating effects, the increase in high peak intensities started initiating optical breakdown in tissue as we imaged deeper. A quick calculation showed that at depths of , the fluence at the focal plane could reach at low repetition rates, causing tissue ablation. A 2-MHz repetition rate was thus chosen for the imaging conditions while cooling in between the imaging planes to avoid tissue heating. A similar phenomena was also observed in a recent study, where THG was used to image myelin in mouse using a 1045-nm laser.27 The study found that the maximum imaging depth in their excitation wavelength was limited to less than two scattering lengths, 50 to deep in the tissue. Due to the very short, highly absorbed, UV emission wavelengths (350 nm), even at these shallow imaging depths, high laser powers (25 to 50 mW) were required to generate enough THG signal, causing either nonlinear optical breakdown or tissue heating depending on the chosen repetition rate of the laser. In conclusion, as with all nonlinear imaging modalities, in THG microscopy, it is especially important to understand how to optimize laser and optical parameters, such as average power, pulse width, repetition rate, numerical aperture, and excitation wavelength to optimize maximum imaging depth while avoiding damage to tissue. Even though excitation wavelength of 1552 nm shows strong tissue absorption, by carefully choosing the imaging parameters, one can perform deep tissue imaging without causing any thermal damage to tissue. Of course, one can avoid with strong water absorption to avoid tissue heating all together and emit photons in the visible range to have remarkable collection efficiency. Thus, either 1.3-, 1.4-, or wavelength range could be a good fit for this purpose. In terms of repetition rate, should be high enough to provide reasonable frame rate () while providing large THG signal for a given average power.27 Finally, the pulse width should be tuned to the regime to avoid thermal damage and optical breakdown during imaging. 5.ConclusionsThe primary goal of this work was to understand the maximum imaging depths attainable with THG microscopy in turbid tissues such as vocal folds compared to two-photon autofluorescence microscopies. The experimental results revealed that maximum imaging depth improved significantly from 140 to using THG microscopy at 1552-nm excitation wavelength as compared to TPM at 776 nm. This maximum imaging depth improvement was a direct result of the increased total extinction length arising from using a longer-wavelength and reduced out-of-focus signal resulting from exploiting a third-order process. Another important contribution of this study was to understand how to avoid thermal heating during THG imaging at 1552-nm excitation wavelength. By performing surface temperature measurements, optimizing the repetition rate of the laser, and modeling tissue temperature as a function of depth, tissue heating was avoided. The thermal relaxation time of tissue was characterized with different imaging powers and this relaxation time was utilized to estimate the depth-resolved temperature distribution. The experimental and theoretical thermal relaxation times () correlated well with each other, implying that the optical and thermal tissue properties used were accurate. Then, a numerical algorithm was developed where the intensity distribution inside the tissue was determined by RTE and the temperature distribution estimated by coupling the Pennes bioheat equation with a non-Fourier damped heat conduction equation. By shuttering the laser beam for 30 s between consecutive imaging planes, heating was avoided and a maximum temperature increase of was kept inside the tissue. Such temperature control avoided thermal damage to the tissue, which made THG imaging at 1552-nm wavelength safe to use. Overall, with effective thermal management, the threefold improvement in maximum imaging depth presented here will guide development of turn-key femtosecond fiber laser assisted treatment methods for subepithelial image guided surgeries, similar to the proposed scarred vocal folds treatments currently under development in our lab. AcknowledgmentsThis work was supported by grants from the National Science Foundation (IDR: CBET-1014953 and Career Award: CBET-0846868) and Cancer Prevention Research Institute of Texas (CPRIT RP130412). The authors would like to thank Raydiance Inc., for the use of their Discovery femtosecond fiber laser, Kaushik Subramanian for editing the manuscript and fruitful discussions, and Dr. David Kleinfeld and his research group for the use of the MPScan software. ReferencesG. S. He et al.,
“Observation of stimulated emission by direct three-photon excitation,”
Nature, 415
(6873), 767
–770
(2002). http://dx.doi.org/10.1038/415767a Google Scholar
S. W. Hell et al.,
“Three-photon excitation in fluorescence microscopy,”
J. Biomed. Opt., 1
(1), 71
–74
(1996). http://dx.doi.org/10.1117/12.229062 JBOPFO 1083-3668 Google Scholar
W. R. Zipfel, R.M. Williams and W.W. Webb,
“Nonlinear magic: multiphoton microscopy in the biosciences,”
Nat. Biotechnol., 21
(11), 1369
–1377
(2003). http://dx.doi.org/10.1038/nbt899 NABIF9 1087-0156 Google Scholar
E. Beaurepaire, M. Oheim and J. Mertz,
“Ultra-deep two-photon fluorescence excitation in turbid media,”
Opt. Commun., 188
(1), 25
–29
(2001). http://dx.doi.org/10.1016/S0030-4018(00)01156-1 OPCOB8 0030-4018 Google Scholar
N. J. Durr et al.,
“Maximum imaging depth of two-photon autofluorescence microscopy in epithelial tissues,”
J. Biomed. Opt., 16
(2), 026008
(2011). http://dx.doi.org/10.1117/1.3548646 JBOPFO 1083-3668 Google Scholar
P. Theer and W. Denk,
“On the fundamental imaging-depth limit in two-photon microscopy,”
J. Opt. Soc. Am. A Opt. Image Sci. Vis., 23
(12), 3139
–3149
(2006). http://dx.doi.org/10.1364/JOSAA.23.003139 Google Scholar
H. J. Koester et al.,
“ fluorescence imaging with pico- and femtosecond two-photon excitation: signal and photodamage,”
Biophys. J., 77
(4), 2226
–2236
(1999). http://dx.doi.org/10.1016/S0006-3495(99)77063-3 BIOJAU 0006-3495 Google Scholar
K. Konig et al.,
“Cell damage by near-IR microbeams,”
Nature, 377
(6544), 20
–21
(1995). http://dx.doi.org/10.1038/377020a0 Google Scholar
A. Leray et al.,
“Spatially distributed two-photon excitation fluorescence in scattering media: experiments and time-resolved Monte Carlo simulations,”
Opt. Commun., 272
(1), 269
–278
(2007). http://dx.doi.org/10.1016/j.optcom.2006.11.007 OPCOB8 0030-4018 Google Scholar
M. Yildirim et al.,
“Parameters affecting ultrafast laser microsurgery of subepithelial voids for scar treatment in vocal folds,”
J. Biomed. Opt., 18
(11), 118001
(2013). http://dx.doi.org/10.1117/1.JBO.18.11.118001 JBOPFO 1083-3668 Google Scholar
Z. Chen et al.,
“Extending the fundamental imaging-depth limit of multi-photon microscopy by imaging with photo-activatable fluorophores,”
Opt. Express, 20
(17), 18525
–18536
(2012). http://dx.doi.org/10.1364/OE.20.018525 OPEXFF 1094-4087 Google Scholar
L. Wei, Z. Chen and W. Min,
“Stimulated emission reduced fluorescence microscopy: a concept for extending the fundamental depth limit of two-photon fluorescence imaging,”
Biomed. Opt. Express, 3
(6), 1465
–1475
(2012). http://dx.doi.org/10.1364/BOE.3.001465 BOEICL 2156-7085 Google Scholar
D. Kobat et al.,
“Deep tissue multiphoton microscopy using longer wavelength excitation,”
Opt. Express, 17
(16), 13354
–13364
(2009). http://dx.doi.org/10.1364/OE.17.013354 OPEXFF 1094-4087 Google Scholar
N. G. Horton et al.,
“In vivo three-photon microscopy of subcortical structures within an intact mouse brain,”
Nat. Photonics, 7
(3), 205
–209
(2013). http://dx.doi.org/10.1038/nphoton.2012.336 NPAHBY 1749-4885 Google Scholar
P. J. Campagnola and L.M. Loew,
“Second-harmonic imaging microscopy for visualizing biomolecular arrays in cells, tissues and organisms,”
Nat. Biotechnol., 21
(11), 1356
–1360
(2003). http://dx.doi.org/10.1038/nbt894 NABIF9 1087-0156 Google Scholar
D. Yelin and Y. Silberberg,
“Laser scanning third-harmonic-generation microscopy in biology,”
Opt. Express, 5
(8), 169
–175
(1999). http://dx.doi.org/10.1364/OE.5.000169 OPEXFF 1094-4087 Google Scholar
Y. Barad et al.,
“Nonlinear scanning laser microscopy by third harmonic generation,”
Appl. Phys. Lett., 70
(8), 922
–924
(1997). http://dx.doi.org/10.1063/1.118442 APPLAB 0003-6951 Google Scholar
M. Muller et al.,
“3D microscopy of transparent objects using third-harmonic generation,”
J. Microsc., 191
(3), 266
–274
(1998). http://dx.doi.org/10.1046/j.1365-2818.1998.00399.x JMICAR 0022-2720 Google Scholar
E. J. Gualda et al.,
“In vivo imaging of neurodegeneration in Caenorhabditis elegans by third harmonic generation microscopy,”
J. Microsc., 232
(2), 270
–275
(2008). http://dx.doi.org/10.1111/j.1365-2818.2008.02098.x JMICAR 0022-2720 Google Scholar
D. Debarre et al.,
“Imaging lipid bodies in cells and tissues using third-harmonic generation microscopy,”
Nat. Methods, 3
(1), 47
–53
(2006). http://dx.doi.org/10.1038/nmeth813 1548-7091 Google Scholar
S. W. Chu et al.,
“In vivo developmental biology study using noninvasive multi-harmonic generation microscopy,”
Opt. Express, 11
(23), 3093
–3099
(2003). http://dx.doi.org/10.1364/OE.11.003093 OPEXFF 1094-4087 Google Scholar
C. K. Sun et al.,
“Higher harmonic generation microscopy for developmental biology,”
J. Struct. Biol., 147
(1), 19
–30
(2004). http://dx.doi.org/10.1016/j.jsb.2003.10.017 JSBIEM 1047-8477 Google Scholar
V. Barzda et al.,
“Visualization of mitochondria in cardiomyocytes by simultaneous harmonic generation and fluorescence microscopy,”
Opt. Express, 13
(20), 8263
–8276
(2005). http://dx.doi.org/10.1364/OPEX.13.008263 OPEXFF 1094-4087 Google Scholar
C. K. Sun et al.,
“Multiharmonic-generation biopsy of skin,”
Opt. Lett., 28
(24), 2488
–2490
(2003). http://dx.doi.org/10.1364/OL.28.002488 OPLEDP 0146-9592 Google Scholar
C. K. Sun et al.,
“In vivo and ex vivo imaging of intra-tissue elastic fibers using third-harmonic-generation microscopy,”
Opt. Express, 15
(18), 11167
–11177
(2007). http://dx.doi.org/10.1364/OE.15.011167 OPEXFF 1094-4087 Google Scholar
J. M. Belisle et al.,
“Sensitive detection of malaria infection by third harmonic generation imaging,”
Biophys. J., 94
(4), L26
–L28
(2008). http://dx.doi.org/10.1529/biophysj.107.125443 BIOJAU 0006-3495 Google Scholar
M. J. Farrar et al.,
“In vivo imaging of myelin in the vertebrate central nervous system using third harmonic generation microscopy,”
Biophys. J., 100
(5), 1362
–1371
(2011). http://dx.doi.org/10.1016/j.bpj.2011.01.031 BIOJAU 0006-3495 Google Scholar
N. Olivier et al.,
“Harmonic microscopy of isotropic and anisotropic microstructure of the human cornea,”
Opt. Express, 18
(5), 5028
–5040
(2010). http://dx.doi.org/10.1364/OE.18.005028 OPEXFF 1094-4087 Google Scholar
S. P. Tai et al.,
“In vivo optical biopsy of hamster oral cavity with epi-third-harmonic-generation microscopy,”
Opt. Express, 14
(13), 6178
–6187
(2006). http://dx.doi.org/10.1364/OE.14.006178 OPEXFF 1094-4087 Google Scholar
S. P. Tai et al.,
“Optical biopsy of fixed human skin with backward-collected optical harmonics signals,”
Opt. Express, 13
(20), 8231
–8242
(2005). http://dx.doi.org/10.1364/OPEX.13.008231 OPEXFF 1094-4087 Google Scholar
M. Rehberg et al.,
“Label-free 3D visualization of cellular and tissue structures in intact muscle with second and third harmonic generation microscopy,”
PLoS One, 6
(11), e28237
(2011). http://dx.doi.org/10.1371/journal.pone.0028237 POLNCL 1932-6203 Google Scholar
M. E. Fermann and I. Hartl,
“Ultrafast fibre lasers,”
Nat. Photonics, 7
(11), 868
–874
(2013). http://dx.doi.org/10.1038/nphoton.2013.280 NPAHBY 1749-4885 Google Scholar
C. Jauregui, J. Limpert and A. Tunnermann,
“High-power fibre lasers,”
Nat. Photonics, 7
(11), 861
–867
(2013). http://dx.doi.org/10.1038/nphoton.2013.273 NPAHBY 1749-4885 Google Scholar
O. Ferhanoglu et al.,
“A 5-mm piezo-scanning fiber device for high speed ultrafast laser microsurgery,”
Biomed. Opt. Express, 5
(7), 2023
–2036
(2014). http://dx.doi.org/10.1364/BOE.5.002023 BOEICL 2156-7085 Google Scholar
C. L. Hoy et al.,
“Towards endoscopic ultrafast laser microsurgery of vocal folds,”
J. Biomed. Opt., 17
(3), 038002
(2012). http://dx.doi.org/10.1117/1.JBO.17.3.038002 JBOPFO 1083-3668 Google Scholar
Q. T. Nguyen, P. S. Tsai and D. Kleinfeld,
“MPScope: a versatile software suite for multiphoton microscopy,”
J. Neurosci. Methods, 156
(1–2), 351
–359
(2006). http://dx.doi.org/10.1016/j.jneumeth.2006.03.001 JNMEDT 0165-0270 Google Scholar
M. S. Hahn et al.,
“Quantitative and comparative studies of the vocal fold extracellular matrix. I: elastic fibers and hyaluronic acid,”
Ann. Otol. Rhinol. Laryngol., 115
(2), 156
–164
(2006). http://dx.doi.org/10.1177/000348940611500213 AORHA2 0003-4894 Google Scholar
M. S. Hahn et al.,
“Quantitative and comparative studies of the vocal fold extracellular matrix II: collagen,”
Ann. Otol. Rhinol. Laryngol., 115
(3), 225
–232
(2006). http://dx.doi.org/10.1177/000348940611500311 AORHA2 0003-4894 Google Scholar
S. M. Zeitels et al.,
“Foresight in laryngology and laryngeal surgery: a 2020 vision,”
Ann. Otol. Rhinol. Laryngol. Suppl., 198 2
–16
(2007). http://dx.doi.org/10.1177/000348940711600901 Google Scholar
C. L. Hoy et al.,
“Clinical ultrafast laser surgery: recent advances and future directions,”
IEEE J. Sel. Topics Quantum Electron., 20
(2), 242
(2014). http://dx.doi.org/10.1109/JSTQE.2013.2287098 IJSQEN 1077-260X Google Scholar
S. L. Jacques,
“Optical properties of biological tissues: a review,”
Phys. Med. Biol., 58
(11), R37
–R61
(2013). http://dx.doi.org/10.1088/0031-9155/58/11/R37 PHMBA7 0031-9155 Google Scholar
D. J. Segelstein,
“The complex refractive index of water,”
University of Missouri-Kansas City,
(1981). Google Scholar
S. G. Warren,
“Optical constants of ice from the ultraviolet to the microwave,”
Appl. Opt., 23
(8), 1206
–1225
(1984). http://dx.doi.org/10.1364/AO.23.001206 APOPAI 0003-6935 Google Scholar
M. Jaunich et al.,
“Bio-heat transfer analysis during short pulse laser irradiation of tissues,”
Int. J. Heat Mass Transf., 51
(23), 5511
–5521
(2008). http://dx.doi.org/10.1016/j.ijheatmasstransfer.2008.04.033 Google Scholar
P. J. Campagnola et al.,
“Three-dimensional high-resolution second-harmonic generation imaging of endogenous structural proteins in biological tissues,”
Biophys. J., 82
(1 Pt 1), 493
–508
(2002). http://dx.doi.org/10.1016/S0006-3495(02)75414-3 BIOJAU 0006-3495 Google Scholar
W. R. Zipfel et al.,
“Live tissue intrinsic emission microscopy using multiphoton-excited native fluorescence and second harmonic generation,”
Proc. Natl. Acad. Sci. U.S.A., 100
(12), 7075
–7080
(2003). http://dx.doi.org/10.1073/pnas.0832308100 PNASA6 0027-8424 Google Scholar
D. Debarre, N. Olivier and E. Beaurepaire,
“Signal epidetection in third-harmonic generation microscopy of turbid media,”
Opt. Express, 15
(14), 8913
–8924
(2007). http://dx.doi.org/10.1364/OE.15.008913 OPEXFF 1094-4087 Google Scholar
S. A. Prahl et al.,
“A Monte Carlo model of light propagation in tissue,”
in Dosimetry of Laser Radiation in Medicine and Biology,
102
–111
(1989). Google Scholar
K. Mitra et al.,
“Experimental-evidence of hyperbolic heat-conduction in processed meat,”
J. Heat Transf., 117
(3), 568
–573
(1995). http://dx.doi.org/10.1115/1.2822615 Google Scholar
K. Kim and Z. Guo,
“Ultrafast radiation heat transfer in laser tissue welding and soldering,”
Numer. Heat Transfer Part A, 46
(1), 23
–40
(2004). http://dx.doi.org/10.1080/10407780490457365 NHAAES 1040-7782 Google Scholar
K. Kim and Z. Guo,
“Multi-time-scale heat transfer modeling of turbid tissues exposed to short-pulsed irradiations,”
Comput. Methods Prog. Biomed., 86
(2), 112
–123
(2007). http://dx.doi.org/10.1016/j.cmpb.2007.01.009 Google Scholar
W. C. Dewey et al.,
“Cellular responses to combinations of hyperthermia and radiation,”
Radiology, 123
(2), 463
–474
(1977). http://dx.doi.org/10.1148/123.2.463 RADLAX 0033-8419 Google Scholar
J. L. Roti,
“Cellular responses to hyperthermia (40–46 degrees C): cell killing and molecular events,”
Int. J. Hyperthermia, 24
(1), 3
–15
(2008). http://dx.doi.org/10.1080/02656730701769841 IJHYEQ 0265-6736 Google Scholar
A. Vogel et al.,
“Mechanisms of femtosecond laser nanosurgery of cells and tissues,”
Appl. Phys. B, 81
(8), 1015
–1047
(2005). http://dx.doi.org/10.1007/s00340-005-2036-6 Google Scholar
BiographyMurat Yildirim received his PhD in mechanical engineering from the University of Texas at Austin in 2015. He was a finalist in OSA Congressional Fellowship in 2015. Recently, he received the Best Student Poster Award at OSI-11 International Conference on Optics of Surfaces and Interfaces held in 2015. His current research interests include nonlinear microscopy and laser ablation with ultrafast lasers. He is a member of ASLMS, SPIE, and OSA. Nicholas Durr is an assistant professor of biomedical engineering at Johns Hopkins University. His lab develops new techniques and clinical applications of computational biophotonics. He completed his PhD in biomedical engineering at the University of Texas at Austin in 2010, where he was an NSF IGERT fellow in molecular imaging. From 2011 to 2014, he was an M+Vision fellow at the Massachusetts Institute of Technology. Adela Ben-Yakar is an associate professor of mechanical and biomedical engineering at the University of Texas at Austin. She received her PhD at Stanford University in 2000 and was a postdoctoral fellow in the Applied Physics Departments at Stanford and Harvard Universities from 2000 to 2004. She is an OSA fellow and a recipient of the Fulbright Scholarship, Zonta Amelia Earhart Award, NSF Career Award, Human Frontier Science Program Research Award, and the NIH Director’s Transformative Award. |


