
|
|
1.IntroductionIt has been well documented that variation in the transcription of key genes triggers the loss of homeostasis in tissues, and the profile development of different gene expression, such as human epidermal growth receptor 2 (Her2), contributes to cellular heterogeneity within individual breast cancer tumors.1–3 To better prevent and treat breast cancer, it is necessary to screen for the expression of critical genes, for example Her2, of patients undergoing specific treatments. In addition to the conventional molecular biology-based approaches, fluorescence in situ hybridization (FISH)4,5 approaches are on the rise for the detection of genomic constituents at close to single molecule sensitivity. However, fluorescence-based detection methods are restrictive when interrogating tissues. First, fluorescence microscopy is limited by the photon emissive property of the fluorescent probes,6 such as fluorescent proteins, fluorescent dyes, and even quantum dots (QDs).7 These probes are prone to photobleaching or saturation upon exposure to a laser beam with high power for a prolonged period, therefore, they not conducive for quantitative detection.8–11 Second, the fluorescent signal from a single molecule is usually overwhelmed by the laser-induced autofluorescence from tissues or live organs.12,13 In this scenario, it is urgent to develop nonfluorescent approaches for tissue imaging. Recently, Raman and plasmonic approaches are proposed utilizing the strengths of Raman or dark-field microscopy for cellular imaging.14–16 However, the scattering from cellular components is much higher than the signal from individual Raman or plasmonic probes since the scattering cross section is proportional to the volume squared,17 eliminating the possibility of tissue analysis due to low signal-to-noise ratio (SNR) using these techniques. To circumvent the disadvantages of fluorescent and plasmonic approaches, inorganic nanocrystals with second-harmonic generation (SHG), i.e., laser frequency doubling, have recently been used as probes for biolabeling and imaging.18–22 SHG is a nonlinear optical process which converts two incident photons at a frequency into one photon at frequency in a noncentrosymmetrical material.23 Unlike fluorescence, the SHG process only involves the transition between virtual energy states without any nonradiative loss. Therefore, under the illumination of an ultrafast near-infrared (NIR) laser, the SHG material emits transient, high intensity, nonblinking, nonbleaching, and unsaturated light pulses with an ultranarrow bandwidth ().22 SHG nanocrystals, such as barium titanium oxide (, BTO), lithium niobate (), potassium titanyl phosphate (, KTP), and lithium triborate (, LBO), have been used to detect single molecules with a regular and holographic second-harmonic imaging microscopy (SHIM)19–22,24 and correlation spectroscopy.25,26 Compared with fluorescence probes, the SHG emission is free from saturation and bleaching, and has an intense and stable output with a narrow spectral window, where the environmental autofluorescence can be minimized to be background-free for analysis of optically challenging samples such as tissues. This work will show the utility of SHG nanocrystals, BTO, as probes for quantifying Her2 messenger RNA (mRNA) in breast cancer tissues in Her2 expressing cells at the single molecule sensitivity. BTO nanocrystals were subsequently modified with a cell surface marker targeting antibodies or oligonucleotides that target the Her2 mRNA using appropriate functionalization protocols and the subcellular localization patterns in single cells were elucidated in breast tissues with high sensitivity. 2.Experiments2.1.BaTiO3 Nanocrystal Functionalization and ConjugationFigure 1 shows the schematic of the chemical functionalization and bioconjugation of BTO nanocrystals with antibodies and oligonucleotides. Dried powders of BTO nanocrystals were supplied by the Bowen (Swiss Federal Institute of Technology, Lausanne, Switzerland).27 Dried powder was first dissolved in water in the ratio of 10 mg to 100 mL and sonicated for 20 min to obtain monodispersed nanocrystals; aggregates were excluded by multiple filtrations through -pore filter membranes. The prepared BTO nanocrystals were immersed in 1 M of sulfuric acid for 10 min to remove the surface barium ions and the supernatant was discarded after centrifugation (6500 rpm, 20 min). The surface-activated BTO was then reacted with 0.1% 3-triethoxysilylpropylamine (APTES) dissolved in anhydrous ethanol at 70°C for 2 h to functionalize the surfaces with amine groups. After removing the unreacted APTES by centrifugation, nanocrystals were mixed with 2 mM of succinimidyl 4-[N-maleimidomethyl]cyclohexane-1-carboxylate, dissolved in dimethyl sulfoxide, and kept at room temperature for 1 h. Fig. 1Schematic of barium titanium oxide (BTO) functionalization of nanocrystals (middle) and their conjugation with a herceptin antibody (upper) and oligonucleotide (down). See methods section for a detailed description.  Herceptin (trastuzumab) monoclonal antibodies were kindly provided by Genentech Inc. (San Francisco, California). Herceptin was first reduced by 10-mM DL-Dithiothreitol (DTT) and then purified by Sephadex G-15 column chromatography (10 mL volume). BTO nanocrystal–herceptin conjugation was realized by coupling at room temperature for 1 h. The residual surfaces were finally blocked with 10 mM mercaptoethanol. The oligonucleotide strand was designed using NCBI Blast and was purchased from IDT-DNA, Inc. Coralville, Iowa. 5’-end thiolated (capture strand) oligonucleotides were used for conjugation with BTO nanocrystals. The sequence of the oligonucleotide is listed below: The disulfide bond of thiolated oligonucleotide was first disrupted using a 10 mM solution of tris(2-carboxyethyl)phosphine hydrochloride. The reduced thiolated DNA strands () were then reacted with functionalized (thiol-reactive) 1 mL of BTO nanocrystals solution to obtain a 1 mL of DNA-BTO conjugate solution (at for 30 min to 1 h). The residual surfaces were finally blocked with 10 mM mercaptoethanol and the unbound oligonucleotides were washed away with 0.3 M phosphate buffered saline (PBS). 2.2.Tissue ProcessingHuman breast cancer tissues () deposited on cover slides were obtained from surgical leftovers from patients at the Indiana University, School of Medicine; 24 slides in total were used in our study. Tissue slides were first deparaffinized by immersing paraffin-embedded tissues in xylenes (histological grade xylene, Fisher Scientific) for 5 min, three times. The slides were then rehydrated in a series of ethanol (Pharmco-AAPER) gradient; 100%, 95%, and 80% each two times, 10 min each. Next, the slides were washed in deionized for 1 min, and the excess solution outside the tissue section was aspirated using tissue papers. Subsequently, rehydrated tissue slides were permeabilized with 0.1% Tween 20 (Sigma) in tris-buffered saline (BioRad). Antigen retrieval was performed by immersing tissue slides in 10-mM Sodium citrate buffer, pH 6, at 90°C for 30 min, and transferred into a cold 10 mM, pH 6, sodium citrate buffer and allowed to cool for 20 min, then were washed in deionized water three times. To prevent nonspecific binding, the slides were treated with goat kit blocking solution for 60 min and washed with PBS three times. The slides were then incubated with antibody-BTO conjugates or oligonucleotide-BTO conjugates overnight on the shaker to ensure the binding of probes to the surface marker or mRNA. Finally, the sections were washed in PBS three times for 5 min and imaged with the second harmonic imaging microscopy described below. 2.3.Second-Harmonic Imaging MicroscopyThe SHIM was constructed based on a customized time-correlated scanning multiphoton microscopy.28 A Chameleon Ultra Ti-Sapphire tunable laser (Coherent Inc., California) operating in the range from 680 to 1080 nm was used as excitation. The laser beam was delivered onto the sample by a water-immersion objective ( /1.20 NA, Olympus). Emitted photons were registered in a time-tagged-time-resolved mode by single-photon avalanche photodiodes (SPCM-AQR-14, PerkinElmer Inc.) after filtration. The polarization response of the SHG signal was recorded by rotating a half-wave plate (10RP52-2, Newport) on the propagation path of the incident beam. The spectrum was recorded by a cooled-spectrometer (QE65000, Ocean Optics Inc.). Fluorescence and SHG images were further processed in ImageJ and MATLAB®.26 3.Results and Discussions3.1.Characterization of Barium Titanium Oxide NanocrystalsThe BTO nanocrystals were first investigated by characterizing their physical and optical properties. It is critical to control the monodispersibility of BTO nanocrystals in solutions, not only to ensure that the antibody or oligonucleotide is able to bind to individual BTO nanocrystals, but also to avoid the polycrystalline BTO aggregates which have a significant influence on the SHG properties.29 Details of the chemical functionalization of BTO nanocrystals are provided in the experimental section. 30 Essentially, the surface of the nanocrystals was first coated with amino groups to avoid aggregation (Fig. 1), then a maleimide group was added for future antibody/oligonucleotide conjugation. The dispersibility of the BTO colloidal suspension [Fig. 2(a), inset] was evaluated by dynamic light scattering, as shown in the inset of Fig. 2(b). It can be observed that BTO nanocrystals are monodispersed in solutions with an average hydrodynamic diameter of about . This conclusion was further supported by characterizing BTO nanocrystals spin coated on a coverslip and examined by scanning electron microscopy [Fig. 2(a)]. The size statistics of BTO nanocrystals suggest that the average diameter is . This size provides a balance between cellular penetration and signal strength which depends on the size of the individual nanocrystals.20 Fig. 2Physical characterization of BTO nanocrystals: (a) scanning electron microscopy (SEM) image of BTO nanocrystals deposited on a coverslip. Inset is an optical image of the colloidal suspension. (b) Size histogram of BTO nanocrystals investigated by SEM. Inset: histogram of the size distribution of BTO suspension by dynamic light scattering (DLS) analysis.  The optical properties of individual BTO nanocrystals, deposited on a coverslip, were characterized by a customized multiphoton scanning microscopy. Details of the instrument can be found in the experimental section and our previous work.26 Figure 3(a) shows a typical confocal scanning image of BTO nanocrystals deposited on the coverslip, and the temporal response is indicated in Fig. 3(b), which is compared with the decay curve of autofluorescence from tissues. The strong SHG signal from individual BTO nanocrystals suggests an ultrahigh SNR (), while the average laser intensity applied on the nanocrystal was about , which is several orders of magnitude lower than the tissue damage threshold.31 In addition, the response of the SHG signal is transient, in the range of femtoseconds,23 which is beyond the detection capability of our instrument. In Fig. 3(b), the fittings suggest that the lifetime of the SHG signal is 0.21 ns, which is the instrument response time, while the lifetime of autofluorescence of the tissue is 2.38 ns. More importantly, SHG emission from BTO nanocrystals yields a discrete peak at 441.6 nm when being illuminated at 883 nm, and the full width at half maximum (FWHM) of the SHG signal (3.9 nm) is half of the FWHM of the incident laser beam (8.6 nm). It should be noted that the SHG emission of the nanoscale BTO crystals is generally a nonresonant process, which offers flexible tunability of the excitation wavelengths. In Fig. 3(c), we show the emission spectra of the SHG signal from BTO nanocrystals excited by different wavelengths, where the emission intensity agrees well with the corresponding absorption coefficient [Fig. 3(c), inset]. Fig. 3Second-harmonic generation (SHG) from individual BTO nanocrystals. (a) Typical confocal scanning image of individual nanocrystals. (b) Time-resolved single-photon counting histogram suggests transient response of SHG signal compared with the autofluorescence from tissues. (c) Emission spectra recorded for 883, 923, and 953 nm excitation wavelengths. Left inset: absorption spectrum of BTO colloidal solutions; right inset: spectrum of excitation laser beam at 883 nm. (d) Polarization responses along the and transverse axes of individual BTO nanocrystals in (a). Dots: experimental measurements; lines: theoretical fittings. 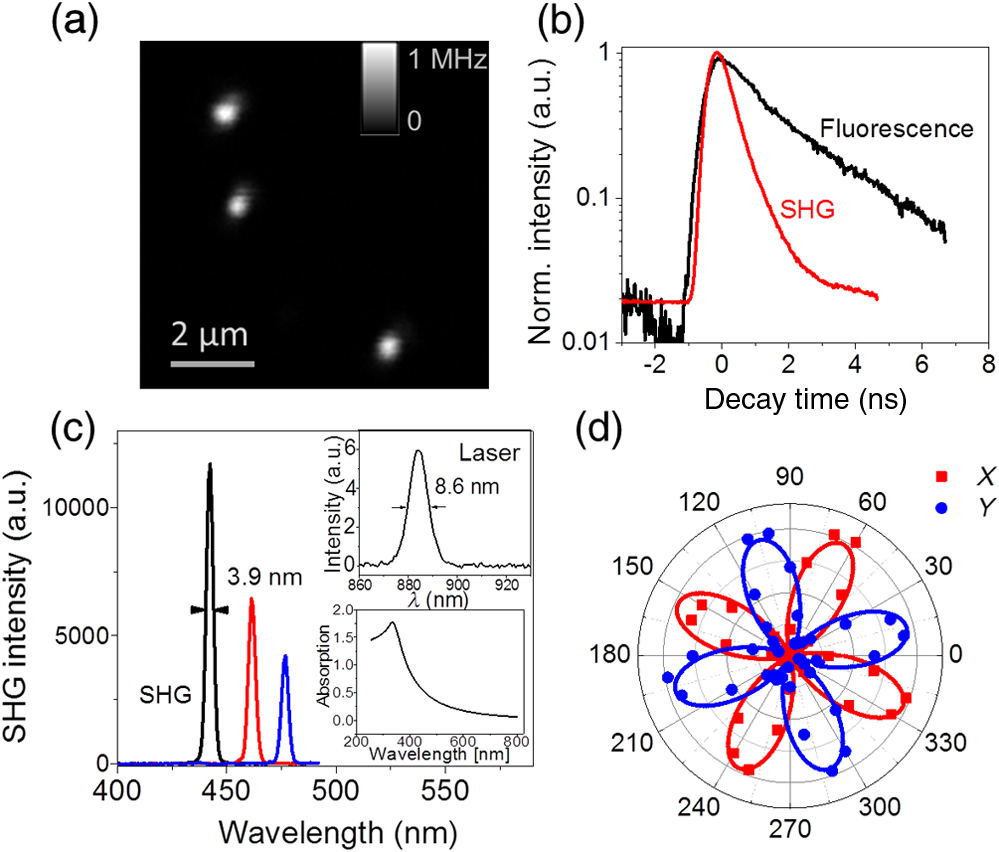 The unusual optical response of the BTO nanocrystals permits several methods to distinguish SHG signals from autofluorescence in cells or tissues. The autofluorescent emission in cells or tissues mostly originates from the aromatic amino acids, lipo-pigments, pyridinic (NAD, NADH, and NADPH), and flavin coenzymes.12 In addition to the cellular components, extracellular matrix, such as collagen and elastin, also has a significant contribution to the autofluorescence of tissues.12 Under two-photon excitation, the autofluorescence from these cellular components and the extracellular matrix has a broad emission spectrum with the minimum wavelength larger than half of the excitation wavelength, and a broad range of fluorescence lifetime (∼ few nanoseconds) [Fig. 3(b)]. Therefore, we can use spectral filtration and/or lifetime filtration to achieve single molecule detection with a high SNR. A narrow bandpass () filter with the center wavelength of can be used to block autofluorescence. Further, the lifetime analysis can identify different signals with significant lifetime differences.32 Since the lifetime of the SHG signal is several orders of magnitude smaller than the lifetime of the autofluorescence (experimentally, the lifetime of the SHG signal is limited by the instrument response time), the combination of the lifetime filtration and spectral filtration has high potential to detect individual SHG nanocrystals in live organs or tissues which have significantly inherent autofluorescence. Another important and unique property of SHG emission from BTO nanocrystals is that the SHG signal has different responses to the polarization angle of the incident laser beam. A single nanocrystal of subwavelength size can be regarded as a dipole oscillating along the -axis of the crystal structure.33 As shown in Fig. 3(d), we observed a dipolar-type response of the SHG intensity along the and transverse axes when rotating the linear polarization along the plane. This observation is a clear signature of the single crystalline structure of the BTO nanocrystals, and the polarization analysis of the SHG signal is a powerful tool to revoke the three-dimensional (3-D) orientation of the crystal structure.29 This feature suggests a possible approach to identify the SHG signal of specific nanocrystals from the backscattered endogenous SHG signal from the tissue matrix protein, such as collagen.34 At first, the BTO nanocrystal has larger second-order susceptibility than the collagen has;35,36 in our experiments, SHG signals from the nanoprobes are about 50 to 200 times that of the signal from tissues or cells. In addition, the collagen often consists of matrix proteins, which is an ordered structure where the SHG signal can reach the maximum at a single polarization angle of the excitation beam. In comparison, the spatial orientation of the nanocrystal is randomly distributed in 3-D dimension, and there is very minimum possibility that the nanocrystal and collagen have overlapped dipole orientation. The SHG signal from the nanocrystal and collagens can be significantly differentiated by excitation at different polarization angles. 3.2.Screening of Transcripts in TissuesGiven the unique optical properties of BTO nanocrystals, we further applied this bioprobe for quantitative analysis of mRNA in tissues. Most of the currently reported biological applications of SHG nanocrystals have focused on exploring the new imaging modalities of nonspecific cell uptake in different biological models;18,37,38 in our work, we focused our attention on the utility of the nanocrystals as probes to detect surface markers and transcripts of the Her2 gene at single particle sensitivity in tissues. It has widely been accepted that the Her2 gene is associated with the tumorigenesis of breast cancer, where the Her2 proteins form clusters in cell membranes. Herceptin (trastuzumab) is a monoclonal antibody that targets the extracellular domain of the Her2 receptor, and is an accepted therapeutic for breast cancer treatments and a targeting ligand for diagnosis.1 The targeting of Herceptin and the corresponding imaging of the Her2 protein provide information on the identity of this cancer stem cell phenotype in tissues, which plays an important role in the prediction of tumor invasiveness and metastatic potential.2 Meanwhile, information on the expression level and localization patterns of Her2 mRNA can pave the way for single-cell screening strategies.3 Developing imaging methods for rigorous quantitative analysis of the Her2 surface marker and the corresponding transcripts in a tissue context will be crucial for cancer staging. More specifically through this technology demonstration, we will provide the tools for single-cell quantification of genomic components in tissues, a challenging proposition using fluorescence or other methods. To ensure the specific binding of BTO nanocrystals to the cell surface markers and transcripts, we conjugated the surface of chemically treated BTO nanocrystals with disulfide-reduced herceptin antibody and single-strand oligonucleotide (Fig. 1). Details of the conjugation can be found in the experimental section. First, the binding specificity and biocompatibility of the conjugated nanoprobes were validated in cultured breast cancer cell lines, MCF-7 and SK-BR-3. Figure 4 shows the typical results for detecting Her2 mRNA in SK-BR-3 cells and Her2 surface marker in MCF-7 cells. Unconjugated BTO nanocrystals suggest very limited nonspecific binding on each cell line, while BTO-oligonucleotide probes were abundantly present in the cytoplasm of SK-BR-3 cells and indicate the overexpression of the Her2 genes. Similar results were also reported in our previous work30 and other publications using FISH approaches.39,40 The binding of BTO-herceptin probes was confirmed by a typical example in MCF-7 cells, which have been reported to be positive to herceptin [Fig. 4(b)].8,11 The high specificity of binding to the Her2 receptor was evident as the observed discrete spots on the membrane of MCF-7 cells. In addition to Fig. 4, mRNA detection in MCF-7 cells and surface marker detection in SK-BR-3 cells can be referred to in our prior work.8,11 Fig. 4Single molecule detection using BTO nanocrystals in cells. (a) in vitro detection of Her2 mRNA in SK-BR-3 cells using chemically modified BTO (upper) and BTO-oligonucleotide conjugates (down). (b) in vitro detection of Her2 protein in MCF-7 cells using chemically modified BTO (upper) and BTO-herceptin conjugates (down). Left panel: two-photon autofluorescence imaging of cells; middle panel: SHG imaging of BTO nanocrystals; right panel: merged image of the previous two panels.  In this presentation, SHG nanocrystals were first utilized to identify specific phenotypes based on the surface marker expression levels and directly quantify the corresponding transcript cells within tissues. Patient tissue slides were treated with functionalized BTO probes to target cell surface markers and mRNA of Her2 to quantitate the expression of transcripts in specific phenotypes at single-cell resolution. Details of the incubation and internalization are described in the experimental section. Meanwhile, 4',6-diamidino-2-phenylindole (DAPI) staining was also performed to visualize the SHG particles in the nuclei of cells in tissue. The excitation wavelength for both channels (SHG and DAPI) was set at 880 nm, while different emission filters (SHG: 435 to 485; DAPI: 500 to 540) were used to collect the SHG and DAPI signals. Figure 5 shows the localization of a Her2 surface marker by targeting BTO-herceptin conjugates. From the SHG channel [Figs. 5(b) and 5(e)], one can observe bright SHG spots depicting the BTO nanocrystals. It should be noted that there is little bleed through DAPI fluorescence in the SHG channel due to the relatively broad bandpass filter. For better imaging performance, the use of narrow band filters () is recommended. By overlapping it with the DAPI image, it can be found that these bright spots localize at the interface between the cells. As a control, chemically functionalized BTO nanocrystals were incubated with tissues using the same protocol; as expected, very few SHG spots were observed from the SHG channel except for some nonspecific bindings. Fig. 5Confocal images of breast cancer tissues labeled with BTO-antibody probes. (a)–(c) Tissues were first incubated with bare BTO nanocrystals as control. (d)–(f) Tissue slides were incubated with herceptin antibody conjugated with BTO nanocrystals. Two-photon fluorescence images from DAPI used to localize in the nucleus are shown in blue in (a) and (d); SHG images are shown in green in (b) and (e); and merged images of both channels are shown in (c) and (f).  In addition to detecting surface markers, we also quantified the Her2 mRNA transcripts in breast cancer tissues, as shown in Fig. 6. Similar to the FISH approach, each diffraction-limited spot represents one location of a Her2 mRNA. It can be observed that the Her2 mRNA not only exists in the cytoplasm of cells, but also occupies several locations in the nucleus. Since we found that most mRNA molecules are located within a thin section (, not shown here), and the collection of SHG images is from a 2-D section (), although the tissue has a 3-D structure. The number of mRNA molecules was counted with ImageJ and MATLAB according to the algorithm developed in Ref. 40. It should be noted here that the quantification of the mRNA molecules in tissues is underestimated mainly from two aspects. One is the 2-D imaging and quantification, and the other is the diffraction limitation. Future work can focus on applying 3-D super resolution concepts for detection and quantification of mRNAs in the entire tissue architecture. Fig. 6Confocal images of breast cancer tissues labeled with BTO-oligonucleotide probes. (a)–(c) Control experiments with tissues incubated with bare BTO nanocrystals. (d)–(f) Specific localization patterns of Her2 mRNA in breast cancer tissues detected by oligonucleotide-BTO probes. Explanation of imaging channels is the same as in Fig. 5. (g) Quantification of Her2 mRNA in single cells of the breast cancer tissue.  Quantification [Fig. 6(g)] suggests the heterogeneity of Her2 mRNA at the single-cell level in breast cancer tissues. Compared to the conventional FISH method for mRNA quantification,4,5 SHG probes have several advantages because of their unique emission with a high SNR. In FISH, several fluorescent reporters are labeled along the oligonucleotide probe and multiple probes are required for a transcript to ensure satisfactory SNR. The intense and crowded labeling on the transcript results in the self-quenching of these fluorescent reporters due to the dye–dye interaction which significantly affects the quantification analysis.4 By contrast, in our design of the oligonucleotide-BTO probe (20 to 25 bases), only a single BTO nanocrystal is needed to target a single transcript due to its high SNR, while the FISH probes are long sequences and require labeling with several fluorophores.4 The nanoprobes are capable of hybridizing to the transcripts with a very broad range of sequences as long as sequence specificity is ensured for transcript targeting.41 Quantification of mRNA molecules in breast cancer tissues is much lower than that in SK-BR-3 cells, while it is comparable to the number in MCF-7 cells,30,39 and is in agreement with previous publications.42 There is large variation in the expression level of Her2 in different cell lines. Even in the same tissue, there is also a significant cell-to-cell variation [Fig. 6(g)]. Such heterogeneity of the mRNA might play an important role at the transcriptional as well as the post-translational level,43 and regulates the Her2 receptor expression at the cell surface, which could provide a therapeutic target for breast cancer. Together with other molecular biology approaches, the SHG imaging concept can be utilized to correlate the expression of Her2 mRNA and receptors, contributing to the exploration of potential regulatory pathways that can bridge these two factors. The nonlinear SHG signal from BTO nanocrystals enables the detection of individual Her2 genes, by the quantification of either surface marker or transcript, in highly autofluorescing patient tissues at a single molecule sensitivity. This nonlinear imaging method provides a venue for the quantification of key biomarkers for personalized cancer diagnosis and treatment. In the early or pre-early stages of triple-negative breast cancer, the Her2 gene has relatively low-expression levels with a small variation.3 The BTO nanocrystal and the SHG imaging tool will provide accurate quantitative information of the Her2 gene. Furthermore, combined with the second-harmonic super resolution microscopy,30 more specific surface markers and transcripts can be resolved in the tissue to assist in the diagnosis of early stage breast cancer. Because of the unique photostability of the SHG signal, the BTO probes and the SHG imaging strategy proposed can be broadly utilized for background-free imaging and detection of single molecules in tissues. Key advantages are that the BTO nanocrystals are not toxic to live cells or live organs, and the surface functionalization of BTO nanocrystals allows for flexible conjugation with oligonucleotide, antibody, protein, and even bacteria, showing excellent biocompatibility.19–21 Second, the SHG property of a BTO nanocrystal is not affected by chemical modifications or conjugations due to the intrinsic coherence of the SHG signal. While the fluorescence emission from dyes or fluorescent proteins is highly influenced by environmental factors, such as pH, ion concentration, or surface chargers.6 The high yield and stable SHG signal guarantees high SNR from even a single BTO nanocrystal. Last but not the least, the NIR excitation of the SHG imaging approach allows for deep tissue imaging and detection, which is hard for regular one photon confocal microscopy using fluorescent probes. In our experiment, surface markers and mRNAs were detected from single cells at an estimated depth of in the tissue slides, rendering the technology a highly promising tool for quantitative detection of single-cell biomarkers at the protein and the RNA level. The above-mentioned exquisite optical properties of BTO nanocrystals could allow for the potential monitoring of biomolecules in live cells. However, to further validate the application of BTO nanocrystals and SHG imaging platform for clinical practice, the staining efficiency and specificity need additional investigations. The BTO nanocrystals used in this work have an average size of before bioconjugation and after bioconjugation; the binding efficiency is influenced by the difficulty of penetration through the tissue due to the size of the probe,44 leading to an underestimation of the quantification. The nonspecific nanoprobes are not easily washed away. Therefore, there is a need to develop SHG nanocrystals that are nanometer in size (20 to 40 nm) that can be used for clinical applications.44 In addition, differentiation of SHG signals from nanoprobes or native tissues, such as collagen,34 needs further exploration. 4.ConclusionWe report on a highly prospective application of BTO nanocrystals by taking advantage of its strong SHG signal to quantify cell surface markers and mRNA expression at the single-cell level in tissue samples. We have specifically functionalized BTO nanocrystals with antibodies and oligonucleotides, respectively, to target specific cells and transcripts, and examined the physical and optical properties of individual BTO nanocrystals, demonstrating the features such as biocompatibility,20 ultranarrow band SHG emission, high SNR, and polarimetry response. Quantification of the herceptin surface marker and Her2 mRNAs using BTO nanocrystals has shown the heterogeneity of genomic expression in clinical tissue slides, providing essential support and proof of concept toward the development of a quantitative tool for the diagnosis of cancers in the early stage. AcknowledgmentsThis work was supported grants from NSF (Award No. 1249315), the SIRG fellowship from the Purdue Center for Cancer Research (NIH-NCI P30 CA023168), the Showalter Trust Grant, and the W. M. Keck Foundation. Professor Paul Bowen (EPFL, Switzerland) is acknowledged for providing the BTO nanocrystals. We also thank Dr. Ulhas Kadam for help in the conjugation of oligonucleotide-nanocrystal probe. All studies were approved by Institutional Review Boards (IRB) protocols (1004009197) at their respective institutions. Informed consent forms were obtained from all subjects and any form of identification was removed. More specifically, patients signed a consent for the research use of leftover tissue. ReferencesZ. Mitri, T. Constantine and R. O’Regan,
“The HER2 receptor in breast cancer: pathophysiology, clinical use, and new advances in therapy,”
Chemother. Res. Pract., 2012 743193
(2012). http://dx.doi.org/10.1155/2012/743193 Google Scholar
M. Al-Hajj et al.,
“Prospective identification of tumorigenic breast cancer cells,”
Proc. Natl. Acad. Sci.U. S. A, 100
(7), 3983
–3988
(2003). http://dx.doi.org/10.1073/pnas.0530291100 Google Scholar
A. Hirschmann et al.,
“Simultaneous analysis of HER2 gene and protein on a single slide facilitates HER2 testing of breast and gastric carcinomas,”
Am. J. Clin. Pathol., 138
(6), 837
–844
(2012). http://dx.doi.org/10.1309/AJCPL5IV0LAWSERG Google Scholar
A. M. Femino et al.,
“Visualization of single RNA transcripts in situ,”
Science, 280 585
–590
(1998). http://dx.doi.org/10.1126/science.280.5363.585 SCIEAS 0036-8075 Google Scholar
G. Bao, W. J. Rhee and A. Tsourkas,
“Fluorescent probes for live-cell RNA detection,”
Annu. Rev. Biomed. Eng., 11 25
–47
(2009). http://dx.doi.org/10.1146/annurev-bioeng-061008-124920 Google Scholar
J. R. Lakowicz, Principles of Fluorescence Spectroscopy, Springer, New York
(2006). Google Scholar
F. Pinaud et al.,
“Probing cellular events, one quantum dot at a time,”
Nat. Methods, 7 275
(2010). http://dx.doi.org/10.1038/nmeth.1444 1548-7091 Google Scholar
J. Chen and J. Irudayaraj,
“Quantitative investigation of compartmentalized dynamics of ErbB2 targeting gold nanorods in live cells by single molecule spectroscopy,”
ACS Nano, 3 4071
–4079
(2009). http://dx.doi.org/10.1021/nn900743v ANCAC3 1936-0851 Google Scholar
P. Schwille and E. Haustein, Fluorescence Correlation Spectroscopy: An Introduction to Its Concepts and Applications, Experimental Biophysics Group, University of Gottingen, Gottingen, Germany
(2006). Google Scholar
E. L. Schwille and R. Rigler, Fluorescence Correlation Spectroscopy. Theory and Applications, Springer, New York
(2001). Google Scholar
Y. Wang, J. Chen and J. Irudayaraj,
“Nuclear targeting dynamics of gold nanoclusters for enhanced therapy of HER2þ breast cancer,”
ACS Nano, 5 9718
–9725
(2011). http://dx.doi.org/10.1021/nn2032177 ANCAC3 1936-0851 Google Scholar
M. Monici,
“Cell and tissue autofluorescence research and diagnostic applications,”
Biotechnol. Annu. Rev., 11 277
(2005). http://dx.doi.org/10.1016/S1387-2656(05)11007-2 Google Scholar
V. L. Mosiman et al.,
“Reducing cellular autofluorescence in flow cytometry: an in situ method,”
Cytometry, 30 151
–156
(1997). http://dx.doi.org/10.1002/(SICI)1097-0320(19970615)30:3<151::AID-CYTO6>3.0.CO;2-O CYTODQ 0196-4763 Google Scholar
A. Shamsaie et al.,
“Intracellularly grown gold nanoparticles as potential surface-enhanced Raman scattering probes,”
J. Biomed. Opt., 12
(2), 020502
(2007). http://dx.doi.org/10.1117/1.2717549 Google Scholar
Y. S. Wang et al.,
“Biocompatibility and biodistribution of surface-enhanced Raman scattering nanoprobes in zebrafish embryos: in vivo and multiplex imaging,”
ACS Nano, 4 4039
(2010). http://dx.doi.org/10.1021/nn100351h ANCAC3 1936-0851 Google Scholar
K. Lee, V. P. Drachev and J. Irudayaraj,
“DNA-gold nanoparticle reversible networks grown on cell surface marker sites: application in diagnostics,”
ACS Nano, 5 2109
–2117
(2011). http://dx.doi.org/10.1021/nn1030862 ANCAC3 1936-0851 Google Scholar
H. C. van de Hulst, Light Scattering by Small Particles, Dover, New York
(1981). Google Scholar
C. L. Hsieh et al.,
“Second harmonic generation from nanocrystals under linearly and circularly polarized excitations,”
Opt. Express, 18 13917
(2010). http://dx.doi.org/10.1364/OE.18.011917 OPEXFF 1094-4087 Google Scholar
P. Pantazis et al.,
“Second harmonic generating (SHG) nanoprobes for in vivo imaging,”
Proc. Natl. Acad. Sci., 107
(33), 14535
–14540
(2010). http://dx.doi.org/10.1073/pnas.1004748107 Google Scholar
W. P. Dempsey, S. E. Fraser and P. Pantazis,
“SHG nanoprobes: advancing harmonic imaging in biology,”
Bioessays, 34
(5), 351
–360
(2012). http://dx.doi.org/10.1002/bies.201100106 BIOEEJ 0265-9247 Google Scholar
R. L. Grange et al.,
“Imaging with second-harmonic radiation probes in living tissue,”
Biomed. Opt. Express, 2
(9), 2532
(2011). http://dx.doi.org/10.1364/BOE.2.002532 BOEICL 2156-7085 Google Scholar
D. Staedler et al.,
“Harmonic nanocrystals for biolabeling: a survey of optical properties and biocompatibility,”
ACS Nano, 6
(3), 2542
–2549
(2012). http://dx.doi.org/10.1021/nn204990n ANCAC3 1936-0851 Google Scholar
R. W. Boyd, Nonlinear Optics, Academic, San Diego
(2003). Google Scholar
L. Bonacina,
“Nonlinear nanomedicine: harmonic nanoparticles toward targeted diagnosis and therapy,”
Mol. Pharmaceutics, 10
(3), 783
–792
(2013). http://dx.doi.org/10.1021/mp300523e Google Scholar
M. B. Geissbuehler et al.,
“Nonlinear correlation spectroscopy (NLCS),”
Nano Lett., 12 1668
–1672
(2012). http://dx.doi.org/10.1021/nl300070n NALEFD 1530-6984 Google Scholar
J. Liu and J. Irudayaraj,
“Second harmonic generation correlation spectroscopy for single molecule experiments,”
Opt. Express, 21
(22), 27063
–27073
(2013). http://dx.doi.org/10.1364/OE.21.027063 OPEXFF 1094-4087 Google Scholar
A. J. Aimable et al.,
“Precipitation of nanosized and nanostructured powders: process intensification using SFTR, applied to , and ZnO,”
Chem. Eng. Technol., 34 344
–352
(2011). http://dx.doi.org/10.1002/ceat.201000324 Google Scholar
J. Liu et al.,
“Quantifying the local density of optical states of nanorods by fluorescence lifetime imaging,”
New J. Phys., 16 063069
(2014). http://dx.doi.org/10.1088/1367-2630/16/6/063069 NJOPFM 1367-2630 Google Scholar
S. Brasselet et al.,
“In situ diagnostics of the crystalline nature of single organic nanocrystals by nonlinear microscopy,”
Phys. Rev. Lett., 92
(20),
(2004). http://dx.doi.org/10.1103/PhysRevLett.92.207401 PRLTAO 0031-9007 Google Scholar
J. Liu et al.,
“Second harmonic super-resolution microscopy for quantification of mRNA at single copy sensitivity,”
ACS Nano, 8
(12), 12418
–12427
(2014). http://dx.doi.org/10.1021/nn505096t ANCAC3 1936-0851 Google Scholar
K. Konig, Handbook of Biological Confocal Microscopy, Springer, New York
(2006). Google Scholar
T. S. Blacker et al.,
“Separating NADH and NADPH fluorescence in live cells and tissues using FLIM,”
Nat. Commun., 5 3936
(2014). http://dx.doi.org/10.1038/ncomms4936 NCAOBW 2041-1723 Google Scholar
J. D. Jackson, Classical Electrodynamics, Wiley, New York
(1998). Google Scholar
W. R. Zipfel et al.,
“Live tissue intrinsic emission microscopy using multiphoton-excited native fluorescence and second harmonic generation,”
Proc. Natl. Acad. Sci. U. S. A., 100
(12), 7075
–7080
(2003). http://dx.doi.org/10.1073/pnas.0832308100 Google Scholar
P. Stoller et al.,
“Polarization-modulated second harmonic generation in collagen,”
Biophys. J., 82 3330
(2002). http://dx.doi.org/10.1016/S0006-3495(02)75673-7 Google Scholar
M. J. Weber, Handbook of Optical Materials, CRC Press, Boca Raton
(2003). Google Scholar
L. Mayer et al.,
“Single KTP nanocrystals as second-harmonic generation biolabels in cortical neurons,”
Nanoscale, 5
(18), 8466
–8471
(2013). http://dx.doi.org/10.1039/c3nr01251d NANOHL 2040-3364 Google Scholar
C. L. Hsieh et al.,
“Three-dimensional harmonic holographic microcopy using nanoparticles as probes for cell imaging,”
Opt. Express, 17 2880
(2009). http://dx.doi.org/10.1364/OE.17.002880 OPEXFF 1094-4087 Google Scholar
Jr. A. Orjalo, H. E. Johansson and J. L. Ruth,
“Stellaris fluorescence in situ hybridization (FISH) probes: a powerful tool for mRNA detection,”
Nat. Methods, 8 1548
–7091
(2011). http://dx.doi.org/10.1038/nmeth.f.349 Google Scholar
F. Mueller et al.,
“FISH-quant: automatic counting of transcripts in 3D FISH images,”
Nat. Methods, 10
(4), 277
–278
(2013). http://dx.doi.org/10.1038/nmeth.2406 Google Scholar
K. Lee et al.,
“Quantitative imaging of single mRNA splice variants in living cells,”
Nat. Nanotechnol., 9
(6), 474
–480
(2014). http://dx.doi.org/10.1038/nnano.2014.73 Google Scholar
M. B. Gero Brockhoff, A. Mund and S. Hauke,
“Fluorescent mRNA HER2 FISH,”
Imaging Microsc., 1 32
–35
(2010). Google Scholar
R. Jennemann et al.,
“Cell-specific deletion of glucosylceramide synthase in brain leads to severe neural defects after birth,”
Proc. Nat. Aca. Soc., 102 12459
(2005). http://dx.doi.org/10.1073/pnas.0500893102 Google Scholar
S. Barua and S. Mitragotri,
“Challenges associated with penetration of nanoparticles across cell and tissue barriers: a review of current status and future prospects,”
Nano Today, 9 223
–243
(2014). http://dx.doi.org/10.1016/j.nantod.2014.04.008 NTAOCG 1748-0132 Google Scholar
Biography |


