
|
|
1.IntroductionThe retina, located at the back of the eye, is a neural system responsible for capturing light photons, converting light energy to bioelectrical activities, and conducting preliminary processing of visual information. Given its delicate function, the retina consists of multiple cell types working together as a complex neural network (Fig. 1). In brief, all vertebrate retinas consist of three layers of nerve cell bodies;1 i.e., the outer nuclear layer (ONL), inner nuclear layer (INL), and ganglion cell layer (GCL). There are also two layers of synapses; i.e., the outer plexiform layer (OPL) and inner plexiform layer (IPL). The ONL contains cell bodies of rod and cone photoreceptors, the INL contains cell bodies of the bipolar, horizontal, and amacrine cells, and the GCL contains cell bodies of ganglion cells and displaced amacrine cells. Moreover, the retinal pigment epithelium (RPE) supports the rod and cone photoreceptors. The outer limiting membrane (or external limiting membrane) is situated at the bases of the rod and cone photoreceptor inner segments, and the inner limiting membrane is the boundary between the retina and the vitreous body. Fig. 1(a) A schematic diagram of the human eye with a schematic enlargement of the retina. (b) Three-dimensional (3-D) diagram of the human retina. (c) Histological image of a cross-sectional slice of the central human retina. Reprinted with permission from Ref. 1.  It is known that age-related macular degeneration (AMD),2 retinitis pigmentosa, glaucoma,3,4 diabetic retinopathy (DR),5,6 and other eye diseases can produce retinal neural dysfunctions. Different eye diseases can damage different functional layers and cells, causing localized lesions or cell loss at early stages of the disease. For instance, it is established that rods are more vulnerable than cones in early AMD.7,8 Currently, there is no established strategy to allow objective assessment of localized rod dysfunction at high resolution. Because of the complex retinal structure, early detection of eye diseases and reliable evaluation of treatment outcomes require high-resolution examination of retinal morphology and physiology. Optical approaches, such as fundus imaging9,10 and angiography examination,11 are valuable for disease detection and treatment evaluation. By rejecting out-of-focus background light, the scanning laser ophthalmoscope10,12–14 can provide enhanced image quality compared to a conventional fundus camera. Further integration of adaptive optics (AO) has enabled cellular resolution examination of retinal morphology.15–19 Given the unprecedented capability to differentiate individual functional layers, optical coherence tomography (OCT)20 has been extensively employed for depth-resolved examination of morphological abnormalities associated with eye diseases.21–27 However, morphological (structural) and physiological (functional) abnormalities in the retina are not always directly correlated,2,28,29 in terms of the time window and spatial location. In principle, distortions of physiological functions can occur before detectable cell loss and corresponding layer thickness changes in the retina. Therefore, functional evaluation of retinal physiology is important for early detection and reliable treatment assessment of eye diseases. Psychophysical methods, such as the Amsler grid test, visual acuity,30,31 hyperacuity perimetry,32 and microperimetry,33–36 are practical in clinical applications, but they involve higher order cortical processing. In other words, they do not provide exclusive information of retinal physiology and lack the sensitivity required for early disease detection. Electrophysiological approaches such as electroretinography (ERG)37 can be used for objective examination of retinal physiology. In general, it is believed that the a-wave of classic full-field ERG reflects the physiological function of retinal photoreceptors, and the b-wave reflects the physiological function of inner retinal neurons, particularly ON-bipolar cells. However, given the fact that the ERG represents the integral activity of retinal photoreceptors and inner neurons, the clinical interpretation of alterations in full-field ERG components produced by eye diseases can be difficult. Moreover, classical full-field ERG does not provide spatial information in a lateral direction. The focal ERG38–42 and multifocal ERG43,44 have been used to provide limited lateral resolution. Reliable identification of localized dysfunction of different cell types requires a method that can provide an objective evaluation of stimulus-evoked physiological activities at a high resolution. Although it is possible to combine morphological (e.g., high resolution OCT) with physiological (e.g., ERG) evaluation45 to improve retinal study and disease detection, conducting these separate measurements is cost-inefficient and time-consuming. Moreover, the relationship between low spatial resolution in low resolution ERG and high resolution optical imaging is complicated for clinical interpretations. Stimulus-evoked intrinsic optical signals (IOSs), such as transient light scattering and birefringence changes (Fig. 2), have been demonstrated in endocrine cells,46,47 brain cortex,48–51 retina,52–62 and other neural tissues.63–66 Because IOS images are constructed through computer-based dynamic differentiation of retinal images recorded at pre- and post-stimulus periods,67–69 concurrent structural and functional assessment can be naturally achieved at a high resolution. Functional IOS imaging promises a useful complement to ERG for objective measurement of retinal physiological function.70,71 However, clinical deployment of functional IOS imaging is still challenging due to unclear signal sources and limited signal-to-noise ratios (SNRs). In this article, we provide a systematic review of the study of retinal IOSs. In the following sections, we will describe the definition of fast IOSs (Sec. 2), nonimaging study of retinal IOSs (Sec. 3), in vitro imaging of retinal IOSs (Sec. 4), and in vivo imaging of retinal IOSs (Sec. 5). Current understanding of IOS mechanisms, and technical challenges and the potential of functional IOS imaging of human retinas are discussed in Sec. 6, before the conclusion in Sec. 7. Fig. 2(a) Light scattering and (b) birefringence changes from a squid giant axon and simultaneous records of the action potential. Upward arrowheads show the stimulation (S) delivery. The thick noisy traces are optical records, and the vertical arrows represent a light increase of , where is the dynamic change and is the background light intensity. The thin smooth traces are the action potentials. Reprinted with permission from Ref. 63. 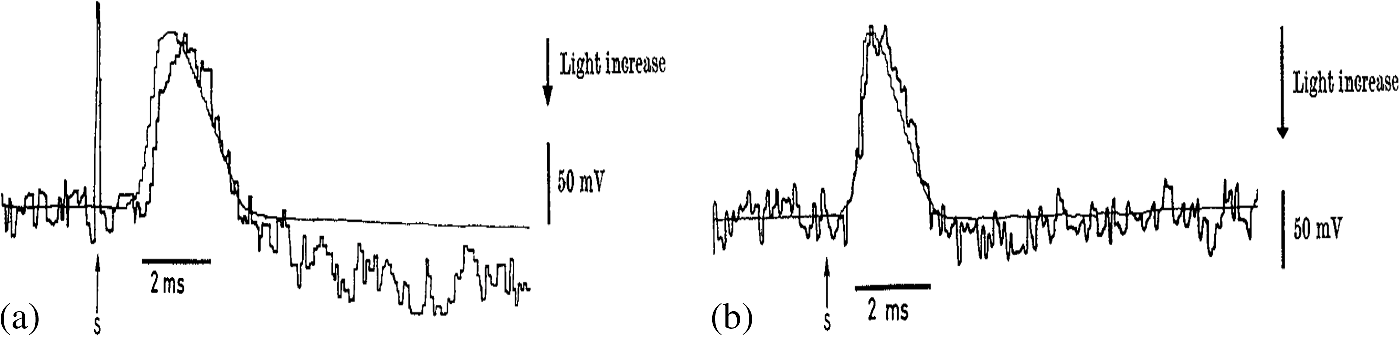 2.Definition of Stimulus-Evoked Intrinsic Optical SignalsThe IOS is a common name referring to stimulus-evoked changes of all types of intrinsic optical properties, such as transient light scattering, polarization, and absorption fluctuations in excitable tissues and cells. In principle, both stimulus-evoked neural activity as well as subsequent hemodynamic and metabolic changes can produce dynamic optical changes. While hemodynamic and metabolic signals72 can provide important information in the functional assessment of the blood circulation system, they are relatively slow and cannot directly track fast neural activities in the retina and other neural systems. Fast light scattering and birefringence changes (Fig. 2) have been observed in electrically activated nerve tissues.63,73,74 Without the involvement of exogenous chromophores, as in fluorescence microscopy, these rapid light changes reflect intrinsic property dynamics in excitable cells and tissues. As shown in Fig. 2, the typical IOS unit is , where is the stimulus-evoked magnitude change and is the background light magnitude before the stimulation delivery. The fast IOS in Fig. 2 shows a tight correlation with corresponding electrophysiological kinetics. During the past years, extensive efforts have been undertaken to pursue functional IOS mapping of physiological activities in the brain.50,75–78 A systematic review of IOS mechanisms has been provided by Rector et al.79 In brief, stimulus-evoked structural changes of neural tissues at both molecular and cellular levels may produce transient light scattering and birefringence changes.80,81 The activation of sodium channels, inducing a reorientation of the peptide bonds, may alter the polarization property of scattered light.82 In vitro studies of isolated nerve tissues have suggested that the polarization property of scattered light can also be affected by transient changes in the cylindrical shape of nerve fibers.63,74 Neuron swelling/shrinkage due to water fluxes correlated with ion exchanges may lead to a reduction in the polarization measurement.66,83,84 The additional water may also increase light transparency of the nerve tissues, and thus reduce the detectable scattered light.65,85 3.Early Study of Retinal Intrinsic Optical SignalsPhotoproducts of rhodopsin bleaching play a significant role in the retina, such as alternating light sensitivity or affecting the time course of light adaptation.86–91 Each photoproduct such as meta I, meta II, and meta III corresponds to characteristic absorption peaks of visible light. Early studies revealed that ganglion cell sensitivity is inversely affected by the concentration of meta II in the retina,86,90 and the recovery of the ERG b-wave also has a tight correlation to photoproducts of rhodopsin bleaching.92 Visible light spectral measurement of photoproducts of rhodopsin bleaching in animal93 and human94 retinas has provided insights into a better understanding of retinal information processing. However, the visible probe light can involve further rhodopsin bleaching and thus contaminates the original bleaching stimulation. Alternatively, a near-infrared (NIR) (typically 700 to 900 nm) probe light has been used to measure transient IOS changes in rod outer segment (ROS) suspensions and isolated retinas. 3.1.Light-Evoked Intrinsic Optical Signal Changes in Rod Outer Segment SuspensionsLight-evoked IOSs have been detected in ROS suspensions.52,54,56,57,95–100 Figure 3(a) represents three IOS components in bovine ROS suspensions:54,100 (1) a rhodopsin signal associated with the meta I → meta II transition;101 (2) a binding signal, related to R*-G complex formation, and (3) a dissociation signal observed when guanosine triphosphate is present, related to nucleotide exchange and dissociation of the complex and synchronous with the triggering of phosphodiesterase (PDE) activity.101 Photoexcitation associated outer segment disk swelling/shrinkage has been proposed to explain these observed IOSs.96,97,102 Recently, transient morphological change of photoreceptor outer segments was unambiguously observed in intact retinas.103,104 Fig. 3(a) Light-induced scattering signals in rod outer segment (ROS) suspensions. The wavelength of the recording light beam was . The upper trace shows a rhodopsin signal from washed disks induced by a visible light flash. The middle trace shows the binding signal in the absence of guanosine triphosphate (GTP). The lower trace shows the dissociation signal in the presence of GTP. The vertical scale is the relative transmitted intensity change. (b,c) Light-induced scattering signals in isolated retinas. (b) Angular dependence of the light scattering (LS) response to a visible light flash. Signals were recorded from retinas 1 (left) and 2 (right) within the indicated intervals of the scattering angle (0); overall periods of measurement were 125 min (retina 1) and 91 min (retina 2). Each set of signals was scaled for equal peak amplitudes (normalized). Each set of responses includes a second control measurement at a single angular interval (bottom row: 3 deg to 6 deg and 6 deg to 10 deg, respectively, for retinas 1 and 2); the period between the first and second measurements at this interval was 290 min. (c1) Effects of a low- medium on light scattering (LS) changes (left) and electroretinography (ERG) (right) responses. Simultaneous responses recorded before, during, and after superfusion with a low- medium. Labels identify the times of recording and the switching of the superfusion medium. (c2) Flash responses recorded before (top traces), during (middle traces), and after (bottom traces) background illumination. (a) Reprinted with permission from Ref. 100. (b,c) reprinted with permission from Ref. 59.  3.2.Light-Evoked Intrinsic Optical Signal Changes in Isolated RetinasSingle-channel photodetectors were also used to detect integral NIR light scattering,58,59 transmission,52,55,61 and birefringence changes105–107 in isolated retinas, which enabled quantitative investigation of phototransduction, light adaptation, bleaching desensitization, and G-protein kinetics in intact photoreceptors.58,59,108,109 Figures 3(b) and 3(c) represent IOS study of isolated bovine retinas. As shown in Figs. 3(b) and 3(c), the rising phase of the IOS in intact photoreceptors had a consistent time course (time to peak). However, the time course of the recovery-phase varied significantly and could be affected by recording angles relative to the axis of the illumination light.58 This observation suggested that a single process dominates the early phase IOS, while multiple processes may contribute to the recovery-phase IOS. A low- medium has been used to verify the IOS correlation to retinal photoreceptors [Fig. 3(c1)]. The experiment with background illumination control suggested that the early phase IOS arises largely or entirely from events within the rods [Fig. 3(c2)]. Subsequent studies suggested that the early phase IOS most likely correlates to PDE activation.58 While these experiments consistently detected light-evoked IOS in retinal photoreceptors, other experiments suggested possible IOSs existed in inner retinal layers.61,68 Given the complex retinal structure (Fig. 1), high-resolution imaging is desirable for better study of the IOSs in stimulus activated retinal neural networks. 4.In vitro Intrinsic Optical Signal Imaging of Isolated RetinasSeveral versions of digital microscopes have been used for IOS imaging of the retina at cellular spatial resolution and millisecond temporal resolution.67,110,111 Both microlens arrays (MLAs) and line-scanner-based confocal systems have been explored for selective IOS imaging of retinal photoreceptors.112,113 Time-domain OCTs have been used in in vitro study of IOS changes in animal retinas.68,114,115 4.1.Microscopic Imaging of Retinal Intrinsic Optical SignalsFigure 4 represents a modified conventional light microscope for transmitted light microscopy of transient IOSs in isolated retinas. The imaging system consists of two; i.e., visible and NIR, light sources. The visible light is used for retinal stimulation, and the NIR light is used for IOS imaging. The visible light stimulator was a fiber-coupled white light-emitting diode with central wavelength at 550 nm (wavelength band: 450 to 650 nm). The NIR light was produced by using a halogen lamp with a bandpass filter (wavelength band: 800 to 1000 nm). A high-speed camera is used for dynamic mapping of stimulus-evoked IOSs in the retina. A multiple electrode array system is used for concurrent ERG measurement of retinal activation. Fig. 4(a) Photograph and (b) optical diagram of the near-infrared (NIR) light microscope for intrinsic optical signal (IOS) imaging. During measurements, an isolated frog retina is continuously illuminated by the NIR light. The visible light stimulator is used to produce a visible light flash for retinal stimulation. A multiple electrode array (MEA) system is used for concurrent ERG measurement of retinal activation. The dichroic mirror reflects visible stimulus light and passes the NIR recording light. The eyepiece camera is used to adjust a visible light stimulus aperture at the retina. In order to ensure light efficiency for intrinsic optical signal imaging, the beam splitter is removed from the optical path after the visible light stimulator is adjusted. The NIR filter before the high-speed camera is used to block visible stimulus light, and allows the NIR probe light to reach the detector for recording stimulus-evoked IOSs. Reprinted with permission from Ref. 116.  High-speed (100 to 1000 Hz) digital cameras67 were used to validate high-resolution () imaging of retinal IOSs. Figure 5 represents the IOS images recorded from the retinal photoreceptor layer, in which the photoreceptor mosaic could be clearly observed. High-resolution IOS images revealed both negative (decreasing) and positive (increasing) signals (Fig. 5). Both fast and slow IOSs were observed. While the fast rising-phase IOS could reach a magnitude peak (arrowheads, Fig. 5) within tens of milliseconds after the stimulus delivery; slow recovery-phase IOS lasted a relatively long time (many seconds). This observation is consistent with the early IOS study shown in Fig. 3. Given the fact that high-resolution imaging could differentiate localized IOSs with opposite (positive and negative) polarities, it is noteworthy that large IOSs could often exceed 5% in individual pixels [Fig. 5(d)]. The substantial improvement in optical sensitivity allows functional imaging with subcellular resolution in single passes.110 Optical sensitivity could improve further with dark-field and polarization imaging.110 Fig. 5High-resolution imaging of IOSs in isolated frog retina. (a) Representative raw image sequence of the retina, without differential processing. The images were recorded with a CCD camera at a speed of 80 fps. The white spot in the third frame shows the visible stimulus pattern. (b) IOS images. Each illustrated frame is an average over 100 ms interval (8 frames). 200-ms prestimulus and 500-ms poststimulus images are shown. (c) Enlarged image of the third frame shown in (b). (d) Temporal changes of IOSs. The numbered tracings 1 to 3 are representative IOSs of individual pixels, corresponding to arrowheads 1 to 3 showing retinal points in (c). Tracing 4 is the averaged optical response of the whole image area. Vertical lines indicate the stimulus onset. Reprinted from Ref. 117.  By changing the light focus, functional IOS images could also be collected for inner retinal layers (Fig. 6). This indicated that multiple IOS sources exist in the retina, which is consistent with early IOS studies of eyecup slices61 and isolated retinas.68 Dynamic microscopy imaging of retinal slices, which simultaneously open whole cross sections from retinal photoreceptor to ganglion cell layers, further confirmed the existence of IOSs in both outer and inner retinal layers.118 In addition to IOS measurements of normal retinas, comparative investigation of wild-type and mutant mouse retinas with rod degeneration has been conducted to demonstrate IOS distortions in diseased retinal photoreceptors, and enhanced spontaneous IOS changes were observed in the inner layers of the diseased retinas.70 Fig. 6IOS imaging of inner retinal neurons. (a1, a2) Dynamic differential IOS images of the inner nuclear layer (INL) and ganglion cell layer (GCL). (b1, b2) Raw images of the INL and GCL. (c1, c2) Enlarged images of the third frames shown in (a1, a2), respectively. (d) The IOS response of individual pixels pointed to by arrowheads in (c2). The retina was activated by a 500-ms step light stimulus. Simultaneous ERG recording was performed to show the stimulus-evoked electrophysiological response of the retina. The vertical line indicates the stimulus onset and offset. The raw images were recorded with the CMOS camera at a speed of 1000 fps. Reprinted with permission from Ref. 116.  4.2.Confocal Imaging of Retinal Intrinsic Optical SignalsWhile conventional light microscopes can provide high-resolution measurement of retinal IOSs, signal contaminations among adjacent retinal volumes may exist due to possible light diffusion among neighboring volumes. To detect IOSs specifically from the retinal photoreceptor layer, an MLA-based imager was developed.112 This imager used an MLA-based illuminator to simultaneously deliver visible stimulus light and NIR recording light at the retinal photoreceptor layer. The parfocal configuration of the stimulus and recording light illumination enabled confocal recording of retinal IOSs (Fig. 7). Because the MLA stimulation/recording spots were widely separated on the retina, and only photoreceptors within the MLA stimulation/recording spots were stimulated, the potential IOS crosstalk effect among neighboring retinal volumes was minimized. The experiment revealed robust IOS activities tightly correlated with localized retinal responses. Localized IOS responses with magnitude peaks up to 40% were consistently observed [Fig. 7(a)]. Because both the visible stimulus and the NIR recording light were focused at the photoreceptor layer, and because of the very short IOS delay after stimulus onset, it was believed that the observed IOSs primarily resulted from the activities of retinal photoreceptors. An alternative line-scan approach was also explored to demonstrate confocal IOS recording of retinal photoreceptors.113 Subsequent in vivo IOS and ERG study confirmed that confocal IOS was predominantly attributed to retinal photoreceptor responses.71 More details are discussed in Sec. 5. Fig. 7(a) Microlens array (MLA) recording of retinal activation. Each illustrated IOS image is an average over 600 ms intervals (i.e., 200 frames, ). (b) Enlargement of the fourth frame in (a). (c) Black traces 1 to 8 show IOSs of randomly selected 8 pixels pointed to by the arrowheads in (b). (d) Black traces 1 and 4 show the average of all the positive and negative IOSs within the MLA spot areas. Gray traces 2 and 3 show the positive and negative IOSs without a stimulus. (e) IOS magnitude map of the single-trial MLA recording shown in (b). (f) Averaged IOS magnitude map of 6 MLA recordings. (g) Temporal dynamics of the overall IOS magnitude shown in (f). Reprinted with permission from Ref. 112.  4.3.Functional Optical Coherence Tomography Imaging of Retinal Intrinsic Optical SignalsYao et al. demonstrated the first in vitro OCT recording of retinal IOS changes in isolated frog retinas in 2005.68 By using an electro-optic phase modulator (EOPM) to achieve nonmoving-parts OCT, depth-resolved OCT detected IOS changes at both outer and inner retinal layers [Fig. 8(a)]. The EOPM-based OCT was recently combined with a line-scan strategy to achieve rapid functional IOS imaging of living frog eyecups.115 Bizheva et al. reported an in vitro OCT study of rabbit retinas in 2006.114 As shown in Fig. 8(b), stimulus-evoked IOS changes were observed in the inner/outer segments of the photoreceptor layer and the plexiform layers. Comparative pharmacological treatments of the rabbit retinas confirmed that the origin of the observed optical changes is the altered physiological state of the retina evoked by the light stimulus [Fig. 8(b)]. Fig. 8In vitro time-domain optical coherence tomography (TD-OCT) measurement of frog (a) and rabbit (b) retinas. (a1) A voltage pulse of 10 ms was used to drive a white light-emitting diode (LED), and the light flash stimulated the frog retina. (a2) Electrophysiological response associated with the light stimulus. (a3) Scattering response at the photoreceptor layer. (a4) Scattering response at the ganglion layer. Each trace is an average of 100 trials, and the recording interval was 1.5 s. (b1, left) A morphological retinal image compared with differential M-scans corresponding to a dark scan (no light stimulus), (middle) a single flash scan in normal retina, and (right) a single flash scan in retina with inhibited bipolar cell function in the inner plexiform layer (IPL). The red dashed line marks the boundaries of the IPL in all M-scans. (b2, b3) A 3-D visualization of the positive and negative optical signals in different M-scans. (b4) The time course of the optical signals (average across the width of the IPL) extracted from the IPL. The error bars show the standard deviation computed by averaging 10 differential M-scans. (b5) The ERG recordings simultaneously acquired with the OCT M-scans. (b1–b3) The white and (b4,b5) yellow strips in the M-scans mark the onset and time duration of the SF light stimulus. (a) Reprinted with permission from reference 68. (b) Reprinted with permission from Ref. 114.  5.In Vivo Intrinsic Optical Signal ImagingConventional fundus cameras,119–122 adaptive optics imagers,123–125 and functional OCT126–130 have been explored for in vivo imaging of retinal IOSs. 5.1.Fundus Imaging of Retinal Intrinsic Optical SignalsFigures 9 and 10 represent fundus IOS imaging of anesthetized cats121 and monkeys,120 respectively. In the cats, a negative response was typically recorded, and a positive response was also occasionally observed in the adjacent area of the stimulation pattern. Both these positive and negative IOSs showed a rise time on the order of seconds, similar to those observed in the mammalian neocortex. Relative experiments indicated that the spectral dependency of the signals on illumination was similar to the absorbance spectra of hemoglobin and the oximetric relationship.131 Therefore, it was believed that the dominant mechanism of these IOSs was associated with hemodynamic changes. Pharmacological treatments supported that these observed IOSs might be attributed to the outer retina.121 However, other groups reported additional IOSs that might be attributed to the inner retina.120,132 Fig. 9Fundus IOS imaging of a cat retina. The measured intrinsic signals have a slow, monophasic rise time. Each frame shows the difference as the signal develops over time. Between 0 and 2000 ms, when no stimulus is present, there is little change from baseline (middle gray levels represent zero). Both positive (white plotted line) and negative (black plotted line) signals appear within 500 ms of stimulus onset and continue to grow in strength for the duration of the stimulus (3 s). Signals grow in magnitude, yet remain spatially coupled to the region of retinal stimulation. Signals have a slow decay back to baseline values. The time course of the regions of interest (ROIs) placed over the negative (N) and positive (P) signals can be seen below, showing that the negative and positive signals have matching time courses, suggesting a common or linked underlying mechanism. Reprinted with permission from Ref. 121.  Fig. 10(a)–(d) Fundus IOS imaging of a monkey retina. (a) Fundus photograph of normal retina showing the regions analyzed. (b) Time courses of two-dimensional images of the ocular fundus showing the light reflectance changes during a 10 s trial with (lower) and without (upper) a flash stimulus. Images on the left are fundus images taken at the beginning of the trial. Images on the right show the light reflectance changes following a flash. Thirty consecutive video frames collected during 1 s were averaged for one poststimulus fundus image. Darkened regions indicate a decrease in light reflectance following a flash stimulus. (c) Plot of the time courses of light reflectance changes in a single trial following a diffuse flash stimulus in the three locations shown in (a). The time following the flash is shown on the abscissa. The delivery of the flash is indicated by the arrowhead. Each point is the average of 15 video frames collected during 0.5 s of light reflectance changes. F, signal at the fovea; D, signal at the optic disc; R1 and R2, signals in the nonfoveal retina (colored arrows). The time course of the reflectance changes during the first 500 ms following a flash is shown in the lower graph, where each point is the average of two video frames during . (d) Time courses of light reflectance changes in a single trial following a diffuse flash measured at the fovea and four different regions within 12 deg from the fovea in each quadrant. Amplitudes are indicated as values relative to the light reflectance changes at the end of each trial (1.0). The four regions tested in each quadrant are indicated as distances from the fovea (3 deg, 6 deg, 9 deg, and 12 deg). Reprinted with permission from Ref. 120.  For the monkey experiment, as shown in Fig. 10, three retinal locations were measured: (1) the fovea; (2) the posterior retina between the macula and inferior temporal artery; and (3) the optic disk (Fig. 10). The overall IOS in the stimulated retina showed a negative response compared to the prestimulus baseline [Fig. 10(b)], which is generally consistent with the IOS observed in cat retinas (Fig. 9). The fast IOSs at the fovea and the posterior retina were thought to be derived from retinal photoreceptors and are not related to changes in the blood flow or blood oxygenation levels in the retina or choroid. In contrast, the slow IOSs at the posterior pole and the optic disk are thought to be derived from blood flow increases in the vessels and capillaries triggered by retinal ganglion cells.120 5.2.Confocal Ophthalmoscopy of Retinal Intrinsic Optical SignalsA line-scan imager has been demonstrated for confocal IOS imaging of intact frogs.71,133 Figure 11(a) illustrates the schematic diagram of the line-scan confocal ophthalmoscope for in vivo confocal IOS imaging. The line-scan confocal imaging system consisted of two light sources: NIR for IOS recording and visible green for retinal stimulation. The NIR light was produced by a superluminescent laser diode with a center wavelength of 830 nm. A single-mode fiber coupled 532-nm green laser was used to produce the visible light stimulation with low power, or to create localized retinal injury with increased light power. The leopard frog (Rana pipiens) was selected to take advantage of the high-quality optics of the ocular lens134 and the large size of the retinal photoreceptors (cone, ; rod, ).135 Together, these characteristics made it possible to resolve individual photoreceptors [blue arrowhead in Fig. 11(b)] and blood vessels [yellow arrowheads in Figs. 11(b) and 11(c)] in vivo. Fig. 11(a) Schematic diagram of the line-scan confocal ophthalmoscope for in vivo IOS imaging: CO, collimator; CL, cylindrical lens; BS, beam splitter; SM, scanning mirror; DM, dichroic mirror; MS, mechanical slits; Lx, optical lenses. (b) Representative in vivo confocal image of frog retina. Individual photoreceptors (blue arrowheads) and blood vessels (yellow arrowheads) were observed. (c) map of the prestimulus images to show blood vessel patterns. Scale bars (in white) represent . Reprinted with permission from Ref. 71.  Figure 12 represents the line-scan confocal imaging of retinal IOSs in intact frogs. The stimulus-evoked IOSs were mixed with intrinsically hemodynamic changes [Fig. 11(b)]. Retinal blood vessels can be mapped based on dynamic optical changes correlated with blood flow136 [Fig. 12(c)]. This strategy was adapted to separate stimulus-evoked fast IOSs in retinal photoreceptors from blood flow-induced optical change [Fig. 12(c)]. Both positive and negative IOSs were observed almost immediately after retinal stimulation. Figure 12(d) shows the IOS pattern by plotting absolute IOS magnitudes. Fig. 12(a) Confocal images of frog retina; each illustrated frame was the average over 20 ms. Epochs of 40 ms (prestimulus) and 80 ms (poststimulus) are shown. The green rectangle in the third frame of column (a) indicates the size and location of the stimulus pattern. (b) The spatial IOS image sequence before filtering blood dynamics. (c) The spatial IOS image sequence after filtering blood dynamics. (d) The IOS strength distribution image sequence after filtering blood dynamics. Scale bars (in white) represent . Reprinted with permission from Ref. 71.  To investigate the signal source of the confocal IOS, IOSs and ERG were recorded and compared at variable stimulation intensities over a 5.0 log unit range in nine steps: , , , , , , , , and 0.0. Stimulus flashes were presented at 2-min intervals (Fig. 13). IOS and ERG recordings were consecutively collected in the same frog eye. Figures 13(a) and 13(b) show representative IOS magnitudes and full-field ERG waveforms corresponding to variable stimuli. It was typically observed that the IOS occurred almost immediately after the stimulus delivery, reaching peak magnitude within 150 ms. ERG a-wave, b-wave, and IOS magnitudes and times to peaks were normalized in Figs. 13(c) and 13(d), respectively. It is well established that the full-field ERG a-wave reflects the physiological function of retinal photoreceptors.137 Since the overall trend of IOS magnitudes was consistent with that of the full-field ERG a-wave amplitude, including the threshold and peak value, under variable stimulation conditions it was believed that the confocal-IOS signals predominantly originate from retinal photoreceptors. Both magnitudes and rising-phase time courses of the IOS and a-wave showed similar responses to stimulus intensity changes. However, the time to the peak of IOSs fell between the a-wave and b-wave [Fig. 13(d)]. It is well established that the a-wave leading edge is dominated by retinal photoreceptors, and the later phase is truncated by electrophysiological responses of inner retinal neurons, particularly ON bipolar cells. Figure 14(a) represents a typical integral ERG, and Fig. 14(b) shows a carton diagram of retinal photoreceptors and inner neurons. It is well accepted that the integral ERG can separate into three components: PI reflecting RPE changes, PII reflecting ON bipolar changes, and PIII reflecting photoreceptor changes. As shown in Fig. 14(c), if a pure photoreceptor response is recorded, i.e., postphotoreceptor neurons are blocked, the a-wave may need more time to recover back to the baseline, which results in a longer time to reach a peak compared with the a-wave of a full-field ERG.138–141 From this perspective, if we assume the rising-phase IOSs originate from retinal photoreceptors, the measured time to peak of the IOS should be longer than that of the a-wave of a full-field ERG, which is consistent with the experimental results in Fig. 13. Fig. 13Comparative IOS and ERG analysis. (a) IOSs and (b) ERGs were recorded from the same groups of frogs. Each tracing represents an average of four responses evoked by light flashes of progressively brighter intensities over 5.0 log units (log I/Imax) as indicated by the legend. (c) Normalized magnitude and (d) time to peak of full-field ERG a-wave, b-wave, and confocal-IOSs plotted as a function of stimulus strength. Reprinted with permission from Ref. 71. 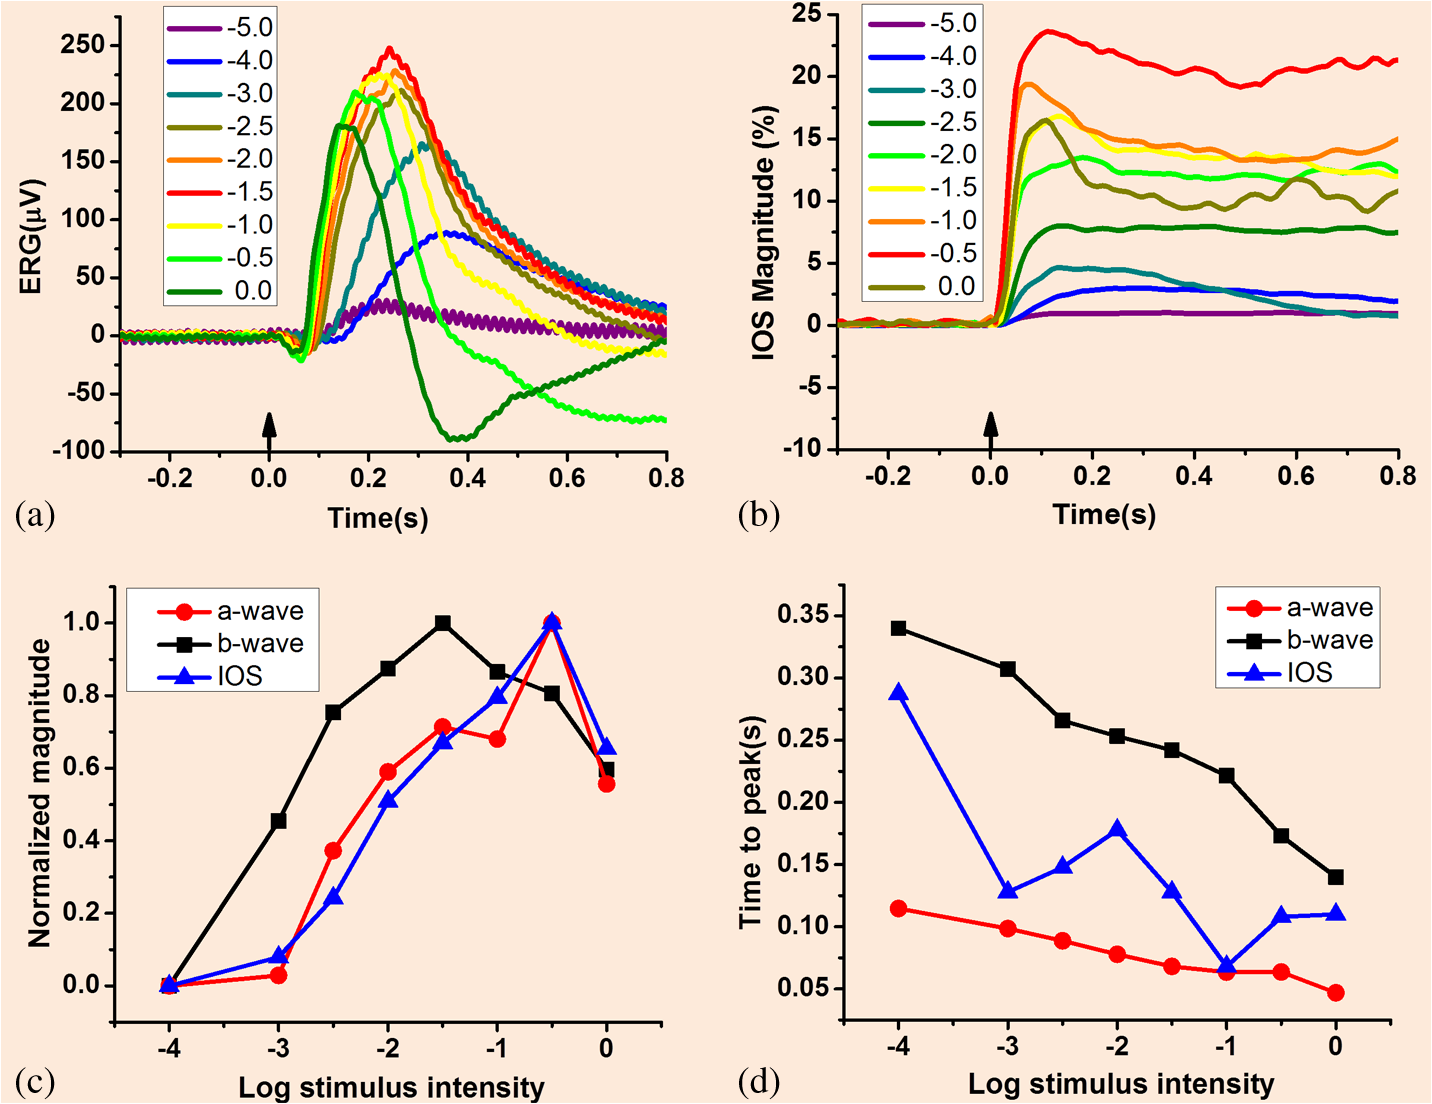 Fig. 14Origins of ERG waves. (a) Typical full-field ERG waveform. (b) Schematic diagram of retinal structure. (c) The full-field ERG of a cat in response to a 2-s light stimulus. The three components PI, PII, and PIII have been isolated by deepening the state of anesthesia. (a) and (b) are reprinted with permission from Ref. 139. (c) is reprinted with permission from Ref. 138.  To demonstrate the feasibility of IOS mapping of localized retinal dysfunction, a laser lesion was introduced into a frog eye after a control measurement (Fig. 15). To produce a localized retina laser injury, a width 532-nm green laser (FC-532-020-SM-APC-1-1-ST; RGBLase LLC, Fremont, California) with output power of 1 mW at the retina surface was continuously delivered for 30 s.71 Thirty minutes after the laser exposure, the IOS imaging was conducted again with the same full-field stimulation. From the morphological images of Figs. 15(a1) and 15(b1), it is hard to detect any difference. However, functional IOS images showed dramatic differences in the eye before [Fig. 15(a2)] and after [Fig. 15(b2)] the laser injury. Fig. 15Structural and IOS images before and after laser injury. (a1) Retinal photoreceptors of a normal frog eye and (b1) the same retinal area after laser injury. Three-dimensional IOS image with full field stimulus (a2) before and (b2) after laser injury. Scale bars (in black) represent . Reprinted with permission from Ref. 71.  5.3.Functional Optical Coherence Tomography Imaging of Retinal Intrinsic Optical SignalsBoth time-domain (TD)68,114,115 and spectral-domain (SD)63,126–129 OCTs have been explored for depth-resolved IOS recording of stimulus-evoked retinal activities. Moreover, a recent study also revealed optical (and textural) changes on OCT images in patients with DR, which were thought to be correlated with metabolic changes in the retina.142 Srinivasan et al. demonstrated the first in vivo SD-OCT of retinal IOS changes in rat retinas in 2006.126 Spatiotemporal OCT imaging revealed an increase in backscatter from the photoreceptor outer segments in rat retinas (Fig. 16). Recently, in vivo SD-OCT of retinal IOS changes in other animal127,128 and human129 retinas has been validated. Better study of IOS mechanisms and further development of functional OCT instruments promise depth-resolved assessment of retinal physiology at unprecedented resolution. Fig. 16In vivo OCT imaging of IOS changes in Long–Evans rat retinas. Dark-adapted and preadapted functional response time courses compared with the baseline response. Each data point corresponds to the amplitude reflectance from the photoreceptor outer segments averaged over a single volume. Each error bar () represents the standard deviation of the amplitude reflectance difference referenced to the stimulus onset (). Reprinted with permission from Ref. 126.  To achieve subcellular identification of IOS sources, we employed a custom-designed SD-OCT with subcellular spatial resolution in three dimensions () and millisecond temporal resolution (500 Hz).130,143 Equipped with a retinal stimulator and fundus camera, the custom-designed SD-OCT was employed for three-dimensional dissection of retinal IOSs in intact frogs. The integrated fundus camera can provide real time enface mapping to guide the transverse location of OCT B-scan recording (Fig. 17). As shown in Fig. 17(b1), the blood vessels around the optic nerve head (ONH) can be clearly observed, thus easily enabling localization of OCT B-scan imaging required for IOS measurement. Figure 17(b) illustrates an OCT B-scan image across the ONH. Figure 17(b3) shows comparative OCT and histological images of the frog retina with individual layers labeled. The custom-designed OCT provided subcellular resolution to separate photoreceptor outer/inner segments from other retinal layers and the supporting tissues, such as the choroid and sclera [Fig. 17(b3)]. An adaptive algorithm was developed to achieve a high SNR in a single-pass IOS recording. Fig. 17(a) Combined OCT and fundus imager. (b1) Fundus image revealed blood vessels around the optical nerve head (ONH). (b2) OCT B-scan image of the area marked by the red line in (b1). (b3) Histological image of the frog retina (left) and the corresponding OCT B-scan image with individual layers labeled (right). The red profile shows the averaged density along the layers, i.e., averaged A-scans. The outer segment region is marked in yellow dashed rectangles in both the histological image and OCT B-scan image. The OCT B-scan image contains both hyperreflective and hyporeflective bands. The B-scan image is displayed in a linear scale. NFL: nerve fiber layer, IPL: inner plexiform layer, INL: inner nuclear layer, OPL: outer plexiform layer, ELM: external limiting membrane, ISe: inner segment ellipsoid, IZ: interdigitation zone, RPE/BrM: retinal pigment epithelium/Bruch’s membrane. Scale bars indicate . Reprinted with permission from Ref. 130.  Transient IOSs, which might reflect an early stage of light phototransduction, are consistently observed at photoreceptor outer segments almost immediately () after retinal stimulation. This is consistent with the confocal IOS images shown in Figs. 7, 11, and 12. Comparative studies of dark- and light-adapted retinas demonstrate the feasibility of functional OCT mapping of rod and cone photoreceptors.130 As shown in Figs. 18(a) and 18(e), both positive and negative IOSs are consistently observed in adjacent retinal areas, which further confirmed that high resolution is essential for functional IOS imaging. Given the excellent OCT resolution in both transverse () and axial () directions, high sensitivity is ensured to achieve robust IOS recording from single-pass measurements [Figs. 18(a2) and 18(a3)], without an averaging requirement for multiple trials. In order to demonstrate the repeatability of the IOS recording, Fig. 18(c) illustrates averaged positive and negative IOSs of six recording trials from the same retina with identical stimulus parameters where both positive and negative IOSs occurred within 10 ms, with similar time courses [Fig. 18(d)]. In order to characterize the onset time of the observed IOSs, the OCT frame speed was increased to 500 Hz, with a reduced frame size () for the experiment represented in Fig. 19. With 2-ms temporal resolution, the IOSs were unambiguously detected as early as at 4 ms (Fig. 19). Fig. 18Spatiotemporal characterization of functional OCT-IOS imaging. A 10-ms flash stimulus was used for retinal stimulation of the frog eye. Raw OCT images were collected with a frame rate of 100 Hz. Stimulus onset is indicated by time “0.” OCT B-scan images are presented with a linear scale. (a1–a3) OCT B-scan images and spatial IOS image sequences of one control and two experimental groups. All the images were averaged over 10 frames (100 ms interval). Images consisted of , corresponding to . (b) Temporal curves of the number of activated (positive and negative) pixels corresponding to (a1–a3). (c) Temporal curves of positive and negative IOSs averaged from six recording trials. (d) To better visualize the signal onset time, an enlarged profile of the early 80 ms period from (c) is illustrated. (e) IOS distribution map superimposed on the OCT B-scan image. Positive signals (increasing reflectance) and negative signals (decreasing reflectance) are presented in red and green, respectively. Signal magnitude is not indicated in the image. (f) Comparative OCT-IOS and histological images of the outer retina. In the histological image, cone photoreceptors are highlighted in green or red to show cell sizes and locations. Cone photoreceptor OSs highlighted with red circles are located at the level of the rod ISe. Scale bars indicate . Reprinted with permission from Ref. 130.  Fig. 19Spatiotemporal characteristics of fast IOSs. A 10-ms flash stimulus was used for retinal stimulation of the frog eye. Raw OCT images were collected with a frame rate of 500 Hz. Stimulus onset is indicated by time “0.” (a) The OCT B-scan image consisted of , corresponding to . Illustrated OCT B-scan images are displayed with a linear scale. The IOS distribution map is superimposed on the OCT B-scan image. (b) Temporal curves of the averaged positive and negative IOSs. (c) To better visualize the IOS onset times, an enlarged profile of the early 14 ms period is illustrated. (d1–d6) Positive IOSs of individual pixels; both raw data (labeled with a star in red) and fitted curves (in blue) are shown. (d1) (, ) and (d2) (, ) were selected from the same axial location at adjacent locations in a lateral direction. (d3) (, ) and (d4) (, ) also share the same axial location but with different lateral positions. (d5) (, ) and (d6) (, ) are the same locations. (e1–e3) Negative IOSs of individual pixels; both raw data (labeled with a star in green) and fitted curve (in blue) are shown. (e1) (, ), (e2) (, ), and (e3) (, ) are from different locations. Scale bars indicate . Reprinted with permission from Ref. 130.  Figures 19(d) and 19(e) show the representative IOSs of individual pixels. It was observed that localized IOSs can have different time courses. For instance, the IOS at the position (, ) increased rapidly upon stimulation and reached the peak within 50 ms, while the IOS at position (, ) increased almost linearly after the stimulus. Again, both positive and negative IOSs were consistently observed in adjacent retinal areas. With short flash (10 ms) stimulation, transient IOSs were predominantly observed in the outer retina, although slow IOSs were sparsely observed in the inner retina [Fig. 20(a1)]. In contrast, prolonged (500 ms) stimulation evoked robust IOSs in both the outer and inner retinal layers (Fig. 20). As shown in Figs. 20(a1), 20(a2), 20(b1)–20(b3), and 20(c1)–20(c3), early phase IOSs were consistently confined to the outer retina; i.e., photoreceptor outer segments. After 1–2 s, later phase IOSs spread into the inner retina [Figs. 20(a2) and 20(c3)] with 500-ms prolonged stimulation. As shown in Fig. 20(e), the IOSs of photoreceptor outer segments occurred immediately after the stimulus onset underwent sharp changes at first and then linear changes until reaching a plateau [Fig. 20(e4)]. However, the onset time of IOSs in inner retinal layers, such as the IPL and OPL, was delayed to [Figs. 20(e1)–20(e2)]. Fig. 20Spatiotemporal characterization of functional OCT-IOS imaging of frog retina with prolonged recording times. OCT B-scan images were collected with a frame rate of 100 Hz. (a1, a2) Spatial IOS image sequence averaged over 100 frames (1000 ms interval) with 10 ms stimulation and 500 ms stimulation. OCT B-scan image and OCT-IOS images at 0 to 1, 2 to 3, and 4 to 5 s with (b1–b3) 10 ms stimulation and (c1–c3) 500 ms stimulation. The corresponding individual temporal curves of averaged positive and negative IOSs from IPL, OPL, ISe, OS, and RPE/BrM with (d1–d5) 10 ms stimulation and (e1–e5) 500 ms stimulation. IOSs in (d) and (e) show sharp changes first and then linear changes until they reached a plateau. Scale bars indicate . Reprinted with permission from Ref. 130.  6.DiscussionPhototransduction associated IOSs were first observed in ROS suspensions and isolated retinas (Fig. 3). The ROS suspensions provided a simple preparation to investigate rhodopsin, binding, and dissociation signals,100 which are important for understanding phototransduction processes in retinal photoreceptors.109 The morphological structure and physiological function of an intact retina are much more complicated compared to that of the ROS suspension. Light-evoked IOSs have been observed in both retinal photoreceptor and inner retinal layers. The IOSs observed in the retinal photoreceptor layer can be reasonably linked to light changes observed in ROS suspensions, although the integral effect of multiple IOS sources is relatively complicated. High-resolution transmission microscopy revealed positive and negative IOSs in adjacent areas (Fig. 5). This implies that spatial resolution is important for the sensitivity of IOS imaging. Without the necessary resolution to separate positive and negative IOSs, the recording sensitivity can be adjusted due to the integral effect of the IOSs with opposite polarities. High-speed confocal ophthalmoscopy has been developed to conduct in vivo IOS imaging of intact animals (Fig. 12). It is generally believed that retinal photoreceptors are highly scattering and can dominate the confocal signal when an unambiguous photoreceptor mosaic is observed. Comparative ERG study supported the confocal IOS being predominantly attributed to retinal photoreceptors (Fig. 13). In vivo functional OCT imaging further confirmed retinal photoreceptors as a primary source of the positive and negative IOSs (Fig. 18). Functional OCT imaging of dark- and light-adapted frog retinas has demonstrated the potential of functional IOS mapping of rod and cone photoreceptors.130 There are several mechanisms that may explain the IOSs with mixed polarities (positive and negative). As shown in Fig. 3(a), both binding and release of G-proteins to photoexcited rhodopsin might contribute to the positive (increasing) and negative (decreasing) IOSs.54 Localized biochemical processes might also produce transient refractive index changes, and thus produce positive and negative IOSs in adjacent areas. Photoreceptor outer segment disk swelling/shrinkage has been proposed to interpret the IOSs observed in ROS suspensions,96,97,102 which may also contribute to the IOSs observed in the photoreceptor layer of intact retinas. The rod photoreceptors have been proposed as the dominant source of the IOSs observed in isolated retinas. Recently, high spatiotemporal resolution imaging revealed transient phototropic changes in mouse and frog retinas activated by oblique light stimulation.103 Quantitative analysis indicated that the transient phototropic change was predominated by rod photoreceptors. Subsequent OCT examination revealed photoreceptor outer segments as the primary source of the transient phototropic change,104 which might be reasonably linked to the rod disk swelling/shrinkage associated IOSs. The transient rod phototropism may provide a unique biomarker for functional mapping of rod physiology at high resolution, promising a new method for early disease detection and improved treatment of AMD and other eye diseases that can cause photoreceptor damage. It is well established that the rod photoreceptors are more vulnerable than cone photoreceptors at the onset stage of AMD.7,8 Currently, there is no established strategy to allow objective assessment of localized rod dysfunctions at high resolution. Moreover, the transient rod phototropism may also provide valuable information for better understanding of the nature of the Stiles–Crawford effect (SCE). The SCE is known to be predominantly observed in cone photoreceptors. However, why the SCE is absent in rod photoreceptors is still a mystery. Since the transient rod phototropism can rapidly (onset: for frog and 5 ms for mouse; time to peak: for frog; and 30 ms for mouse103) follow the direction of the visible light, it might quickly compensate for the loss of luminous efficiency due to oblique illumination. In contrast, such directional movement was negligible in retinal cones.103 Functional OCT has also revealed additional IOSs in inner retinal layers (Fig. 20). Compared to the IOSs of the outer retina, the IOSs of the inner retina showed relatively slow time courses. The delayed IOS response in the inner retina is consistent with early study of living retinal tissues.118 The observed slow IOSs in the inner retina may involve complications of nonlinear information processing and retinal adaptation mechanisms, and may also be partially attributed to stimulus-evoked hemodynamic changes.128 Improved imaging speed, with enhanced SNR, is required to record action potentials associated with fast IOSs of inner retinal neurons, such as ganglion cells. Currently, it is still challenging to detect fast IOSs directly correlated with action potentials. Ganglion cells consist of many subtypes regarding morphology and density receptive field properties, and resolution is still far below the axon diameter propagation at various speeds. Thus, IOSs may be canceling each other out and/or have a complexity that needs adequate stimulus protocols to dissect. Better investigation of the IOS sources and mechanisms in the inner retina may lead to a new method to advance the study and diagnosis of glaucoma and other eye diseases that may affect inner retinal function. In vivo IOS imaging of human retinas has been explored using conventional fundus,119 AO,123–125 and OCT129 instruments. While these pilot studies have produced promising IOS results, reliable mapping of fast IOSs tightly correlated with electrophysiological changes of human retinas is still challenging. The dominant challenge is potential contamination of stimulus-associated metabolic changes and eye movements with fast IOS imaging. Recent studies suggested that dynamic differential IOS data processing can provide a practical strategy to reduce the effect of metabolic and hemodynamic changes.71,144 Rapid line-scan71 and functional OCT130 of intact frogs have proven that accurate image registrations can correct subpixel level eye movements. Further integration of dynamic eye tracking system in the confocal and OCT imagers may compensate for eye movements of human subjects.145 Additional integration of AO123–125 and super-resolution146,147 imaging techniques may enhance the IOS sensitivity and specificity. 7.ConclusionMultiple IOS sources exist in the outer and inner retinal layers. To date, rapid line-scan confocal and functional OCT instruments have allowed robust in vivo observation of transient IOS changes in retinal photoreceptors of intact animals. We expect that better instrument and software improvements of the line-scan and functional OCT instruments may provide a feasible solution to pursue functional IOS mapping of human retinal photoreceptors. Further improvements, such as imaging speed, contrast, and SNR, of the IOS imaging technology are required to enable reliable mapping of the inner retinal physiology. AcknowledgmentsThis research was supported in part by NSF CBET-1055889, NIH R01 EY023522, NIH R01 EY024628, and NIH P30 EY001792. ReferencesH. Kolb,
“Simple Anatomy of the Retina by Helga Kolb,”
(2011) http://webvision.med.utah.edu/book/part-i-foundations/simple-anatomy-of-the-retina/ August 2015). Google Scholar
R. E. Hogg and U. Chakravarthy,
“Visual function and dysfunction in early and late age-related maculopathy,”
Prog. Retinal Eye Res., 25 249
–276
(2006). http://dx.doi.org/10.1016/j.preteyeres.2005.11.002 PRTRES 1350-9462 Google Scholar
R. W. Nickells,
“Ganglion cell death in glaucoma: from mice to men,”
Vet. Ophthalmol., 10
(Suppl 1), 88
–94
(2007). http://dx.doi.org/10.1111/j.1463-5224.2007.00564.x Google Scholar
R. S. Harwerth and H. A. Quigley,
“Visual field defects and retinal ganglion cell losses in patients with glaucoma,”
Arch. Ophthalmol., 124 853
–859
(2006). http://dx.doi.org/10.1001/archopht.124.6.853 AROPAW 0003-9950 Google Scholar
B. Meyer-Rusenberg et al.,
“Pathological changes in human retinal ganglion cells associated with diabetic and hypertensive retinopathy,”
Graefes Arch. Clin. Exp. Ophthalmol., 245 1009
–1018
(2007). http://dx.doi.org/10.1007/s00417-006-0489-x Google Scholar
Y. W. Qin, G. Z. Xu and W. J. Wang,
“Dendritic abnormalities in retinal ganglion cells of three-month diabetic rats,”
Curr. Eye Res., 31 967
–974
(2006). http://dx.doi.org/10.1080/02713680600987674 CEYRDM 0271-3683 Google Scholar
C. Owsley et al.,
“Cone- and rod-mediated dark adaptation impairment in age-related maculopathy,”
Ophthalmology, 114 1728
–1735
(2007). http://dx.doi.org/10.1016/j.ophtha.2006.12.023 OPANEW 0743-751X Google Scholar
C. A. Curcio, N. E. Medeiros and C. L. Millican,
“Photoreceptor loss in age-related macular degeneration,”
Invest. Ophthalmol. Visual Sci., 37 1236
–1249
(1996). Google Scholar
L. A. Yannuzzi et al.,
“Ophthalmic fundus imaging: today and beyond,”
Am. J. Ophthalmol., 137 511
–524
(2004). http://dx.doi.org/10.1016/j.ajo.2003.12.035 AJOPAA 0002-9394 Google Scholar
A. Manivannan et al.,
“Digital fundus imaging using a scanning laser ophthalmoscope,”
Physiol. Meas., 14 43
–56
(1993). http://dx.doi.org/10.1088/0967-3334/14/1/006 Google Scholar
D. X. Hammer et al.,
“Angiography with a multifunctional line scanning ophthalmoscope,”
J. Biomed. Opt., 17 026008
(2012). http://dx.doi.org/10.1117/1.JBO.17.2.026008 JBOPFO 1083-3668 Google Scholar
D. X. Hammer et al.,
“Line-scanning laser ophthalmoscope,”
J. Biomed. Opt., 11 041126
(2006). http://dx.doi.org/10.1117/1.2335470 JBOPFO 1083-3668 Google Scholar
P. F. Sharp and A. Manivannan,
“The scanning laser ophthalmoscope,”
Phys. Med. Biol., 42 951
–966
(1997). http://dx.doi.org/10.1088/0031-9155/42/5/014 PHMBA7 0031-9155 Google Scholar
K. Kobayashi and T. Asakura,
“Imaging techniques and applications of the scanning laser ophthalmoscope,”
Opt. Eng., 34
(3), 717
–726
(1995). http://dx.doi.org/10.1117/12.193293 Google Scholar
J. Z. Liang, D. R. Williams and D. T. Miller,
“High resolution imaging of the living human retina with adaptive optics,”
Invest. Ophthalmol. Vis. Sci., 38 55
–55
(1997). Google Scholar
K. S. K. Wong et al.,
“In vivo imaging of human photoreceptor mosaic with wavefront sensorless adaptive optics optical coherence tomography,”
Biomed. Opt. Express, 6 580
–590
(2015). http://dx.doi.org/10.1364/BOE.6.000580 BOEICL 2156-7085 Google Scholar
R. Battu et al.,
“Adaptive optics imaging of the retina,”
Indian J. Ophthalmol., 62 60
–65
(2014). http://dx.doi.org/10.4103/0301-4738.126185 Google Scholar
A. Pallikaris,
“Adaptive optics ophthalmoscopy: results and applications,”
J. Refract. Surg., 21 S570
–S574
(2005). Google Scholar
A. Roorda and D. R. Williams,
“The arrangement of the three cone classes in the living human eye,”
Nature, 397 520
–522
(1999). http://dx.doi.org/10.1038/17383 Google Scholar
D. Huang et al.,
“Optical coherence tomography,”
Science, 254 1178
–1181
(1991). http://dx.doi.org/10.1126/science.1957169 SCIEAS 0036-8075 Google Scholar
J. Y. Lee et al.,
“Optical coherence tomography in Parkinson’s disease: Is the retina a biomarker?,,”
J. Parkinson Dis., 4 197
–204
(2014). http://dx.doi.org/10.3233/JPD-130306 Google Scholar
D. S. Chauhan and J. Marshall,
“The interpretation of optical coherence tomography images of the retina,”
Invest. Ophthalmol. Visual Sci., 40 2332
–2342
(1999). Google Scholar
H. M. Pakter et al.,
“Analysis of optical coherence tomography nerve fiber layer thickness and Heidelberg retina tomography optic nerve bead measurements over time in a glaucoma monkey model,”
Invest. Ophthalmol. Vis. Sci., 40 S660
–S660
(1999). Google Scholar
M. R. Hee et al.,
“Optical coherence tomography of the human retina,”
Arch. Ophthalmol., 113 325
–332
(1995). http://dx.doi.org/10.1001/archopht.1995.01100030081025 Google Scholar
J. A. Izatt et al.,
“In vivo imaging of the human retina with optical coherence tomography,”
Invest. Ophthalmol. Vis. Sci., 34 761
–761
(1993). Google Scholar
R. W. Lu et al.,
“Investigation of the hyper-reflective inner/outer segment band in optical coherence tomography of living frog retina,”
J. Biomed. Opt., 17 060504
(2012). http://dx.doi.org/10.1117/1.JBO.17.6.060504 JBOPFO 1083-3668 Google Scholar
R. F. Spaide and C. A. Curcio,
“Anatomical correlates to the bands seen in the outer retina by optical coherence tomography literature review and model,”
Retina, 31 1609
–1619
(2011). http://dx.doi.org/10.1097/IAE.0b013e3182247535 Google Scholar
B. Falsini et al.,
“Structure-function relationship in ocular hypertension and glaucoma: interindividual and interocular analysis by OCT and pattern ERG,”
Graefes Arch. Clin. Exp. Ophthalmol., 246
(8), 1153
–1162
(2008). http://dx.doi.org/10.1007/s00417-008-0808-5 Google Scholar
A. Oishi et al.,
“Retinal nerve fiber layer thickness in patients with retinitis pigmentosa,”
Eye,
(2008). http://dx.doi.org/10.1038/eye.2008.63 12ZYAS 0950-222X Google Scholar
R. Klein et al.,
“The relationship of age-related maculopathy, cataract, and glaucoma to visual acuity,”
Invest. Ophthalmol. Vis. Sci., 36 182
–191
(1995). Google Scholar
J. Siderov and A. L. Tiu,
“Variability of measurements of visual acuity in a large eye clinic,”
Acta Ophthalmol. Scand., 77 673
–676
(1999). http://dx.doi.org/10.1034/j.1600-0420.1999.770613.x Google Scholar
A. Loewenstein et al.,
“Replacing the Amsler grid: a new method for monitoring patients with age-related macular degeneration,”
Ophthalmology, 110 966
–970
(2003). http://dx.doi.org/10.1016/S0161-6420(03)00074-5 OPANEW 0743-751X Google Scholar
J. S. Steinberg et al.,
“Scotopic and photopic microperimetry in patients with reticular drusen and age-related macular degeneration,”
JAMA Ophthalmol., 133 690
–697
(2015). http://dx.doi.org/10.1001/jamaophthalmol.2015.0477 Google Scholar
R. Forte et al.,
“Microperimetry of subretinal drusenoid deposits,”
Ophthal. Res., 51 32
–36
(2014). http://dx.doi.org/10.1159/000354117 OPRSAQ 0030-3747 Google Scholar
C. Ozgonul, G. Gokce and T. Mumcuoglu,
“Microperimetry findings in a patient with macular edema secondary to retinitis pigmentosa,”
Ophthalmologica, 232 28
–29
(2014). http://dx.doi.org/10.1159/000357980 OPHTAD 0030-3755 Google Scholar
E. N. Wong, Y. J. Khoo and F. K. Chen,
“Microperimetry in a range of macular pathology,”
Clin. Exp. Ophthalmol., 41 50
–50
(2013). http://dx.doi.org/10.1111/j.1442-9071.2012.02817.x Google Scholar
H. P. Scholl and E. Zrenner,
“Electrophysiology in the investigation of acquired retinal disorders,”
Surv. Ophthalmol., 45 29
–47
(2000). http://dx.doi.org/10.1016/S0039-6257(00)00125-9 SUOPAD 0039-6257 Google Scholar
W. H. Seiple et al.,
“Evaluating macular function using the focal ERG,”
Invest. Ophthalmol. Vis. Sci., 27 1123
–1130
(1986). Google Scholar
Vaegan et al.,
“Macular electroretinograms: their accuracy, specificity and implementation for clinical use,”
Aust. J. Ophthalmol., 12 359
–372
(1984). http://dx.doi.org/10.1111/j.1442-9071.1984.tb01182.x AJOHBL 0310-1177 Google Scholar
G. E. Fish and D. G. Birch,
“The focal electroretinogram in the clinical assessment of macular disease,”
Ophthalmology, 96 109
–114
(1989). http://dx.doi.org/10.1016/S0161-6420(89)32944-7 OPANEW 0743-751X Google Scholar
A. Binns and T. H. Margrain,
“Development of a technique for recording the focal rod ERG,”
Ophthalmic Physiol. Opt., 26 71
–79
(2006). http://dx.doi.org/10.1111/j.1475-1313.2005.00355.x OPOPD5 0275-5408 Google Scholar
A. Binns and T. H. Margrain,
“Evaluation of retinal function using the dynamic focal cone ERG,”
Ophthal. Physiol. Opt., 25 492
–500
(2005). http://dx.doi.org/10.1111/j.1475-1313.2005.00338.x OPOPD5 0275-5408 Google Scholar
D. C. Hood et al.,
“The multifocal electroretinogram,”
J. Neuroophthalmol., 23 225
–235
(2003). http://dx.doi.org/10.1097/00041327-200309000-00008 Google Scholar
D. C. Hood,
“Assessing retinal function with the multifocal technique,”
Prog. Retinal Eye Res., 19 607
–646
(2000). http://dx.doi.org/10.1016/S1350-9462(00)00013-6 PRTRES 1350-9462 Google Scholar
S. G. Jacobson et al.,
“Disease expression of RP1 mutations causing autosomal dominant retinitis pigmentosa,”
Invest. Ophthalmol. Vis. Sci., 41 1898
–1908
(2000). Google Scholar
Y. C. Li et al.,
“Intrinsic optical signal imaging of glucose-stimulated insulin secreting beta-cells,”
Opt. Express, 19 99
–106
(2011). http://dx.doi.org/10.1364/OE.19.000099 Google Scholar
X. C. Yao et al.,
“Functional imaging of glucose-evoked rat islet activities using transient intrinsic optical signals,”
J. Mod. Opt., 59 843
–847
(2012). http://dx.doi.org/10.1080/09500340.2012.674564 JMOPEW 0950-0340 Google Scholar
A. Grinvald et al.,
“Functional architecture of cortex revealed by optical imaging of intrinsic signals,”
Nature, 324 361
–364
(1986). http://dx.doi.org/10.1038/324361a0 Google Scholar
B. Chance et al.,
“Optical investigations of physiology: a study of intrinsic and extrinsic biomedical contrast,”
Philos. Trans. R. Soc. London B Biol. Sci., 352 707
–716
(1997). http://dx.doi.org/10.1098/rstb.1997.0053 Google Scholar
D. M. Rector et al.,
“Spatio-temporal mapping of rat whisker barrels with fast scattered light signals,”
Neuroimage, 26 619
–627
(2005). http://dx.doi.org/10.1016/j.neuroimage.2005.02.030 NEIMEF 1053-8119 Google Scholar
Y. Hoshi et al.,
“Visuospatial imagery is a fruitful strategy for the digit span backward task: a study with near-infrared optical tomography,”
Brain Res. Cogn. Brain Res., 9 339
–342
(2000). http://dx.doi.org/10.1016/S0926-6410(00)00006-9 Google Scholar
H. H. Harary, J. E. Brown and L. H. Pinto,
“Rapid light-induced changes in near infrared transmission of rods in Bufo marinus,”
Science, 202 1083
–1085
(1978). http://dx.doi.org/10.1126/science.102035 SCIEAS 0036-8075 Google Scholar
M. W. Kaplan,
“Concurrent birefringence and forward light-scattering measurements of flash-bleached rod outer segments,”
J. Opt. Soc. Am., 71 1467
–1471
(1981). http://dx.doi.org/10.1364/JOSA.71.001467 JOSAAH 0030-3941 Google Scholar
H. Kuhn et al.,
“Interactions between photoexcited rhodopsin and GTP-binding protein: kinetic and stoichiometric analyses from light-scattering changes,”
Proc. Natl. Acad. Sci., 78 6873
–6877
(1981). http://dx.doi.org/10.1073/pnas.78.11.6873 Google Scholar
T. Akimoto,
“Light-induced transmission changes in isolated vertebrate retinas,”
Vision Res., 22 1093
–1096
(1982). http://dx.doi.org/10.1016/0042-6989(82)90072-4 VISRAM 0042-6989 Google Scholar
J. W. Lewis et al.,
“Sensitive light scattering probe of enzymatic processes in retinal rod photoreceptor membranes,”
Proc. Natl. Acad. Sci., 81 743
–747
(1984). http://dx.doi.org/10.1073/pnas.81.3.743 Google Scholar
R. Uhl, H. Desel and R. Wagner,
“Separation and characterisation of light scattering transients from rod outer segments of vertebrate photoreceptors: design and performance of a multi angle flash photolysis apparatus (MAFPA),”
J. Biochem. Biophys. Methods, 11 31
–43
(1985). http://dx.doi.org/10.1016/0165-022X(85)90039-9 JBBMDG 0165-022X Google Scholar
D. R. Pepperberg et al.,
“Photic modulation of a highly sensitive, near-infrared light-scattering signal recorded from intact retinal photoreceptors,”
Proc. Natl. Acad. Sci., 85 5531
–5535
(1988). http://dx.doi.org/10.1073/pnas.85.15.5531 Google Scholar
M. Kahlert, D. R. Pepperberg and K. P. Hofmann,
“Effect of bleached rhodopsin on signal amplification in rod visual receptors,”
Nature, 345 537
–539
(1990). http://dx.doi.org/10.1038/345537a0 Google Scholar
N. Bennett and A. Clerc,
“Cgmp phosphodiesterase dependent light-induced scattering changes in suspensions of retinal disk membranes,”
Biochemstry, 31 1858
–1866
(1992). http://dx.doi.org/10.1021/bi00121a039 Google Scholar
S. M. Dawis and M. Rossetto,
“Light-evoked changes in near-infrared transmission by the on and off channels of the anuran retina,”
Vis. Neurosci., 10 687
–692
(1993). http://dx.doi.org/10.1017/S0952523800005381 VNEUEY Google Scholar
A. Akhlagh Moayed et al.,
“Correlation of visually evoked intrinsic optical signals and electroretinograms recorded from chicken retina with a combined functional optical coherence tomography and electroretinography system,”
J. Biomed. Opt., 17 016011
(2012). http://dx.doi.org/10.1117/1.JBO.17.1.016011 Google Scholar
L. B. Cohen, R. D. Keynes and B. Hille,
“Light scattering and birefringence changes during nerve activity,”
Nature, 218 438
–441
(1968). http://dx.doi.org/10.1038/218438a0 Google Scholar
R. W. Lu, Q. X. Zhang and X. C. Yao,
“Circular polarization intrinsic optical signal recording of stimulus-evoked neural activity,”
Opt. Lett., 36 1866
–1868
(2011). http://dx.doi.org/10.1364/OL.36.001866 Google Scholar
J. L. Schei et al.,
“Action potential propagation imaged with high temporal resolution near-infrared video microscopy and polarized light,”
Neuroimage, 40 1034
–1043
(2008). http://dx.doi.org/10.1016/j.neuroimage.2007.12.055 NEIMEF 1053-8119 Google Scholar
X. C. Yao et al.,
“Cross-polarized reflected light measurement of fast optical responses associated with neural activation,”
Biophys. J., 88 4170
–4177
(2005). http://dx.doi.org/10.1529/biophysj.104.052506 BIOJAU 0006-3495 Google Scholar
X. C. Yao and Y. B. Zhao,
“Optical dissection of stimulus-evoked retinal activation,”
Opt. Express, 16 12446
–12459
(2008). http://dx.doi.org/10.1364/OE.16.012446 OPEXFF 1094-4087 Google Scholar
X. C. Yao et al.,
“Rapid optical coherence tomography and recording functional scattering changes from activated frog retina,”
Appl. Opt., 44 2019
–2023
(2005). http://dx.doi.org/10.1364/AO.44.002019 APOPAI 0003-6935 Google Scholar
X. C. Yao, L. Liu and Y. G. Li,
“Intrinsic optical signal imaging of retinal activity in frog eye,”
J. Innov. Opt. Health Sci., 2 201
–208
(2009). http://dx.doi.org/10.1142/S1793545809000462 Google Scholar
Q. X. Zhang et al.,
“Comparative intrinsic optical signal imaging of wild-type and mutant mouse retinas,”
Opt. Express, 20 7646
–7654
(2012). http://dx.doi.org/10.1364/OE.20.007646 Google Scholar
Q. X. Zhang et al.,
“In vivo confocal intrinsic optical signal identification of localized retinal dysfunction,”
Invest. Ophthalmol. Vis. Sci., 53 8139
–8145
(2012). http://dx.doi.org/10.1167/iovs.12-10732 Google Scholar
D. A. Nelson et al.,
“Special report: noninvasive multi-parameter functional optical imaging of the eye,”
Ophthalmic. Surg. Lasers Imaging, 36 57
–66
(2005). Google Scholar
I. Tasaki et al.,
“Changes in fluorescence, turbidity, and birefringence associated with nerve excitation,”
Proc. Natl. Acad. Sci., 61 883
–888
(1968). http://dx.doi.org/10.1073/pnas.61.3.883 Google Scholar
L. B. Cohen, B. Hille and R. D. Keynes,
“Changes in axon birefringence during action potential,”
J. Physiol., 211 495
(1970). http://dx.doi.org/10.1113/jphysiol.1970.sp009289 Google Scholar
M. P. Kristensen et al.,
“State-dependent cellular activity patterns of the cat paraventricular hypothalamus measured by reflectance imaging,”
Brain Res., 727 107
–117
(1996). http://dx.doi.org/10.1016/0006-8993(96)00360-5 BRREAP 0006-8993 Google Scholar
G. R. Poe et al.,
“Concurrent reflectance imaging and microdialysis in the freely behaving cat,”
J. Neurosci. Methods, 65 143
–149
(1996). http://dx.doi.org/10.1016/0165-0270(95)00156-5 Google Scholar
D. M. Rector, G. R. Poe and R. M. Harper,
“Imaging of hippocampal and neocortical neural activity following intravenous cocaine administration in freely behaving cats,”
Neuroscience, 54 633
–641
(1993). http://dx.doi.org/10.1016/0306-4522(93)90234-7 Google Scholar
K. E. Mathewson et al.,
“Dynamics of alpha control: preparatory suppression of posterior alpha oscillations by frontal modulators revealed with combined EEG and event-related optical signal,”
J. Cognit. Neurosci., 26 2400
–2415
(2014). http://dx.doi.org/10.1162/jocn_a_00637 Google Scholar
D. M. Rector et al.,
“In-vivo observations of rapid scattered light changes associated with neurophysiological activity,”
In-Vivo Optical Imaging of Brain Function, 143
–170 2nd ed.CRC Press, Boca Raton, Florida
(2009). Google Scholar
L. B. Cohen and R. D. Keynes,
“Evidence for structural changes during the action potential in nerves from the walking legs of Maia squinado,”
J. Physiol., 194 85
–86P
(1968). Google Scholar
X. C. Yao, D. M. Rector and J. S. George,
“Optical lever recording of displacements from activated lobster nerve bundles and Nitella internodes,”
Appl. Opt., 42 2972
–2978
(2003). http://dx.doi.org/10.1364/AO.42.002972 APOPAI 0003-6935 Google Scholar
D. Landowne,
“Molecular-motion underlying activation and inactivation of sodium-channels in squid giant-axons,”
J. Membrane Biol., 88 173
–185
(1985). http://dx.doi.org/10.1007/BF01868431 Google Scholar
I. Tasaki and P. M. Byrne,
“The origin of rapid changes in birefringence, light-scattering and dye absorbency associated with excitation of nerve-fibers,”
Jpn. J. Physiol., 43 S67
–S75
(1993). http://dx.doi.org/10.2170/jjphysiol.43.67 Google Scholar
A. J. Foust, R. M. Beiu and D. M. Rector,
“Optimized birefringence changes during isolated nerve activation,”
Appl. Opt., 44 2008
–2012
(2005). http://dx.doi.org/10.1364/AO.44.002008 APOPAI 0003-6935 Google Scholar
A. J. Foust and D. M. Rector,
“Optically teasing apart neural swelling and depolarization,”
Neuroscience, 145 887
–899
(2007). http://dx.doi.org/10.1016/j.neuroscience.2006.12.068 Google Scholar
K. O. Donner and T. Reuter,
“Dark-adaptation processes in the rhodopsin rods of the frog’s retina,”
Vision Res., 7 17
–41
(1967). http://dx.doi.org/10.1016/0042-6989(67)90023-5 VISRAM 0042-6989 Google Scholar
K. A. Lee et al.,
“Relationships among visual cycle retinoids, rhodopsin phosphorylation, and phototransduction in mouse eyes during light and dark adaptation,”
Biochemistry, 49 2454
–2463
(2010). http://dx.doi.org/10.1021/bi1001085 Google Scholar
D. R. Pepperberg,
“Rhodopsin and visual adaptation: analysis of photoreceptor thresholds in the isolated skate retina,”
Vision Res., 24 357
–366
(1984). http://dx.doi.org/10.1016/0042-6989(84)90061-0 VISRAM 0042-6989 Google Scholar
M. Catt, W. Ernst and C. M. Kemp,
“The links between rhodopsin bleaching and visual adaptation,”
Biochem. Soc. Trans., 10 343
–345
(1982). http://dx.doi.org/10.1042/bst0100343 Google Scholar
K. O. Donner and T. Reuter,
“Visual adaptation of the rhodopsin rods in the frogs retina,”
J. Physiol., 199 59
–87
(1968). http://dx.doi.org/10.1113/jphysiol.1968.sp008639 Google Scholar
C. Baumann and H. Scheibner,
“The dark adaptation of single units in the isolated frog retina following partial bleaching of rhodopsin,”
Vision Res., 8 1127
–1138
(1968). http://dx.doi.org/10.1016/0042-6989(68)90022-9 VISRAM 0042-6989 Google Scholar
R. N. Frank and J. E. Dowling,
“Rhodopsin photoproducts: effects on electroretinogram sensitivity in isolated perfused rat retina,”
Science, 161 487
–489
(1968). http://dx.doi.org/10.1126/science.161.3840.487 SCIEAS 0036-8075 Google Scholar
R. N. Frank,
“Photoproducts of rhodopsin bleaching in the isolated, perfused frog retina,”
Vision Res., 9 1415
–1433
(1969). http://dx.doi.org/10.1016/0042-6989(69)90058-3 VISRAM 0042-6989 Google Scholar
C. Baumann and S. Bender,
“Kinetics of rhodopsin bleaching in the isolated human retina,”
J. Physiol., 235 761
–773
(1973). http://dx.doi.org/10.1113/jphysiol.1973.sp010415 Google Scholar
G. P. Brierley et al.,
“On the permeability of isolated bovine retinal outer segment fragments,”
Biochim. Biophys. Acta Biomembr., 163 117
–120
(1968). http://dx.doi.org/10.1016/0005-2736(68)90041-2 Google Scholar
H. Asai et al.,
“A light-induced conformational change in rod photoreceptor disc membrane,”
Exp. Eye Res., 21 259
–267
(1975). http://dx.doi.org/10.1016/0014-4835(75)90097-4 EXERA6 0014-4835 Google Scholar
D. G. McConnell,
“Relationship of the light-induced proton uptake in bovine retinal outer segment fragments to triton-induced membrane disruption and to volume changes,”
J. Biol. Chem., 250 1898
–1906
(1975). Google Scholar
K. P. Hofmann et al.,
“Measurements on fast light-induced light-scattering and absorption changes in outer segments of vertebrate light sensitive rod cells,”
Biophys. Struct. Mech., 2 61
–77
(1976). http://dx.doi.org/10.1007/BF00535653 BSMHBH 0340-1057 Google Scholar
C. L. Wey, P. L. Ahl and R. A. Cone,
“Bacteriorhodopsin induces a light-scattering change in Halobacterium halobium,”
J. Cell Biol., 79 657
–662
(1978). http://dx.doi.org/10.1083/jcb.79.3.657 Google Scholar
M. Michelvillaz et al.,
“Physical analysis of light-scattering changes in bovine photoreceptor membrane suspensions,”
Biophys. J., 46 655
–662
(1984). http://dx.doi.org/10.1016/S0006-3495(84)84064-3 BIOJAU 0006-3495 Google Scholar
N. Bennett,
“Light-induced interactions between rhodopsin and the GTP-binding protein relation with phosphodiesterase activation,”
Eur. J. Biochem., 123 133
–139
(1982). http://dx.doi.org/10.1111/j.1432-1033.1982.tb06509.x EJBCAI 0014-2956 Google Scholar
R. Uhl, K. P. Hofmann and W. Kreutz,
“Measurement of fast light-induced disc shrinkage within bovine rod outer segments by means of a light-scattering transient,”
Biochim. Biophys. Acta, 469 113
–122
(1977). http://dx.doi.org/10.1016/0005-2736(77)90174-2 Google Scholar
R. W. Lu et al.,
“Dynamic near infrared imaging reveals transient phototropic change in retinal rod photoreceptors,”
J. Biomed. Opt., 18 106013
(2013). http://dx.doi.org/10.1117/1.JBO.18.10.106013 Google Scholar
B. Q. Wang et al.,
“Functional optical coherence tomography reveals transient phototropic change of photoreceptor outer segments,”
Opt. Lett., 39 6923
–6926
(2014). http://dx.doi.org/10.1364/OL.39.006923 OPLEDP 0146-9592 Google Scholar
P. A. Liebman et al.,
“Membrane structure changes in rod outer segments associated with rhodopsin bleaching,”
Nature, 251 31
–36
(1974). http://dx.doi.org/10.1038/251031a0 Google Scholar
M. W. Kaplan and P. A. Liebman,
“Slow bleach-induced birefringence changes in rod outer segments,”
J. Physiol., 265 657
–672
(1977). http://dx.doi.org/10.1113/jphysiol.1977.sp011736 Google Scholar
M. W. Kaplan,
“Modeling the rod outer segment birefringence change correlated with metarhodopsin II formation,”
Biophys. J., 38 237
–241
(1982). http://dx.doi.org/10.1016/S0006-3495(82)84554-2 Google Scholar
M. Kahlert and K. P. Hofmann,
“Reaction-rate and collisional efficiency of the rhodopsin-transducin system in intact retinal rods,”
Biophys. J., 59 375
–386
(1991). http://dx.doi.org/10.1016/S0006-3495(91)82231-7 BIOJAU 0006-3495 Google Scholar
V. Y. Arshavsky, T. D. Lamb and E. N. Pugh,
“G proteins and phototransduction,”
Annu. Rev. Physiol., 64 153
–187
(2002). http://dx.doi.org/10.1146/annurev.physiol.64.082701.102229 Google Scholar
X. C. Yao and J. S. George,
“Near-infrared imaging of fast intrinsic optical responses in visible light-activated amphibian retina,”
J. Biomed. Opt., 11 064030
(2006). http://dx.doi.org/10.1117/1.2393155 Google Scholar
X. C. Yao and J. S. George,
“Dynamic neuroimaging of retinal light responses using fast intrinsic optical signals,”
NeuroImage, 33 898
–906
(2006). http://dx.doi.org/10.1016/j.neuroimage.2006.06.060 NEIMEF 1053-8119 Google Scholar
Q. X. Zhang et al.,
“Microlens array recording of localized retinal responses,”
Opt. Lett., 35 3838
–3840
(2010). http://dx.doi.org/10.1364/OL.35.003838 OPLEDP 0146-9592 Google Scholar
Y. G. Li et al.,
“High-speed line-scan confocal imaging of stimulus-evoked intrinsic optical signals in the retina,”
Opt. Lett., 35 426
–428
(2010). http://dx.doi.org/10.1364/OL.35.000426 OPLEDP 0146-9592 Google Scholar
K. Bizheva et al.,
“Optophysiology: depth-resolved probing of retinal physiology with functional ultrahigh-resolution optical coherence tomography,”
Proc. Natl. Acad. Sci., 103 5066
–5071
(2006). http://dx.doi.org/10.1073/pnas.0506997103 Google Scholar
B. Wang et al.,
“En face optical coherence tomography of transient light response at photoreceptor outer segments in living frog eyecup,”
Opt. Lett., 38 4526
–4529
(2013). http://dx.doi.org/10.1364/OL.38.004526 Google Scholar
X. C. Yao and Y. C. Li,
“Functional imaging of retinal photoreceptors and inner neurons using stimulus-evoked intrinsic optical signals,”
Methods Mol. Biol., 884 277
–285
(2012). http://dx.doi.org/10.1007/978-1-61779-848-1_20 Google Scholar
X. C. Yao,
“Intrinsic optical signal imaging of retinal activation,”
Jpn. J. Ophthalmol., 53 327
–333
(2009). http://dx.doi.org/10.1007/s10384-009-0685-4 JJOPA7 0021-5155 Google Scholar
Y. C. Li et al.,
“Parallel optical monitoring of visual signal propagation from the photoreceptors to the inner retina layers,”
Opt. Lett., 35 1810
–1812
(2010). http://dx.doi.org/10.1364/OL.35.001810 OPLEDP 0146-9592 Google Scholar
M. D. Abramoff et al.,
“Visual stimulus-induced changes in human near-infrared fundus reflectance,”
Invest. Ophthalmol. Vis. Sci., 47 715
–721
(2006). http://dx.doi.org/10.1167/iovs.05-0008 IOVSDA 0146-0404 Google Scholar
G. Hanazono et al.,
“Intrinsic signal imaging in macaque retina reveals different types of flash-induced light reflectance changes of different origins,”
Invest. Ophthalmol. Vis. Sci., 48 2903
–2912
(2007). JJOPA7 0021-5155 Google Scholar
D. Ts'o et al.,
“Noninvasive functional imaging of the retina reveals outer retinal and hemodynamic intrinsic optical signal origins,”
Jpn. J. Ophthalmol., 53 334
–344
(2009). Google Scholar
J. B. Schallek et al.,
“Retinal intrinsic optical signals in a cat model of primary congenital glaucoma,”
Invest. Ophthalmol. Vis. Sci., 53 1971
–1981
(2012). http://dx.doi.org/10.1167/iovs.11-8299 Google Scholar
R. S. Jonnal et al.,
“In vivo functional imaging of human cone photoreceptors,”
Opt. Express, 15 16141
–16160
(2007). http://dx.doi.org/10.1364/OE.15.016141 OPEXFF 1094-4087 Google Scholar
K. Grieve and A. Roorda,
“Intrinsic signals from human cone photoreceptors,”
Invest. Ophthalmol. Vis. Sci., 49 713
–719
(2008). http://dx.doi.org/10.1167/iovs.07-0837 Google Scholar
J. Rha et al.,
“Variable optical activation of human cone photoreceptors visualized using a short coherence light source,”
Opt. Lett., 34 3782
–3784
(2009). http://dx.doi.org/10.1364/OL.34.003782 OPLEDP 0146-9592 Google Scholar
V. J. Srinivasan et al.,
“In vivo measurement of retinal physiology with high-speed ultrahigh-resolution optical coherence tomography,”
Opt. Lett., 31 2308
–2310
(2006). http://dx.doi.org/10.1364/OL.31.002308 Google Scholar
A. A. Moayed et al.,
“In vivo imaging of intrinsic optical signals in chicken retina with functional optical coherence tomography,”
Opt. Lett., 36 4575
–4577
(2011). http://dx.doi.org/10.1364/OL.36.004575 Google Scholar
W. Suzuki et al.,
“Stimulus-induced changes of reflectivity detected by optical coherence tomography in macaque retina,”
Invest. Ophthalmol. Vis. Sci., 54 6345
–6354
(2013). http://dx.doi.org/10.1167/iovs.13-12381 Google Scholar
V. J. Srinivasan et al.,
“In vivo functional imaging of intrinsic scattering changes in the human retina with high-speed ultrahigh resolution OCT,”
Opt. Express, 17 3861
–3877
(2009). http://dx.doi.org/10.1364/OE.17.003861 Google Scholar
Q. Zhang et al.,
“Functional optical coherence tomography enables in vivo physiological assessment of retinal rod and cone photoreceptors,”
Sci. Rep., 5 9595
(2015). http://dx.doi.org/10.1038/srep09595 Google Scholar
J. Schallek et al.,
“Stimulus-evoked intrinsic optical signals in the retina: spatial and temporal characteristics,”
Invest. Ophthalmol. Vis. Sci., 50 4865
–4872
(2009). http://dx.doi.org/10.1167/iovs.08-3290 Google Scholar
Y. Hirohara et al.,
“Optical imaging of retina in response to grating stimuli in cats,”
Exp. Eye Res., 109C 1
–7
(2013). http://dx.doi.org/10.1016/j.exer.2013.01.007 Google Scholar
Q. X. Zhang et al.,
“In vivo confocal imaging of fast intrinsic optical signals correlated with frog retinal activation,”
Opt. Lett., 36 4692
–4694
(2011). http://dx.doi.org/10.1364/OL.36.004692 Google Scholar
G. Li et al.,
“On the use of schematic eye models to estimate retinal image quality,”
J. Biomed. Opt., 5
(3), 307
–314
(2000). http://dx.doi.org/10.1117/1.430001 JBOPFO 1083-3668 Google Scholar
S. E. Nilsson,
“An electron microscopic classification of the retinal receptors of the leopard frog (Rana Pipiens),”
J. Ultrastruct. Res., 10 390
–416
(1964). http://dx.doi.org/10.1016/S0022-5320(64)80018-6 JULRA7 0022-5320 Google Scholar
R. K. Wang et al.,
“Three dimensional optical angiography,”
Opt. Express, 15 4083
–4097
(2007). http://dx.doi.org/10.1364/OE.15.004083 Google Scholar
D. C. Hood and D. G. Birch,
“A quantitative measure of the electrical activity of human rod photoreceptors using electroretinography,”
Vis. Neurosci., 5 379
–387
(1990). http://dx.doi.org/10.1017/S0952523800000468 VNEUEY Google Scholar
I. Perlman,
“The Electroretinogram: ERG by Ido Perlman,”
(2015) http://webvision.med.utah.edu/book/electrophysiology/the-electroretinogram-erg/ August 2015). Google Scholar
D. J. Creel,
“The electroretinogram and electro-oculogram: clinical applications,”
(2015). http://webvision.med.utah.edu/book/electrophysiology/the-electroretinogram-clinical-applications/ Google Scholar
D. C. Hood and D. G. Birch,
“Human cone receptor activity: the leading edge of the a-wave and models of receptor activity,”
Vis. Neurosci., 10 857
–871
(1993). http://dx.doi.org/10.1017/S0952523800006076 VNEUEY Google Scholar
A. A. Paupoo et al.,
“Human cone photoreceptor responses measured by the electroretinogram [correction of electoretinogram] a-wave during and after exposure to intense illumination,”
J. Physiol., 529 469
–482
(2000). http://dx.doi.org/10.1111/j.1469-7793.2000.00469.x Google Scholar
G. M. Somfai et al.,
“Automated classifiers for early detection and diagnosis of retinopathy in diabetic eyes,”
BMC Bioinf., 15 106
(2014). http://dx.doi.org/10.1186/1471-2105-15-106 BBMIC4 1471-2105 Google Scholar
Q. X. Zhang et al.,
“In vivo optical coherence tomography of light-driven melanosome translocation in retinal pigment epithelium,”
Sci. Rep., 3 2644
(2013). http://dx.doi.org/10.1038/srep02644 Google Scholar
Y. G. Li et al.,
“High spatiotemporal resolution imaging of fast intrinsic optical signals activated by retinal flicker stimulation,”
Opt. Express, 18 7210
–7218
(2010). http://dx.doi.org/10.1364/OE.18.007210 OPEXFF 1094-4087 Google Scholar
M. Pircher et al.,
“Simultaneous SLO/OCT imaging of the human retina with axial eye motion correction,”
Opt. Express, 15 16922
–16932
(2007). http://dx.doi.org/10.1364/OE.15.016922 OPEXFF 1094-4087 Google Scholar
R. W. Lu et al.,
“Super-resolution scanning laser microscopy through virtually structured detection,”
Biomed. Opt. Express, 4 1673
–1682
(2013). http://dx.doi.org/10.1364/BOE.4.001673 Google Scholar
B. Wang et al.,
“Breaking diffraction limit of lateral resolution in optical coherence tomography,”
Quant. Imaging Med. Surg., 3 243
–248
(2013). http://dx.doi.org/10.3978/j.issn.2223-4292.2013.10.03 Google Scholar
Biography |


