
|
|
1.IntroductionPrevious studies have shown that mid-infrared (IR) free-electron lasers (FELs) can ablate soft tissues at rapid and reproducible rates.1–4 Furthermore, when the FEL wavelength was tuned to resonance with the amide I or amide II vibrational modes of protein—centered at 6.10 and respectively—post-ablation histology showed just a thin zone (10 to ) of thermally damaged tissue around the crater periphery.1–4 These results spurred the push to conduct human trials of FELs for neurosurgical applications.5–7 These trials yielded favorable results, but the large size and high costs of FELs made them impractical for widespread use. Several mid-IR laser systems have since been evaluated as alternatives. Some used nonlinear frequency conversion in solid-state crystalline materials,8,9 but the necessarily high pulse energies also led to rapid and permanent damage of the converting crystals. More recent alternatives have used stimulated Raman conversion in pure gases.10–12 Recirculation of the converting gas enables these systems to quickly and completely recover from optical breakdown, leading to more robust performance. Initial reports showed that one of these systems—a prototype Raman-shifted alexandrite (RSA) laser—was capable of ablating a variety of soft tissues at surgically relevant rates;12 however, the operating parameters of the RSA laser differ substantially from those of mid-IR FELs: a pulsewidth of just 25 ns12 as opposed to an FEL’s extended -long train of picosecond pulses;1 and a bandwidth of 15 nm full width at half maximum (FWHM) versus 200 nm.13 It is not immediately clear how these different operating parameters impact the RSA laser’s soft-tissue ablation metrics. Here, we measure the RSA laser’s key ablation metrics—threshold, etch rate, and amount of collateral damage—at several wavelengths and over a range of accessible pulse energies, spot diameters, and fluences. We chose three wavelengths in the 6- to window because this range maximizes the partitioning of absorbed energy into tissue structural proteins.1,14 We find that there are some regions of the laser’s operational parameter space in which it ablates tissue cleanly and with acceptable reproducibility, but others in which collateral damage is extensive and crater depth is barely predictable. Within the limited range tested, the operational parameter that most strongly determines the accuracy and predictability of ablation is not wavelength, but is instead the combination of pulse energy and focused spot diameter. 2.Materials and Methods2.1.Laser Parameters and OperationDesign details of the prototype RSA laser have been previously published.12 Summarizing its operational characteristics, the laser’s mid-IR output was continuously tunable from to with a bandwidth of FWHM, a pulsewidth of 25 ns, and a repetition rate of 10 Hz. The laser emission spectrum was measured using a calibrated monochromator setup with a linear pyroelectric array detector (Spiricon LP-256-12-, Ophir-Spiricon LLC, Logan, Utah). The laser pulsewidth was measured using a fast photoelectromagnetic detector (PEM-1, Boston Electronics, Brookline, Massachusetts). The final multipass Raman converter was aligned daily to optimize the spatial mode of its mid-IR output using an infrared camera (Pyrocam III, Ophir-Spiricon LLC). When optimized, the maximum obtainable pulse energy ranged from 1 to 3 mJ and was strongly wavelength dependent (see Sec. 3.1 below). For the experiments here, the laser was operated at one of three selected center wavelengths: 6.09, 6.27, or . 2.2.Sample PreparationGelatin samples were prepared at 10% weight/weight by adding boiling water to powdered gelatin (Knox, Kraft Foods Inc.). Once completely dissolved, the solution was poured into Petri dishes, and refrigerated until just before use. Whole eyes were freshly harvested from euthanized pigs, goats, or dogs. These eyes were stored in a refrigerator for no more than 24 h before use. All samples were warmed to room temperature before experiments and kept moist during experiments. For precise positioning with respect to the ablating laser beam, samples were horizontally mounted on a three-dimensional linear translation stage. Whole eyes were mounted onto the stage using a hemispherical holder in which they were held in place by moist tissues. 2.3.Experimental SetupMid-IR pulses from the prototype RSA laser were reflected downward (perpendicular to the optical table) toward the horizontal sample surface. The beamline before the sample consisted of a fast shutter (VS-25 Uniblitz, Vincent Associates, Rochester, New York), a holographic wire-grid polarizer (WP25H-C, Thorlabs Inc., Newton, New Jersey), a beamsplitter, a plano-convex lens, and a final 45-deg first-surface mirror. Before each set of experiments, the laser was adjusted for maximum mid-IR output. This output was horizontally polarized and the actual pulse energy delivered to the sample was attenuated as needed using the wire grid polarizer. The pulse energy was monitored and recorded during experiments by using the beamsplitter to direct a small fraction of each laser pulse toward a sensitive pyroelectric energy meter (Molectron J10, Coherent Inc., Santa Clara, California). A He–Ne laser was reflected from the other side of the beamsplitter and aligned with the transmitted mid-IR beam to serve as a positioning guide when placing samples to be ablated. A custom LabView program (National Instruments, Austin, Texas) controlled the fast shutter to deliver a specified number of pulses to each targeted spot and also interfaced with the energy meter to record the energies of the picked-off fraction of each pulse—converted via a measured calibration to yield the actual pulse energies delivered to each sample. Spot size at the sample surface was primarily controlled by changing from one focusing lens to another ( or 200 mm). To fully characterize the beam waist near the target, the beam diameter was measured at multiple heights above the optical table using a knife-edge technique. For all etch rate measurements, the sample surface was positioned at the waist of the focused beam. For threshold fluence measurements, the sample surface was placed at various distances before the beam waist, allowing exploration of a wider range of spot sizes. 2.4.Exposure and AnalysisFor ablation threshold measurements, single laser pulses with varying energy were each directed to a fresh spot on a sample surface; brightfield illumination was used to visually detect ejected material; and the energy of each pulse was recorded along with a “0” or “1” to indicate the absence or presence of ejected material. Threshold energies were extracted using probit analysis,15 i.e., binomial regression of the yes/no responses using an underlying probability function. This analysis was conducted using the function ProbitModelFit in Mathematica (Wolfram Inc., Champaign, Illinois) with probability function where is the pulse energy and and are the fit parameters. Threshold was taken as the pulse energy that yielded a 50% probability of producing a visible ablation plume: .For etch rate measurements, a two-dimensional grid of craters was made on each sample surface using a fixed nominal pulse energy. Craters were spaced at least 1 mm apart with each crater in a single row being exposed to the same number of pulses. The number of pulses used was then varied from one row to the next. During these exposures, the sample surface was periodically moistened with normal saline, and excess moisture was removed with a tissue. Immediately after ablation, the sample was imaged via optical coherence tomography (OCT) to determine crater depths and variability. To evaluate collateral damage, some exposed and OCT-imaged corneas were then fixed for 24 h in Penfix (Richard-Allan-Scientific, Kalamazoo, Michigan), processed for paraffin embedding, cut into thick cross sections, and stained with hematoxylin and eosin (H&E). 3.Results3.1.Obtainable Laser Pulse EnergiesAs shown in Fig. 1(a), the tunable range of the RSA laser’s mid-IR output (6.0 to ) corresponds to a spectral region containing the amide I and II bands of tissue protein—centered at 6.10 and —and the overlapping water bending mode—also centered at . This is also the same region in which atmospheric water vapor has a dense thicket of narrow ro-vibrational bands. We find a negative correlation between this latter spectrum and the RSA laser’s tuning curve. For example, when the laser was tuned to a center wavelength of , the maximum obtainable pulse energy was around 1.0 mJ, but a slight detuning to , which falls in a gap between ro-vibrational lines, raised this to around 2.0 mJ. This problem becomes particularly acute near at the long wavelength end of the laser’s tunable range. After exploring detuning to longer and shorter wavelengths, we found the best performance for a center wavelength of , but even here the maximum obtainable pulse energy was just 1.0 mJ. We often could not get any laser output centered at . For subsequent experiments, we thus operated the laser at the selected center wavelengths of 6.09 and . Given that the targeted tissue absorption bands are very broad (each wide), we expect shifts of just 10 to 20 nm from the tissue absorption peaks to have negligible effects on tissue ablation metrics. To the pair of wavelengths selected on the above basis, we added because it falls in the large gap between the P and R branches of the water vapor ro-vibrational spectrum. At this wavelength, we could obtain pulse energies as large as 2.5 mJ. Fig. 1Tunability and stability of the prototype Raman-shifted alexandrite (RSA) laser. (a) Comparison of tunable RSA laser emission at 6.09, 6.27, or (shaded vertical lines, available one at a time) to the overlapping water and amide I/II absorption bands of corneal stroma (thick gray line) and the sharp, narrow absorption bands of atmospheric water vapor (thin red line). The vertical scale corresponds to absorbance of a thick layer of corneal stroma; the water vapor absorbance is scaled arbitrarily. Width of the shaded vertical lines corresponds to the measured RSA laser linewidth of 15 nm. (b) Histograms of RSA laser pulse energies for 1 min of continuous operation at a repetition rate of 10 Hz and an of (left, blue) or (right, magenta). The inset shows a corresponding 1-min temporal trace of pulse energies.  The pulse energies noted above were those obtainable immediately after baking the final convertor, purging it with dry , and refilling it with dry . The obtainable pulse energies would then decline over a few weeks until performance dropped below usable levels—requiring another cycle of baking, purging, and refilling the convertor. Even for our selected compromise wavelengths, the RSA laser output varied considerably from pulse to pulse. As shown in Fig. 1(b), the standard deviation of pulse energy was to 45% of the average pulse energy. These fluctuations impair the repeatability of ablation. As demonstrated below, this impairment is sometimes modest, but other times severe. In the results below, we use the phrase “constant nominal pulse energy” to indicate conditions in which the pulse energy undergoes these large fluctuations, but was not intentionally changed. 3.2.Ablation ThresholdsFor the three selected wavelengths, the threshold energy needed for ablation of gelatin or cornea was measured using probit analysis of brightfield illumination data. An example analysis is shown in Fig. 2(a) with threshold defined as the pulse energy yielding a 50% probability for observing ejected material. Fig. 2Ablation thresholds for cornea and gelatin as a function of laser wavelength () and spot diameter (). (a) Example probit analysis of threshold data for cornea at and . The graph shows individual measurements in which an ablation plume was either observed or not (open circles at 100% or 0 respectively), along with a probit model fit (solid line). For comparison, the measurements were also divided into eight pulse-energy bins to provide model-free estimates of the ablation probabilities (closed gray circles). Ablation threshold (50% probability of plume observation) is for this example. (b) Threshold energy and (c) fluence for RSA laser ablation of gelatin (closed symbols) or cornea (open symbols) using laser wavelengths of (blue circles), (green squares), or (red triangles). (d) Threshold fluence for RSA laser ablation of water for . Error bars in (b-d) denote standard errors from probit analysis and from knife-edge measurement of the laser spot size at the sample surface.  Table 1 compiles thresholds measured at the beam waist using either a 100-mm or 200-mm focal-length lens that yielded beam waist diameters or , respectively. We will refer to these as the 100- and beam waists. As this table demonstrates, for a given sample and beam waist, there is significant wavelength dependence. The lowest thresholds were always obtained at the wavelength absorbed most strongly by both cornea and gelatin (). There is also an interesting spot-size dependence. As one would expect, the threshold energies increased with beam waist diameter; however, they did not increase as much as the -fold increase in irradiated area. The result is that larger beam waists actually led to a decrease in the threshold fluences. For cornea, this decrease was substantial, dropping from to . Table 1Ablation thresholds for gelatin and cornea for three Raman-shifted alexandrite laser wavelengths and two beam waist diameters. Measurements were not conducted for gelatin samples using a larger beam waist at a wavelength of 6.27 μm.
To further investigate the spot-size dependence, we increased the spot diameter by displacing the sample surface away from the beam waist. As shown in Fig. 2(b), for all wavelengths and both samples, the threshold energies increased with spot size, but not as quickly as the irradiated area, again implying that threshold fluence decreased with increasing spot size. This trend is clearly evident over a wide range of spot sizes for ablation of gelatin at a wavelength of . We tested fewer spot sizes for other wavelengths and for cornea samples. Nonetheless, as shown in Fig. 2(c), each combination of sample and wavelength with more than one tested spot size had lower threshold fluence at larger spot diameters. In fact, the decrease in threshold for larger spots was stronger for cornea than for gelatin. We also tested the spot-size dependence for ablation of water at and found that it was very weak (note the different vertical scales in Figs. 2(c) and 2(d)—varying between 0.15 and with only a slight decreasing trend despite a 3.6-fold change in spot diameter. The increase in spot-size dependence from water to gelatin to cornea suggests that the underlying mechanism involves the sample’s mechanical strength. 3.3.Etch Rates and Variability with Soft FocusingThe spot-size dependence becomes even stronger for measurements of etch rates and their variability. We thus present the results separately for our two beam waist diameters—first for “soft-focusing” conditions using a 200-mm focal length lens and placing the sample surface at the beam’s waist. Under these conditions, the focused beam had a calculated Rayleigh range of and its calculated diameter remained within 10% of its waist size for . These calculated values are consistent with measurements of the beam diameter made before and after the beam waist. Note that both values are larger than the deepest craters evaluated. For each gelatin or cornea sample, multiple ablation craters were made at a single wavelength and constant nominal pulse energy. These craters were made in a grid pattern with each crater in a given row made using the same number of pulses. The number of pulses then varied from one row of craters to the next. Each sample was imaged via OCT immediately after completion of its grid of ablation craters. Cross-sectional OCT images of single rows of relatively deep craters made in gelatin and cornea are shown in Figs. 3(a) and 3(e), respectively. All craters in a single image were made using the same wavelength, nominal pulse energy, and number of pulses [different parameters were used in Fig. 3(a) versus Fig. 3(e)]. At shallow depths, the craters are roughly cylindrical in both materials. At deeper depths, the craters made in gelatin maintain a nearly constant width, but those in cornea develop a markedly conical shape. Fig. 3Crater depth measurements for gelatin (a-d) and cornea (e-h) under soft-focusing conditions—i.e., spot diameter . (a, e) Typical optical coherence tomography (OCT) images each showing a row of ablation craters. The gelatin craters shown in (a) used 320 pulses at and an average pulse energy . The cornea craters shown in (e) used 80 pulses at with . Scale bars are . (b, f) Example progressions of crater depth () versus number of pulses delivered. Open circles show depths of individual craters; solid lines are the best linear fits to using fixed zero offsets; shaded regions correspond to 95% confidence limits for single crater predictions. These examples used and (for gelatin) or 1.35 mJ (for cornea) to yield fitted etch rates of or , respectively. (c, g) Compilations of fitted etch rates as a function of average pulse energy. Symbols denote laser wavelength as described in the legend (also applies to d, g, and h). Thick solid lines are the best linear fits to for all three wavelengths combined; shaded regions correspond to 95% confidence limits. (d, h) Compilation of individual etch rates, , for all craters. Thin horizontal lines represent craters for which individual pulse energies were not measured during exposure and extend from the average pulse energy (measured before ablation) ± one standard deviation. Thick solid lines and shaded regions are an overlay of the regression from (c, g).  There were instances in which one or more craters penetrated through the entire cornea. When this occurred, fluid from the aqueous humor could leak out onto the corneal surface, absorb laser light delivered to nearby locations, and severely retard the ablation rate (sometimes completely preventing ablation of the cornea itself). This could lead to variations in crater depth up to 100%, but these are artifacts. Subsequent analysis thus excluded any craters that penetrated through a cornea, as well as any craters made after a perforation. The OCT images were used to measure the depths of all partial-thickness ablation craters. When using nominally identical laser parameters, we found quite consistent crater depths within a single sample (standard deviation of the mean depth in gelatin, in cornea). This consistency held despite some targeted spots being about past the beam waist due to curvature of the cornea surface [see Fig. 3(d)]. On the other hand, crater depths in cornea could differ by as much as a factor of 2 between samples. We did use corneas from several species (dog, pig, and goat), but the large sample-to-sample variations were not correlated with the species of origin; the variations were as large within samples from a single species as between those of different species. For subsequent analysis, we thus grouped cornea data from all three species. For each sample, we measured multiple crater depths, , made using the same wavelength, spot-size, and nominal pulse energy, but a variable number of pulses. Examples of single-sample datasets for gelatin and cornea are shown in Figs. 3(b) and 3(f), respectively. Each such dataset was fit to a simple linear regression with fixed zero offset to estimate the etch rate (in ). Note that without a fixed zero offset, the large majority of linear fits would intersect the - or -axis in the region , indicating that crater depths increased more rapidly for the first few laser pulses before reaching a steady-state rate. Forcing the offset to zero provides a better estimate of the average etch rate as opposed to the marginal etch rate. For the two examples shown in Figs. 3(b) and 3(e), was and , as labeled on the plots. Overall for soft-focusing conditions, ranged from to just over , increasing with nominal pulse energy. The fitted etch rates ( in ) and their estimated standard errors () were then compiled and compared to determine the dependence on pulse energy. Results compiled from 6 gelatin samples and 11 corneas are shown in Figs. 3(c) and 3(g). The corresponding individual crater etch rates () are shown in Figs. 3(d) and 3(h) (for 285 and 450 craters respectively). As all four graphs show, there is a clear dependence on pulse energy. Unfortunately, too few independent samples were analyzed to determine whether there was a significant wavelength dependence. For the limited range of pulse energies testable—limited by both ablation thresholds and by the maximum obtainable pulse energies—we used linear regression of the fitted etch rates from all wavelengths to estimate how etch rate depends on average pulse energy . Given the large sample-to-sample variance, Figs. 3(c) and 3(g) show both the best linear fit and the 95% confidence region for predictions of etch rate in single samples. The equations corresponding to these fits for gelatin and cornea are respectively: Interestingly, the slope of the pulse-energy dependence was larger for the mechanically stronger cornea samples. 3.4.Collateral Damage with Soft FocusingWe used histology based on H&E staining to evaluate collateral damage zones around the ablation craters. The craters evaluated for histology under soft-focusing conditions each used 50 pulses at a constant nominal pulse energy of 1.2 mJ. Representative results for our three selected wavelengths are shown in Fig. 4. Fig. 4Evaluation of collateral damage from histology images (H&E staining) of ablation craters made in porcine cornea under soft-focusing conditions (). Each crater was made at the noted wavelength using 50 laser pulses at 10 Hz and roughly 1.2 mJ per pulse. Scale bar corresponds to all three images. Arrows in the 6.43-μm panel mark the edges of a homogenized zone. 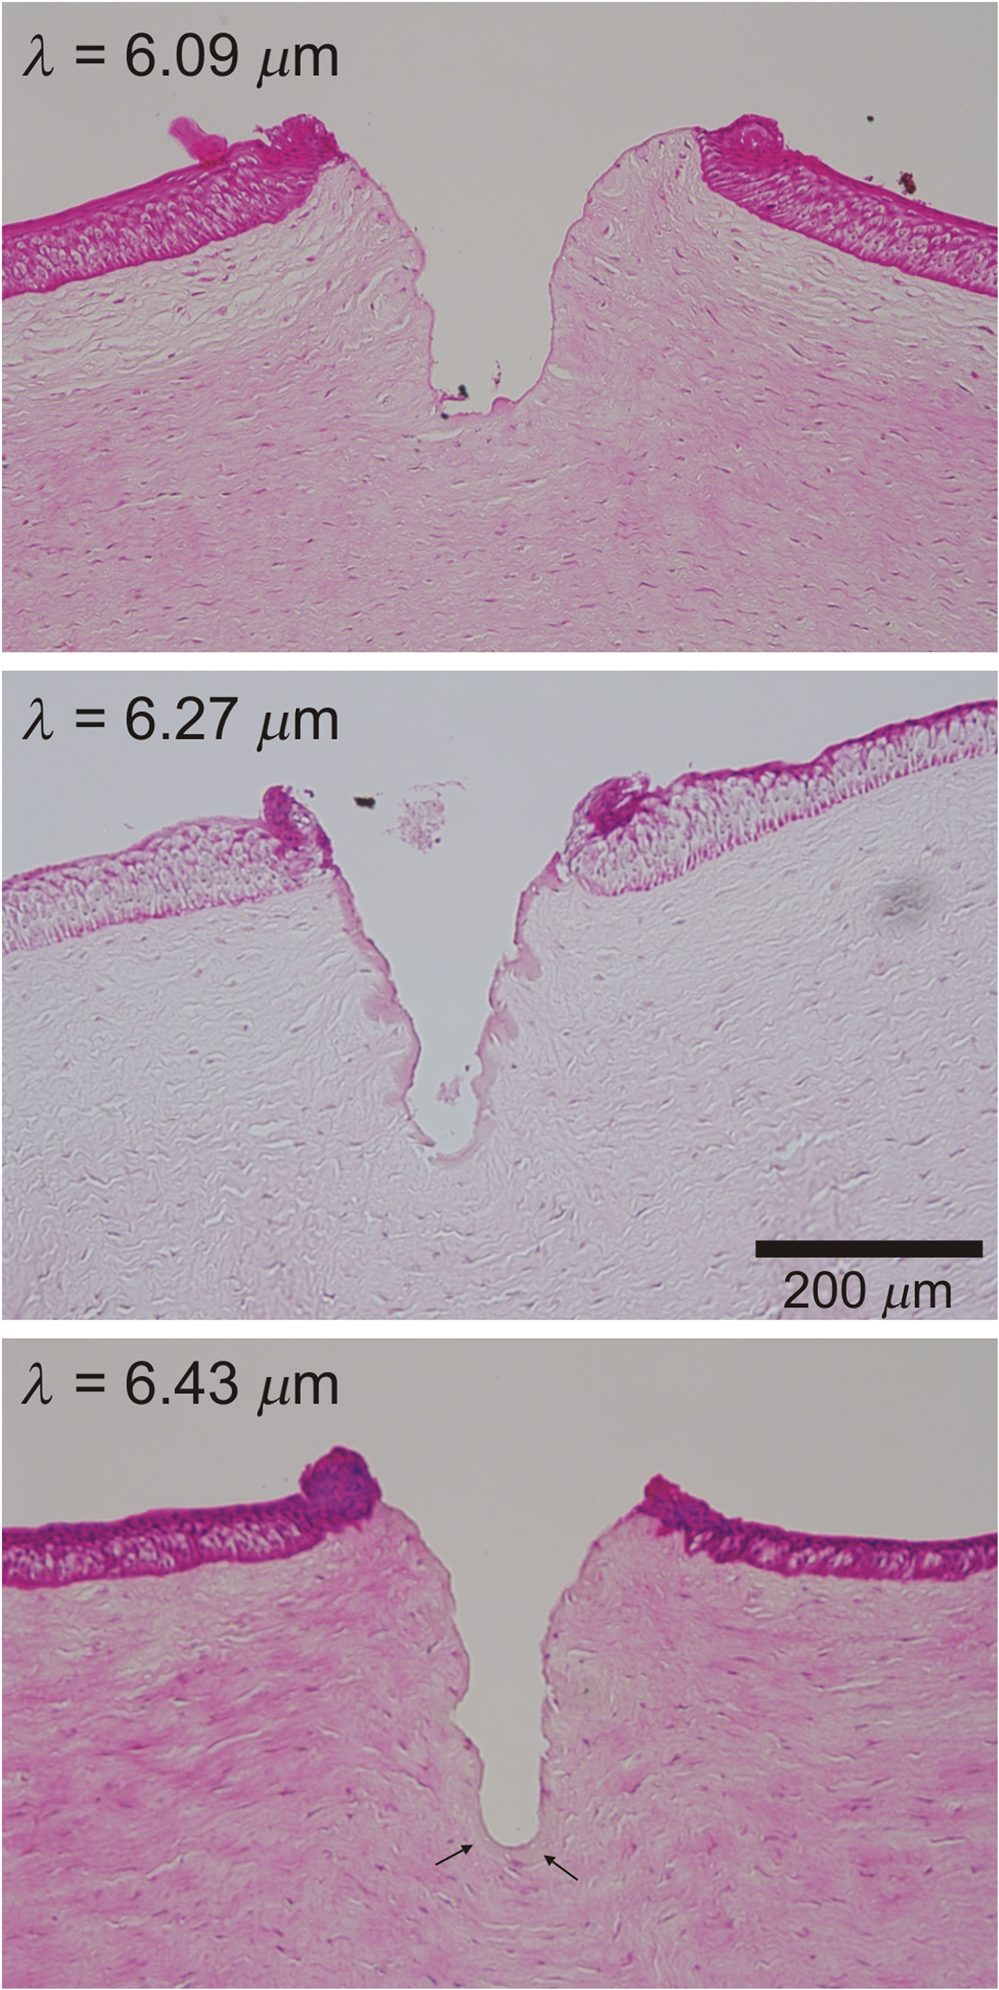 All three wavelengths are absorbed by both tissue water and protein, but with different degrees of energy partitioning. Among the three wavelengths tested, yields the largest absorbed energy density in protein;16 yields the least. Despite these differences, we observe similar patterns of collateral damage. The example shown in Fig. 4(a) for ablation displays the consistently observed structural changes: a slight swelling near the surface, a curling of the adjacent epithelial layer, and a thin darker-staining region of thermal damage along the crater margin. These features were observed for most craters at all three wavelengths with the extent of thermal damage being somewhat wavelength dependent: thick for , 10- to thick for [Fig. 4(b)], and nearly imperceptible for [Fig. 4(c)]. Many craters made with did, however, have a thicker () zone around the crater margin with a homogenized appearance [arrow in Fig. 4(c)]. Nonetheless, for all three wavelengths, the extent of thermal collateral damage was and comparable to previous studies using FELs to ablate soft tissues.1–4 In all cases, using soft focusing, there were no discernable tears or voids indicative of mechanical damage. 3.5.Etch Rates and Variability with Tight FocusingGiven that the RSA laser could only produce a few mJ of energy per pulse at the tested mid-IR wavelengths, we also tested its performance when higher fluence was achieved using a more tightly focused beam. We used a 100-mm focal length lens for these tight-focusing experiments and placed the sample surface at the beam’s waist. Under these conditions, the focused beam had a much smaller calculated Rayleigh range of with its diameter remaining within 10% of its waist size for just . These calculated values are again consistent with measurements of the beam diameter made before and after the beam waist, but are now comparable to the depth of our deepest craters. For gelatin samples, tighter focusing yielded roughly higher etch rates with variability at least comparable to, if not better than that observed above [Figs. 5(a)—5(d)]. In contrast, etch rates for cornea varied remarkably [Figs. 5(e)–5(h)]. For pulse energies , etch rates in cornea were usually low, just 1 to , but already demonstrated 20% to 30% variability in crater depth. For slightly higher pulse energies, i.e., just above 1 mJ, the etch rates jumped to 10 to . The variability in crater depths also jumped to 200% to 400%. This variability dominates the compilation of data from multiple samples and conditions shown in Figs. 5(g) and 5(h), but it is already evident in the single cornea sample shown in Fig. 5(e). Although every crater in the row shown received 20 pulses at the same wavelength () and same nominal pulse energy (1.2 mJ), the crater depths varied from 150 to . Fig. 5Crater depth measurements for gelatin (a-d) and cornea (e-h) under tight-focusing conditions—i.e., spot diameter . (a, e) Typical OCT images each showing a row of ablation craters made using the same nominal exposure conditions: and average pulse energy . Gelatin craters were each made with 100 pulses; cornea craters were each made with just 20 pulses. Scale bars are both . (b, f) Example progressions of crater depth () versus number of pulses delivered. Open circles show depths of individual craters; solid lines are the best linear fits to with fixed zero offset; shaded regions correspond to 95% confidence limits for single crater predictions. These examples used the same exposure conditions ( and ) to yield very different fitted etch rates: in gelatin, but in cornea. (c, g) Compilations from 16 gelatin samples and 10 corneas of fitted etch rates as a function of average pulse energy. Symbols denote laser wavelength as described in the legend (also applies to d, g, and h). Thick solid lines are the best linear fits to for all three wavelengths combined; shaded regions correspond to 95% confidence limits. (d, h) Compilation of individual etch rates, , for all craters. Thin horizontal lines represent craters for which individual pulse energies were not measured during exposure and extend from the average pulse energy (measured before ablation) ± one standard deviation. Thick solid lines and shaded regions are an overlay of the regression from (c, g).  Given the much larger etch rates for pulse energies above 1 mJ, tight-focusing conditions frequently led to rapid accidental perforation of the cornea. The data in Fig. 5(g) do include one dataset in which just 50 pulses penetrated all the way through a cornea. These data points have a single upward-pointing arrow instead of error bars to denote this measurement as a lower bound on the etch rate. As noted above, perforation of a cornea altered the sample by allowing seepage of intraocular fluid onto the corneal surface and made subsequent measurements unreliable. Subsequent analysis thus excluded craters made after a perforation; however, OCT images of suspected perforating craters often appeared to have collapsed, making it difficult to ascertain whether full perforation actually occurred. Incorrect assessments of perforation could thus contribute to the variability observed under tight-focusing conditions. Following the same procedures for estimating the etch rate for single samples [Figs. 5(b) and 5(f)] and then compiling these results for all tested wavelengths again shows a clear pulse-energy dependence [Figs. 5(c) and 5(g) with 23 and 10 samples, respectively). The same trend is evident in a compilation of all individual crater etch rates, [Figs. 5(d) and 5(h) with 1130 and 218 craters respectively]. Combining data from all three wavelengths under tight-focusing conditions, the dependence of etch rate on average pulse energy is described by the following equations: The slope of the pulse-energy dependence for gelatin increased by less than a factor of 2 under tight-focusing conditions, but it increased by a factor of 5 for cornea. Part of the variability observed among crater depths in cornea under tight-focusing conditions can thus be traced to a combination of this steep pulse-energy dependence and the laser’s 25% to 45% pulse-to-pulse energy variability. Additional sources include pulse-to-pulse changes in the beam’s spatial profile. Regardless of the exact source, it is clear that tight-focusing conditions lead to extreme variability in crater depth. For ablation of gelatin under tight-focusing conditions, we measured etch rates for enough independent samples to evaluate the wavelength dependence (8, 8, and 7 samples, respectively, for , 6.27, and ). To do so, we compared the wavelength independent fit above to a wavelength-dependent linear regression. The wavelength-dependent model yielded a fit with smaller residuals, but at the expense of more parameters (6 versus 2). To compare relative model quality, we used the Akaike Information Criterion, AICc, which is corrected for finite sample size.17 AICc was lower for the two-parameter wavelength independent model, indicating that this model led to less information loss and was thus a preferred description of the data. This result does not necessarily mean that there is no underlying wavelength dependence, only that one is not discernable given a still limited number of independent samples and large sample-to-sample variability. 3.6.Collateral Damage with Tight FocusingGiven the irreproducibility of cornea ablation using tight-focusing and pulse energies above 1 mJ, it is clear that such conditions are not suitable for surgical applications. We thus did not undertake an extensive analysis of collateral damage for all three selected wavelengths, but instead conducted a limited analysis just for . Fig. 6 shows both OCT and histological images of craters made in a cornea using this wavelength and a constant nominal pulse energy of 1.5 mJ. The OCT image taken immediately after ablation shows increased light scattering and swelling around each crater [Fig. 6(a)]. Later histology of fixed samples showed no observable increase in H&E staining along the crater walls, but did show structural changes indicating extensive mechanical damage [Fig. 6(b)]. We observed a roughly wide zone around the sides, and sometimes the bottom of the craters, in which the tissue had multiple fractures and wavy regions of altered density. These fractures were parallel to the corneal surface, suggesting delamination between stromal lamellae. The disruption in tissue structure was also associated with an increased incidence of sample tearing when making histological sections, suggesting a weakened tissue structure. Such extensive mechanical damage was not observed for tight-focusing conditions using when the pulse energy was . Fig. 6Evaluation of collateral damage from (a) OCT and (b) histology of ablation craters made in porcine cornea under tight-focusing conditions (). Craters were made using 50 pulses delivered at 10 Hz with a wavelength of and an average pulse energy of 1.5 mJ. Structural changes around the craters are evident as enhanced scattering in the OCT image and as voids in the histology image. Note that each image has its own scale bar with the histology image zooming in on a single crater from the OCT image.  4.DiscussionWe have measured the characteristic ablation metrics—threshold, etch rate, and collateral damage—using a prototype mid-IR RSA laser to ablate both a mechanically weak soft tissue analog (gelatin) and a mechanically strong soft tissue (cornea) The two samples span a three-order-of-magnitude range of ultimate tensile strengths, 18 to 10 MPa,19 that matches the range from highly cellularized tissues such as liver and kidney parenchyma to connective tissues like skin.20 The wavelengths chosen for these experiments—6.09, 6.27, and —all lie within a set of overlapping water and protein vibrational modes, but were slightly detuned from the wavelengths used in previous studies using mid-IR FELs. Such detuning was necessary to shift the narrow spectral output of the RSA laser to gaps between water vapor ro-vibrational lines. The specific wavelength dependence of the obtainable RSA laser performance can be attributed to a combination of a long-wavelength decline in power available from the primary alexandrite laser and absorption losses inside the system’s final multipass convertor. The latter is the stage in which near-IR light undergoes stimulated Raman conversion to the 6.0- to range. Considering the 1.3-m length of each pass through the convertor, its nonlinear gain process can be effectively poisoned by absorption losses from just trace amounts of water vapor.21 Previous FEL studies did not need to explore similar detuning because the FEL linewidth was much broader, ,13 and thus overlapped multiple water vapor lines, as well as the gaps between them.22 Given the breadth of the targeted absorption features in soft tissues, we expect the slight wavelength shifts used here to yield no significant differences in tissue ablation metrics. In fact, overall, we find limited wavelength dependence. The ablation thresholds are certainly wavelength dependent with the lowest values obtained for . This follows as expected from this wavelength’s larger absorption coefficient [Fig. 1(a)]. Our histological analysis also suggests subtle wavelength differences with leaving behind slightly less thermal collateral damage. As for the etch rates, we only had a sufficient number of samples to evaluate a wavelength dependence for gelatin under tight-focusing conditions. For this combination, an information theoretic approach showed that any wavelength dependence was indiscernible. In contrast, we find an exceptional spot-size dependence. The ablation threshold energy increased with spot size, but at a slower rate than the irradiated area, leading to threshold fluences that decreased with spot size. Considered from another perspective, this means that more tightly focused beams required a higher fluence to initiate tissue removal. Similarly, tighter focusing for a given pulse energy increased the etch rate—by a factor of 2 to 6 depending on sample type and pulse energy—but these increases were less than the nearly 9-fold increase in fluence, meaning that ablation under tight-focusing conditions was substantially less efficient. It was also more highly variable. Finally, the degree of collateral damage observed for pulse energies drastically increased under tight-focusing conditions. All of these observations imply that one cannot simply compensate for limited pulse energy by focusing the beam more tightly. Beam waists do not appear to be suitable for precision ablation using mid-IR lasers in surgical applications; either the etch rates are too low (for ) or variability and collateral damage are too high (). Previous studies of soft tissue ablation using mid-IR FELs and Er:YAG lasers demonstrated similar spot-size dependences for etch rates and thresholds.23 These studies attributed the spot-size dependence to hydrodynamic effects involved in postpulse, recoil-induced material ejection.23–26 These studies noted no spot-size dependence for collateral damage, but only when fluence was held constant; when fluence increased, so did collateral damage.23 This is consistent with our results in which tight focusing increased the fluence by a factor of 9 and led to drastically more mechanical damage. The evidence of delamination and mechanical tearing seen in these samples is also consistent recoil-induced material ejection that is constrained by the tissue’s mechanical strength.27 Despite the fact that the spot-size dependence is generally consistent with previous observations, tight focusing leads to an extremely steep dependence on pulse energy—a dependence that is detrimental to precision surgery. On the other hand, if one limits laser operation to soft-focusing conditions, then the prototype RSA laser is capable of ablating soft tissues at surgically relevant rates and with reasonable reproducibility. The variability in crater depth within a single sample at the same nominal conditions was as low as 5% for our homogeneous gelatin sample and only increased to 12% for cornea. These values represent the current status of the prototype laser’s stability-limited performance. Much of the within-sample crater variability can be attributed to fluctuations in the total amount of energy actually delivered. With improvements to the laser’s pulse energy and spatial-profile stability, it may achieve the level of reproducibility and predictability needed for precision surgical applications. Nonetheless, even with zero fluctuations in laser parameters, natural variability in the mechanical properties of living tissue remains a problem. This is clearly evident—even using soft focusing—in the 2-fold differences in crater depth observed using nominally identical laser parameters on different cornea samples. The ideal situation for precise surgical procedures would employ real-time measurements of crater depth, allowing interactive cutting, and computer-guided beam delivery. Such interactive techniques are feasible, and prototypes have been demonstrated.28,29 Coupling these techniques to a light source similar to the prototype RSA laser tested here could provide an extremely useful surgical tool. AcknowledgmentsThis work supported by: Department of Defense STTR W81XWH-08-C-0109; NIH Core under Grant No. 5P30 EY08126-27; unrestricted departmental grant from Research to Prevent Blindness, Inc., New York; and the Joseph Ellis Family Research Fund. We thank Marc Klosner and Chunbai Wu of Light Age Inc. for their assistance with maintenance and optimization of the prototype RSA laser. ReferencesG. Edwards et al.,
“Tissue ablation by a free-electron laser tuned to the amide-II band,”
Nature, 371
(6496), 416
–419
(1994). http://dx.doi.org/10.1038/371416a0 Google Scholar
J. I. Youn et al.,
“Mid-IR laser ablation of articular and fibro-cartilage: a wavelength dependence study of thermal injury and crater morphology,”
Lasers Surg. Med., 38
(3), 218
–228
(2006). http://dx.doi.org/10.1002/lsm.20288 LSMEDI 0196-8092 Google Scholar
K. M. Joos et al.,
“Acute optic nerve sheath fenestration in humans using the free electron laser (FEL): a case report,”
Proc. SPIE, 4611 81
–85
(2002). http://dx.doi.org/10.1117/12.470579 PSISDG 0277-786X Google Scholar
R. A. Hill et al.,
“Free-electron laser (FEL) ablation of ocular tissues,”
Lasers Med. Sci., 13
(3), 219
–226
(1998). http://dx.doi.org/10.1007/s101030050078 Google Scholar
G. S. Edwards et al.,
“Free-electron-laser-based biophysical and biomedical instrumentation,”
Rev. Sci. Instrum., 74
(7), 3207
–3245
(2003). http://dx.doi.org/10.1063/1.1584078 RSINAK 0034-6748 Google Scholar
M. L. Copeland, R. J. Maciunas, G. S. Edwards, Neurosurgical Topics: Advanced Techniques in Central Nervous System Metastases, 113
–122 The American Association of Neurological Surgeons, Park Ridge, Illinois
(1998). Google Scholar
K. M. Joos et al.,
“Human optic nerve sheath fenestration with the free electron laser (FEL),”
Invest. Ophthalmol. Vis. Sci., 45
(13), 45
(2004). IOVSDA 0146-0404 Google Scholar
G. Edwards et al.,
“Comparison of OPA and Mark-III FEL for tissue ablation at 6.45 microns,”
Proc. SPIE, 4633 194
–200
(2002). http://dx.doi.org/10.1117/12.461379 Google Scholar
M. A. Mackanos et al.,
“Mid infrared optical parametric oscillator (OPO) as a viable alternative to tissue ablation with the free electron laser (FEL),”
Lasers Surg. Med., 39 230
–236
(2007). http://dx.doi.org/10.1002/lsm.20461 LSMEDI 0196-8092 Google Scholar
S. Wada et al.,
“Two-stage Raman convertor covering the whole infrared spectrum with tunable solid-state lasers,”
Appl. Phys. B, 57
(6), 435
–439
(1993). http://dx.doi.org/10.1007/BF00357388 Google Scholar
G. S. Edwards et al.,
“6450-nm wavelength tissue ablation using a nanosecond laser based on difference frequency mixing and stimulated Raman scattering,”
Opt. Lett., 32 1426
–1428
(2007). http://dx.doi.org/10.1364/OL.32.001426 OPLEDP 0146-9592 Google Scholar
J. Kozub et al.,
“Raman-shifted alexandrite laser for soft tissue ablation in the 6- to wavelength range,”
Biomed. Opt. Express, 2
(5), 1275
–1281
(2011). http://dx.doi.org/10.1364/BOE.2.001275 Google Scholar
J. A. Kozub, B. Feng and W. E. Gabella,
“Measurements of the spectral and temporal evolution of FEL macropulses,”
Proc. SPIE, 4633 153
–161
(2002). http://dx.doi.org/10.1117/12.461375 PSISDG 0277-786X Google Scholar
M. S. Hutson, S. A. Hauger and G. Edwards,
“Thermal diffusion and chemical kinetics in laminar biomaterial due to heating by a free-electron laser,”
Phys. Rev. E, 65
(6), 061906
(2002). http://dx.doi.org/10.1103/PhysRevE.65.061906 Google Scholar
C. I. Bliss,
“The method of probits,”
Science, 79
(2037), 38
–39
(1934). http://dx.doi.org/10.1126/science.79.2037.38 SCIEAS 0036-8075 Google Scholar
M. S. Hutson and G. S. Edwards,
“Advances in the physical understanding of laser surgery at 6.45 microns,”
in Proc. 26th Int. Free Electron Laser Conf. and 11th FEL Users Workshop,
(2004). Google Scholar
Model Selection and Multimodel Inference: A Practical Information-Theoretic Approach, 2nd ed.Springer-Verlag, New York
(2002). Google Scholar
A. E. Forte et al.,
“Modelling and experimental characterisation of the rate dependent fracture properties of gelatine gels,”
Food Hydrocolloids, 46 180
–190
(2015). http://dx.doi.org/10.1016/j.foodhyd.2014.12.028 FOHYES 0268-005X Google Scholar
E. Spörl et al.,
“Thermomechanical behavior of the cornea,”
Ger. J. Ophthalmol., 5 322
–327
(1997). GJOPEC 0941-2921 Google Scholar
F. A. Duck, Physical Properties of Tissues: A Comprehensive Reference Book, 156
–157 Academic Press, San Diego
(1990). Google Scholar
P. R. Battle, J. G. Wessel and J. L. Carlsten,
“Growth from spontaneous emission in a Raman multipass cell,”
Phys. Rev. A, 47
(5), 4308
–4312
(1993). http://dx.doi.org/10.1103/PhysRevA.47.4308 Google Scholar
J. A. Kozub, B. Feng and W. E. Gabella,
“Mid-infrared FEL absorption spectra,”
Proc. SPIE, 4633 162
–172
(2002). http://dx.doi.org/10.1117/12.461376 PSISDG 0277-786X Google Scholar
M. S. Hutson et al.,
“Interplay of wavelength, fluence and spot-size in free-electron laser ablation of cornea,”
Opt. Express, 17 9840
–9850
(2009). http://dx.doi.org/10.1364/OE.17.009840 Google Scholar
I. Apitz and A. Vogel,
“Material ejection in nanosecond Er:YAG laser ablation of water, liver and skin,”
Appl. Phys. A, 81 329
–338
(2005). http://dx.doi.org/10.1007/s00339-005-3213-5 Google Scholar
A. Vogel, I. Apitz, V. Venugopalan,
“Phase transitions, material ejection, and plume dynamics in pulsed laser ablation of soft biological tissues,”
Oscillations, Waves and Interactions, 217
–258 Universitätsverlag Göttingen, Göttingen
(2007). Google Scholar
A. Vogel and V. Venugopalan,
“Mechanisms of pulsed laser ablation of biological tissues,”
Chem. Rev., 103 577
–644
(2003). http://dx.doi.org/10.1021/cr010379n CHREAY 0009-2665 Google Scholar
J. P. Cummings and J. T. Walsh,
“Tissue tearing caused by pulsed laser-induced ablation pressure,”
Appl. Opt., 32 494
(1993). http://dx.doi.org/10.1364/AO.32.000494 APOPAI 0003-6935 Google Scholar
K. M. Joos and J. H. Shen,
“Miniature real-time intraoperative forward-imaging optical coherence tomography probe,”
Biomed. Opt. Express, 4
(8), 1342
–1350
(2013). http://dx.doi.org/10.1364/BOE.4.001342 Google Scholar
Z. Y. Li et al.,
“Miniature forward-imaging B-scan optical coherence tomography probe to guide real-time laser ablation,”
Lasers Surg. Med., 46
(3), 193
–202
(2014). http://dx.doi.org/10.1002/lsm.22214 LSMEDI 0196-8092 Google Scholar
BiographyJohn Kozub received his PhD in physics at Vanderbilt University in Nashville, TN, in 1995. He worked as a research engineer at the Keck Free Electron Laser Center at Vanderbilt, then served as associate director of the FEL Center from 2005 to 2008. He works with investigators in the Departments of Physics, Engineering, Chemistry, and the Vanderbilt Medical Center, investigating the interactions of lasers with a wide range of materials. Jin Hui Shen received his PhD in ultrafast optical phenomena from Shanghai Institute of Optics and Fine Mechanics, Shanghai, China, in 1991. Currently, he is a research assistant professor at the Vanderbilt Eye Institute, Vanderbilt University, Nashville, TN. His research focuses on the development and testing of laser and optical coherence tomography probes. Karen Joos received her PhD in anatomy and her MD at the University of Iowa, Iowa City, Iowa. She is professor of ophthalmology and chief of the Glaucoma Division at the Vanderbilt Eye Institute, Vanderbilt University, Nashville, TN. Clinically she specializes in the medical and surgical management of adult and pediatric glaucoma. Her research interest includes laser and optical coherence tomography projects. Ratna Prasad is a research assistant III at the Vanderbilt Eye Institute, Nashville, TN. She specializes in multiple laboratory techniques including histology. She received her training at Gauhati University, India, with an MS in plant science mycology and pathology, and her PhD in science pathophysiology. M. Shane Hutson received his PhD in biophysics from the University of Virginia. He is associate professor of physics at Vanderbilt University, Nashville, TN. His research interest includes the physics of laser–tissue interactions, the development of mid-infrared surgical lasers, and the use of laser microsurgery for probing cellular and developmental mechanics. |
||||||||||||||||||||||||


